Alpha Pointer for cTrader: the original, ported and verified bar by bar
One line that only moves with the trend: an ATR level under or over each bar, with the CCI deciding which side, that can hold flat but never step back. A gradient band runs from each candle to the line, and every turn gets a pointer at the swing where the move began. The cTrader edition is a C# transcription checked against the original on the same bars, value by value and pixel by pixel - including a call the original's own compiler warns about.
cTrader 5.x · C# on the cAlgo API · 38 parameters: the 9 of the original plus 29 cTrader-only · AccessRights = None, webhook included · free on the cTrader Store
ICMARKETS EURUSD M5 with four probe generations across EURUSD M5, M15 and H1 and XAUUSD M5, and sixteen input sweeps covering every smoothing type, every source and the CCI, ATR and multiplier extremes. Every internal series, the direction, the pointers and all three alert conditions compared on identical bars, at zero in the indicator's own output; the one residue is the CCI's last bit, declared run by run and zero at the defaults. Then the drawing itself, compared with TradingView's own screenshots. Zero was the acceptance bar, set before any C# was written.
The Alpha Pointer gallery, picture by picture
The 10 pictures of the cTrader Store gallery. Select any picture to open it full size.




What it does
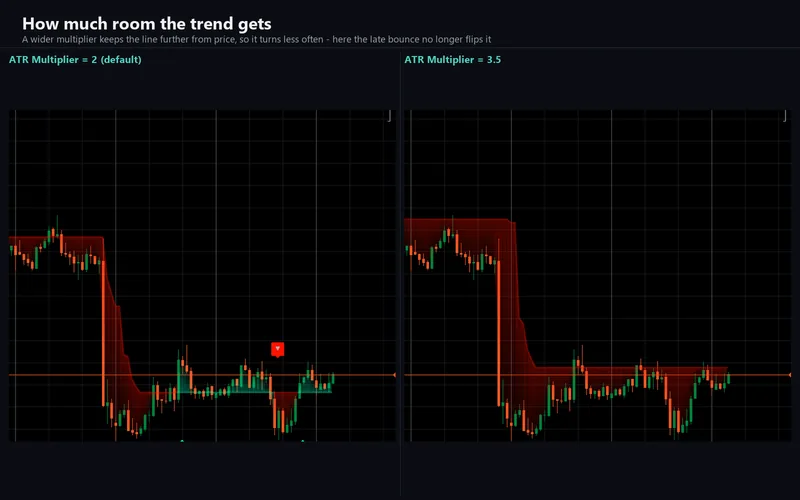
Alpha Pointer draws one line that only moves with the trend. Each bar it takes the average true range and sets a level under the bar or over it; the Commodity Channel Index decides which. While the CCI is at or above zero the line follows price upward and never falls, and while it is below zero the line follows price down and never rises. Between the line and the middle of each candle sits a gradient band, faint at the candle and stronger at the line. When price crosses the line and the direction turns, a pointer is placed at the lowest low or the highest high of the last 21 bars, which is where the move began.
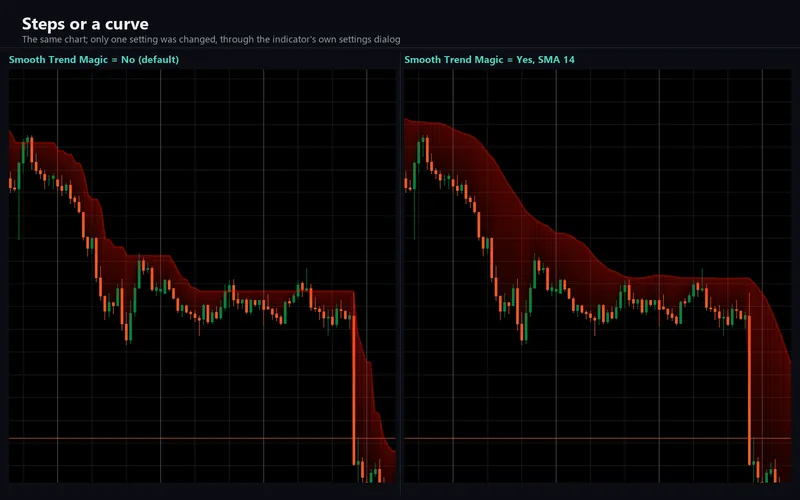
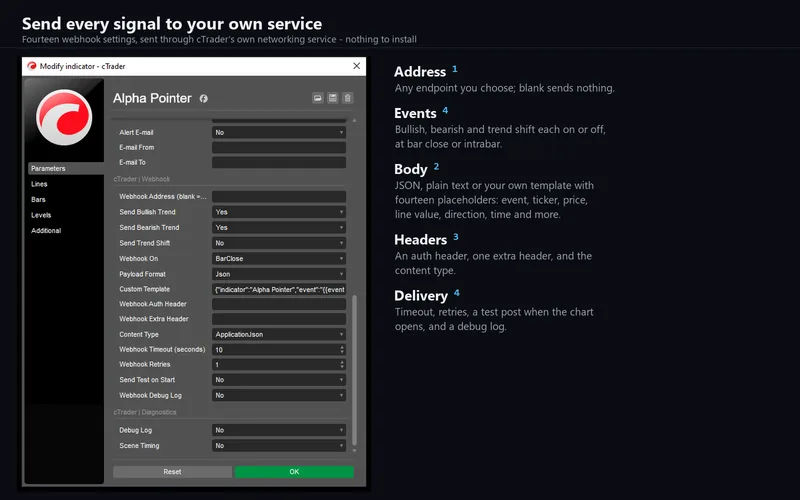
The optional smoothing runs the line through an SMA, EMA, SMMA, WMA or volume-weighted average, and the smoothed value is what the next bar ratchets against - so smoothing changes the logic, not only the look. Three alert events (a turn up, a turn down, any change) go to the log, a sound or an e-mail, and to a webhook that posts JSON, plain text or a template of your own with fourteen placeholders. It is free on the cTrader Store, with nothing held back.
Read literally, the way it was written
Two details of the original surprise people, and the port keeps both. On a fresh chart the line has no previous value, and the script reads a missing previous value as zero - so while the CCI starts out negative, the line sits at zero and is drawn there, far below the candles, until momentum first turns positive. And the crossunder that turns the trend down only runs on bars where the crossover did not fire, which TradingView's compiler warns about: that call keeps its own history of the bars it ran on, not of every bar. On real data the two readings never differed across 343,233 bars, so a hand-made fixture with a price gap was built to tell them apart, and the engine is pinned to the per-execution reading by a self-test.
How the port was verified
The engine is platform-free C#: it references no cTrader type, so the code that ships can be compiled outside the platform and replayed against a bar series. Probes were derived from the original mechanically, plotting every internal series to the data window, and each probe and its bars were read in one evaluate.
8,278,600 cell comparisons over 21 runs on identical bars - ICMARKETS EURUSD M5, M15 and H1, XAUUSD M5 and sixteen input sweeps - with zero mismatches in the indicator's own output. The one residue is the CCI itself: TradingView's accumulator is not reproducible to the last bit (the largest difference is about 1e-7), and where the CCI sits that close to zero the sign can land on the other side. With every input at its default that changes nothing - on each flip bar the price sat inside the band, so both branches returned the same line. With a short CCI period, a wide multiplier or smoothing on, a flip can move the line for a while; every such run starts at a flip, ends, and is declared with its length. No direction, pointer or alert differs in any run.
And the pixels. The band, the line and the pointers are drawn by a rasteriser in the engine, so the same code could be fed TradingView's own chart geometry and compared with TradingView's own screenshots. On three captures - EURUSD H1, EURUSD M15 and XAUUSD - 98.1 to 99.1% of the band's pixels and 98.7 to 98.8% of the pointers' land within two colour units of TradingView's. The line is a 3-pixel anti-aliased stroke, and 79 to 84% of its pixels are within two units; the rest sit on its blended edge.
What the comparison found
A gradient that steps per bar. TradingView's six-argument gradient fill looks smooth, but measured pixel by pixel it is a separate vertical gradient for every bar, from the candle's midpoint at 90% transparency to the line at 70%, interpolated with straight alpha, with straight edges between bar centres. cTrader has no gradient brush, so the whole drawing is rendered as one bitmap on an image control and redrawn on every zoom, scroll and tick.
A pointer 25 by 31 pixels. The label shapes were measured on their own: the plate's column is rounded, the glyph's is floored, the body snaps five pixels clear of the anchor, and the tail is a triangle back to the exact price. The plate templates were extracted from captures and ship in the engine.
A glyph colour that follows the chart. The triangle on each pointer is drawn in the chart's foreground colour. On cTrader that is the chart's own foreground setting, read again whenever the colours change.
A webhook retry that never retried. On a live chart, a test endpoint answering HTTP 500 came back from cTrader's networking service flagged as OK - the flag describes the transport, not the server's answer. The retry had been keyed on it, so it never fired for the case a retry is for. It now checks for a 2xx status, and a refused post is retried and logged.
Two captures sharing one file. Late in the release gate the mutation test refused to start: the unmutated engine showed eight mismatches on EURUSD M5. The engine was right. A second probe generation had rewritten the bars file the first generation was replayed against, and the bar that had been forming during the first capture had since closed with other prices. Each generation now keeps its own bars, and the differ refuses a probe and bars that come from different captures.
The things that are deliberately different
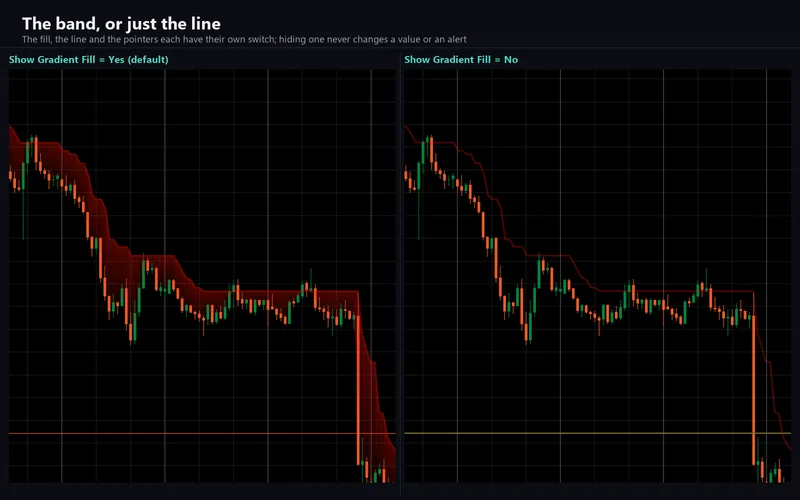
The original's three alert conditions become a cTrader group with a switch per event, bar close or intrabar, and log, sound and e-mail delivery, plus the webhook, which the original does not have. The band, the line and the pointers each have a display switch that hides the drawing only. The line and the direction are exposed as outputs, so a cBot can read them.
cTrader scales the price axis to the candles, and a pointer at a 21-bar low can sit just below them, where the time axis clips it; drag the axis and it is there. On a live chart the line follows your broker's candles, and the VWMA option weighs by the broker's tick volume - the parity above was run on TradingView's own bars and volume, because two different feeds cannot otherwise be compared at all.
Requirements
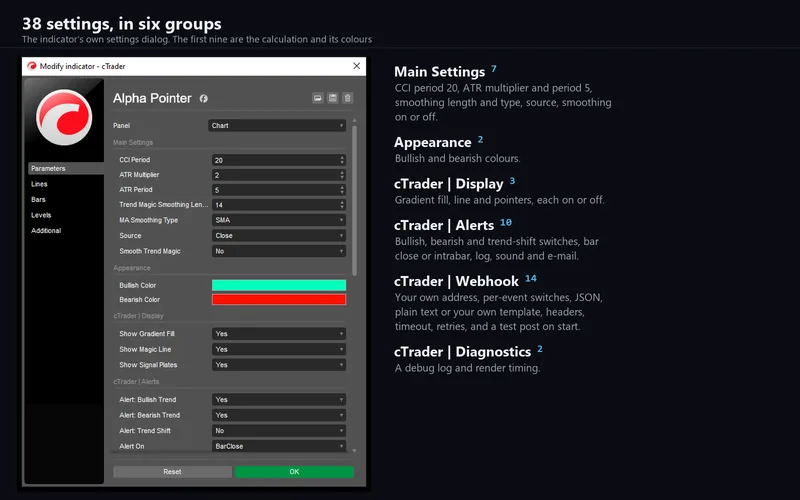
cTrader Desktop 5.x. It declares no access rights at all; the webhook posts through cTrader's own networking service, which is why it needs none. Thirty-eight parameters: the nine of the original with the same titles, defaults, options and tooltips, plus twenty-nine cTrader-only ones for display, the alert channels, the webhook and diagnostics.
Support
Through the Discussion tab of the Store listing, so the conversation stays next to the product. Please include your broker, symbol, timeframe, cTrader version and a screenshot of the whole chart.
This is analytical software, not investment advice. It never places, modifies or closes an order, and it is built with no trading permissions at all. Trading involves risk. Past performance does not guarantee future results.