The Trading Strategy series

Popular trading strategies, each tested on 100 trades

One rule-based strategy per video, taught step by step and run on real charts of EUR/USD, Bitcoin and gold. Each one comes with a free open-source TradingView script that marks the setups and keeps a log of the last 100 signals, losses included. Newest first.

Newest first

All strategies

Each card is one video: the strategy, its free script, and the script's own log of the last 100 signals per market.

Video 15 · 5-minute, 15-minute and 1-hour charts

The Range Filter: 5 minutes vs 1 hour

The popular Range Filter Buy and Sell signals (100 / 3.0) in TradingView's own Strategy Tester, booked three ways on the same signals, plus a test of the best settings on a month they were never tuned on.

17 August to 15 October 2026, after commission:

A: always in, every flip reverses (5 min)−161.1 R 552 of 1595 won
B: stop on the band, 1.5R target (5 min)−122.7 R 405 of 1003 won
C: B + the 200 EMA side (1 hour)+22.3 R 34 of 60 won

On 5 minutes 513 of the 1,595 signals were fast flips (a new signal within 12 candles). The 200 EMA rule was picked on the first month only and made +19.8 R on the hour chart in the second; on 5 minutes it lost 45.4 R there.

Recorded 15 October 2026. Closed candles; inside a candle the price runs open, nearer extreme, other extreme, as TradingView's broker emulator does. After commission (0.01 % per order). Past results, not a forecast.


Video 14 · 1-hour chart

Heikin Ashi: the backtest vs real prices

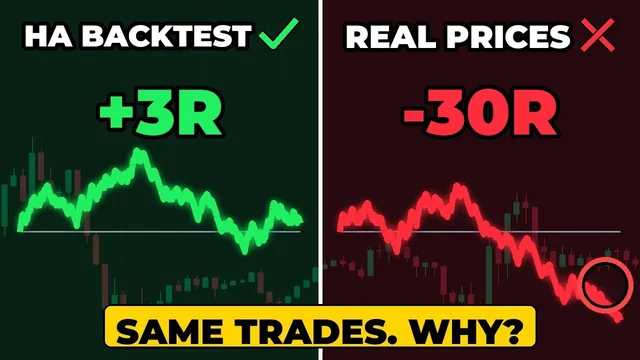
One Heikin Ashi strategy (50 EMA side, red pullback, green close, 1.5R target) in TradingView's own Strategy Tester: at Heikin Ashi prices, at real prices with one setting, and with the two-chart fix, on the same signals.

The same 310 signals, 5 September to 14 October 2026, booked three ways:

A: Heikin Ashi fills (the default on a Heikin Ashi chart)+236.5 R 215 of 301 won
B: real fills (Heikin Ashi mode: Standard bars)+9.4 R 146 of 301 won
C: the two-chart fix−2.1 R 67 of 169 won

Commission included, the backtest's +115.5 R becomes -111.6 R at real prices; on gold, +44 percent becomes -15 percent. 270 of the Heikin Ashi trades were over inside one candle, and 87 targets had already been passed at the real open.

Recorded 15 October 2026. Closed candles; inside a candle the price runs open, nearer extreme, other extreme, as TradingView's broker emulator does. Results before costs unless marked after commission. Past results, not a forecast.

Video 12 · 5-minute to 1-hour charts

QQE MOD: the "100% profitable" SuperTrend + QQE MOD + Trend Indicator A-V2 strategy

The most-copied QQE MOD strategy (SuperTrend up, a blue QQE MOD bar and a green Trend Indicator A-V2 cloud) traded six ways on Bitcoin, the Nasdaq and EUR/USD: exactly as filmed with the 2021 indicator versions, with the versions you can add today, with break-even at 1R, with a SuperTrend exit, QQE MOD alone, and QQE MOD with SSL Hybrid and the 200 EMA.

The script’s log of the last 100 trades per version on each chart:

As filmed (2021 indicators)−12 R 396 of 1200 won
Today's indicator versions+84 R 428 of 1200 won
Break-even at 1R−12 R 303 of 1200 won
SuperTrend exit+25.6 R 304 of 1200 won
QQE MOD alone−33 R 389 of 1200 won
QQE MOD + SSL Hybrid + 200 EMA−12 R 396 of 1200 won

Two of the three indicators were rewritten after the video that called it 100% profitable: with today's versions the same rules went from -12 R to +84 R and changed sides on 6 of the 12 charts. No version won more than 35.7 % of its trades.

Recorded 9 October 2026. Closed candles, stop counted first, no spread or commission. Past results, not a forecast.
Video 11 · 5-minute to 1-hour charts

UT Bot Alerts: four setups and the Heikin Ashi box

QuantNomad's UT Bot Alerts traded four ways (the default settings, the two-bot "best settings", the UT Bot + STC setup sold as "99% accurate" and UT Bot + Linear Regression Candles) on Bitcoin, the Nasdaq and EUR/USD, each run on real candles and with Signals from Heikin Ashi Candles switched on.

The script’s log of the last 100 trades per setup on each chart:

Default settings (1 / 10)+17.2 R 417 of 1200 won
Default + Heikin Ashi box+111.3 R 425 of 1200 won
"Best settings", two UT Bots+18 R 406 of 1200 won
"99%" UT Bot + STC−20 R 472 of 1200 won
UT Bot + LinReg Candles+9.3 R 456 of 1200 won

The Heikin Ashi box improved the default UT Bot on 9 of the 12 charts. The "99%" setup won 39.3 % of its trades; its 1.5R target needs 40 % to break even.

Recorded 8 October 2026. Closed candles, stop counted first, no spread or commission. Past results, not a forecast.
Video 10 · 5-minute to 1-hour charts

Squeeze Momentum: three rules and the typo

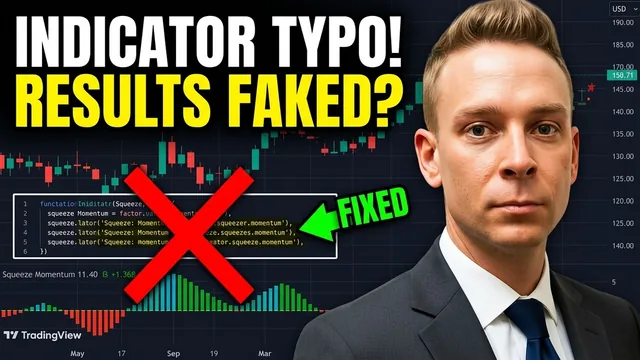
LazyBear's Squeeze Momentum Indicator traded three ways (the creator's rule, the classic bright-bar rule and an improved rule with a long squeeze and the 200 SMA) on Bitcoin, gold and EUR/USD, each run on the code TradingView shows and on the code with LazyBear's 2014 typo fixed.

The script’s log of the last 100 trades per rule on each chart, the code TradingView shows:

Rule A, the creator's+10.7 R 451 of 1200 won
Rule B, the classic−27 R 391 of 1200 won
Rule C, improved+3 R 401 of 1200 won
Rule C, 1-hour chart+51 R 117 of 300 won

Rule C on the 1-hour chart was positive on all three markets. Fixing the typo turned a profit into a loss, or a loss into a profit, in 20 of the 36 tests.

Recorded 7 October 2026. Closed candles, stop counted first, no spread or commission. Past results, not a forecast.

Video 9 · 5-minute chart

VWAP: four setups and the prop firm test

The first-touch bounce, the break and retest, the band reversion and the anchored VWAP traded side by side over the same days, split into calm and choppy sessions, with a prop firm style challenge run from every trade.

The script’s log on the Nasdaq, Bitcoin and gold, the same days for every setup:

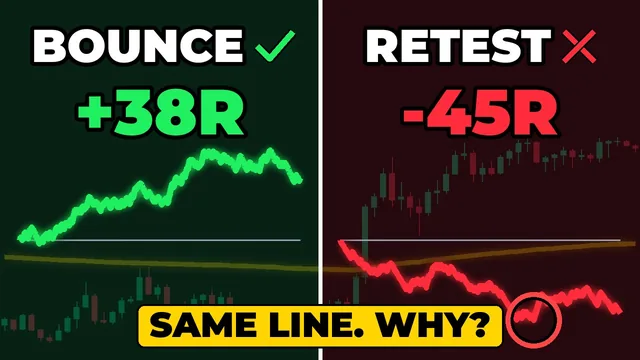
First-touch bounce+38.4 R 139 of 375 won
Break and retest−45.1 R 84 of 293 won
Band reversion−2.9 R 499 of 1498 won
Anchored VWAP+17.4 R 119 of 336 won

Only the bounce was positive on all three markets. Prop firm style challenge on its Nasdaq trades: 100 of 146 starting points passed, 11 failed.

Recorded 5 October 2026. Closed candles, stop counted first, no spread or commission. Past results, not a forecast.
Video 8 · 30-minute chart

Heikin Ashi, key levels and the exit trick

Key levels on the real price, Heikin Ashi to confirm the turn, three exits on the same 300 trades, and the same trades booked at Heikin Ashi prices to show how far that backtest drifts.

The script’s log, the same 300 trades on three markets:

Exit A: fixed 2R−30.1 R 90 of 300 won
Exit B: half at 2R + ride−6.6 R 90 of 300 won
Exit C: ride with Heikin Ashi−4.8 R 76 of 300 won
Exit A at Heikin Ashi prices+3 R 101 of 300 won

The last row books exit A at Heikin Ashi prices instead of real prices: 33.1 R that never existed.

Recorded 4 October 2026. Closed candles, stop counted first, no spread or commission. Past results, not a forecast.

Video 7 · 1-hour chart

The Supertrend and three ways to filter it

The plain Supertrend is always long or short, so it keeps flipping in a range. Three filters (the triple Supertrend, the 200 EMA, the Kumo cloud) tested against it on the same days.

The script’s log, all three markets, same days per version:

+ Kumo cloud+30.8 R 137 of 598 won
Triple Supertrend+26.2 R 309 of 864 won
+ 200 EMA+11.3 R 112 of 300 won
Plain Supertrend−4.1 R 134 of 381 won

Four versions over the same days per market: 2,143 trades on EUR/USD, BTC/USDT and XAU/USD.

Recorded 3 October 2026. Closed candles, stop counted first, no spread or commission. Past results, not a forecast.

Video 6 · 30-minute chart

RSI hidden divergence

Price makes a higher low while the RSI makes a lower low: the trend may continue. The 200 EMA picks the side, two horizontal lines spot the divergence in real time, and a Stochastic cross confirms the entry.

The script’s log, last 100 signals per market:

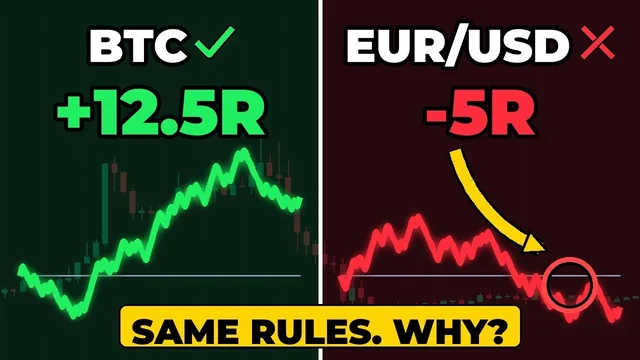
EUR/USD−5 R 38 of 100 won
BTC/USDT+12.5 R 45 of 100 won
XAU/USD−2.5 R 39 of 100 won

Recorded 3 October 2026. Closed candles, stop counted first, no spread or commission. Past results, not a forecast.

Video 5 · 30-minute chart

The Bollinger Bands squeeze

Bands squeezed together in a flat market, then a close outside a band as they open, confirmed by the Money Flow Index. The trade runs until a candle closes back through the middle line.

The script’s log, last 100 signals per market:

EUR/USD+14.5 R 30 of 100 won
BTC/USDT+13.9 R 33 of 100 won
XAU/USD−17.9 R 32 of 100 won

Recorded 2 October 2026. Closed candles, stop counted first, no spread or commission. Past results, not a forecast.

Video 4 · 30-minute chart

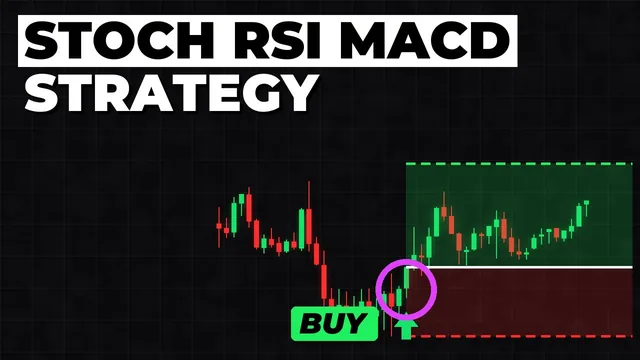
Stochastic + RSI + MACD

Three oscillators, one job each: the Stochastic finds the setup, the RSI decides the side, the MACD confirms the momentum. A trade is taken only when all three agree.

The script’s log, last 100 signals per market:

EUR/USD−5 R 38 of 100 won
BTC/USDT+15 R 46 of 100 won
XAU/USD+2.5 R 41 of 100 won

Recorded 2 October 2026. Closed candles, stop counted first, no spread or commission. Past results, not a forecast.

Video 3 · 1-hour chart

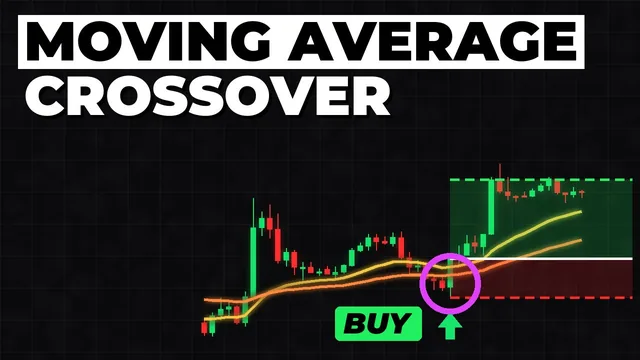
The 20/50 EMA crossover, on the first pullback

Two moving averages only, the 1-hour chart, and the entry on the first pullback after the cross instead of at the cross itself.

The script’s log, last 100 signals per market:

EUR/USD−1 R 33 of 100 won
BTC/USDT+11 R 37 of 100 won
XAU/USD+11 R 37 of 100 won

Recorded 1 October 2026. Closed candles, stop counted first, no spread or commission. Past results, not a forecast.

Video 2 · 30-minute chart

MACD + Parabolic SAR + 200 EMA

Three indicators, one job each: the 200 EMA gives the side, the MACD the momentum, and the Parabolic SAR confirms the move and gives the stop. A trade is taken only when all three agree.

The script’s log, last 100 signals per market:

EUR/USD0 R 50 of 100 won
BTC/USDT+4 R 52 of 100 won
XAU/USD−10 R 45 of 100 won

Recorded 30 September 2026. Closed candles, stop counted first, no spread or commission. Past results, not a forecast.

Video 1 · 5-minute chart

4-hour range scalping

The first 4-hour candle of the New York day gives the range. A breakout that fails and closes back inside the range is the trade, taken against the breakout.

The script’s log, last 100 signals per market:

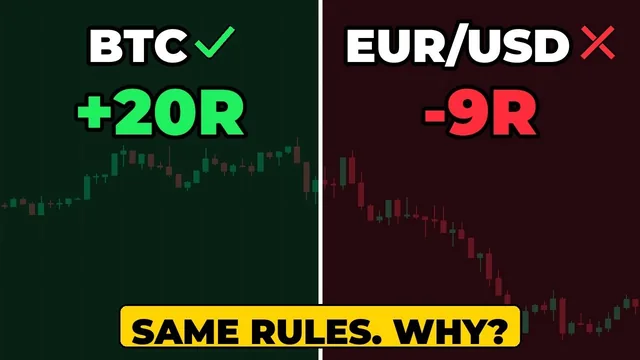
BTC/USDT+20 R 40 of 100 won

The 100-signal log was run on BTC/USDT; the video also walks three days on EUR/USD and gold.

Recorded 29 September 2026. Closed candles, stop counted first, no spread or commission. Past results, not a forecast.

The Strategy Sheets PDF: one page per strategy

The rules, the script's settings, a checklist before every trade and the full trade log of each video, on one page per strategy. The PDF grows with every video and the same link keeps working.

How these numbers are measured

Each log counts the last 100 signals the script found on one market and timeframe, on closed candles only. A trade that touched its stop and its target on the same candle is counted as a loss. Spread, commission and slippage are not included, so a real account would do somewhat worse.

These are historical results of one set of settings on one timeframe. They describe what price already did and are not a prediction. Test a strategy on your own market before you rely on it.