Apex Break PRO for cTrader: the original, ported and verified bar by bar
Sloped trendlines drawn from consecutive pivots, a breakout confirmed only on a closed bar and scored against four independent filters, an ATR stop with three targets and their risk and reward zones, a live dashboard and nine alerts. The cTrader edition is a C# transcription of the original that was checked series by series on the same bars.
cTrader 5.x · C# on the cAlgo API · 65 parameters: the 46 inputs of the original plus 19 cTrader-only · sold on the cTrader Store, EURUSD trial
EURUSD M5, IC Markets feed, June to September 2026; measured with the parity harness described below, plus two filter-combination sweeps
The Apex Break PRO gallery, picture by picture
The 11 pictures of the cTrader Store gallery. Select any picture to open it full size.
What it does
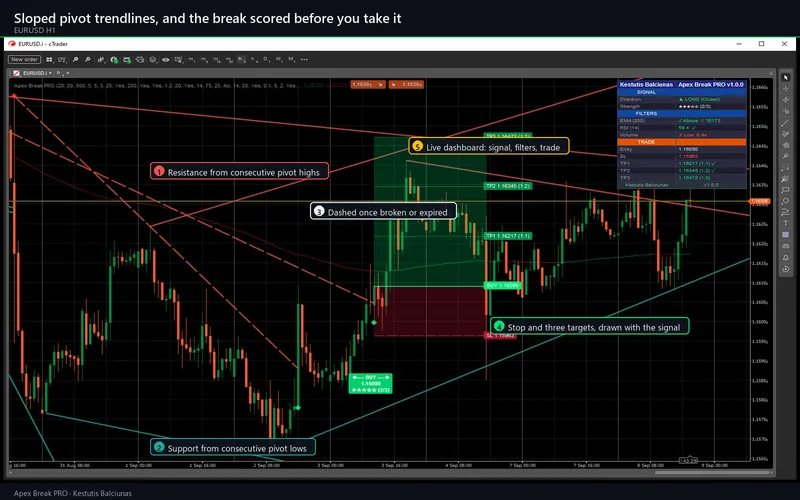
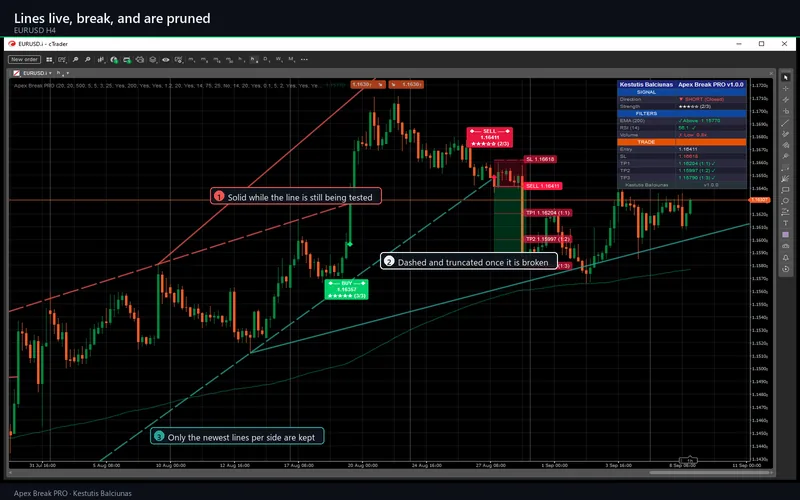
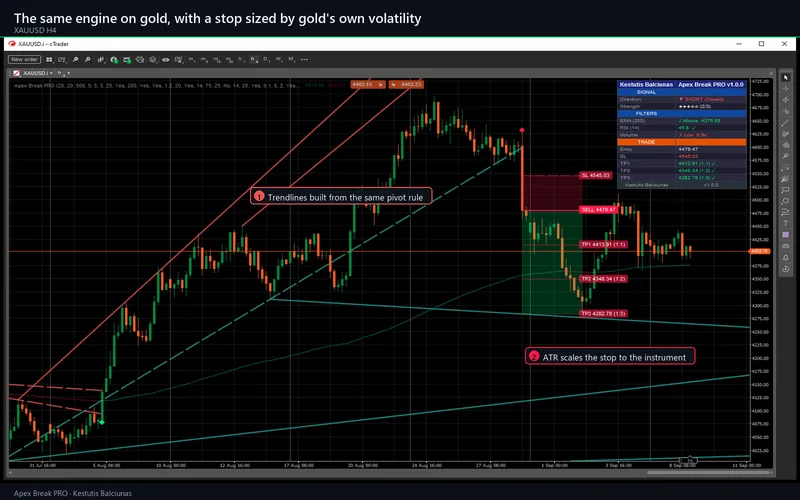
Apex Break PRO is a breakout indicator built on sloped trendlines rather than horizontal levels. It connects consecutive pivot highs into a resistance line and consecutive pivot lows into a support line, so the lines follow the market's own direction. Each line is drawn from the previous pivot through the new one and projected forward, up to 500 bars by default, and it stops being tested when it is broken or when it runs out that extension.
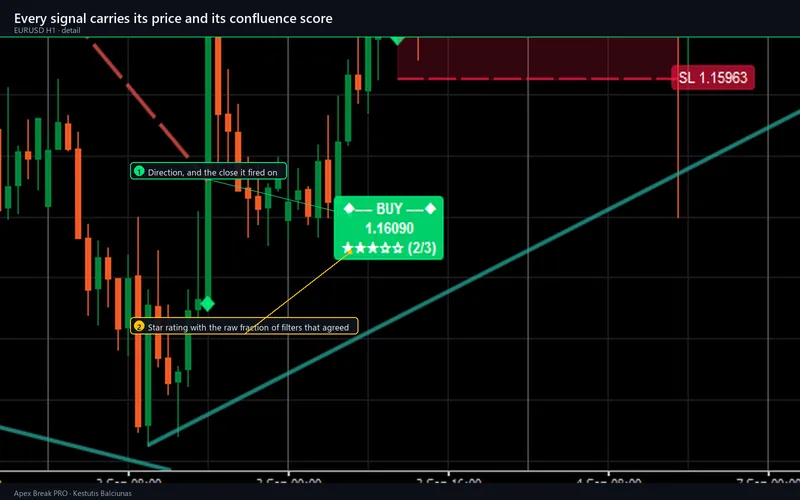
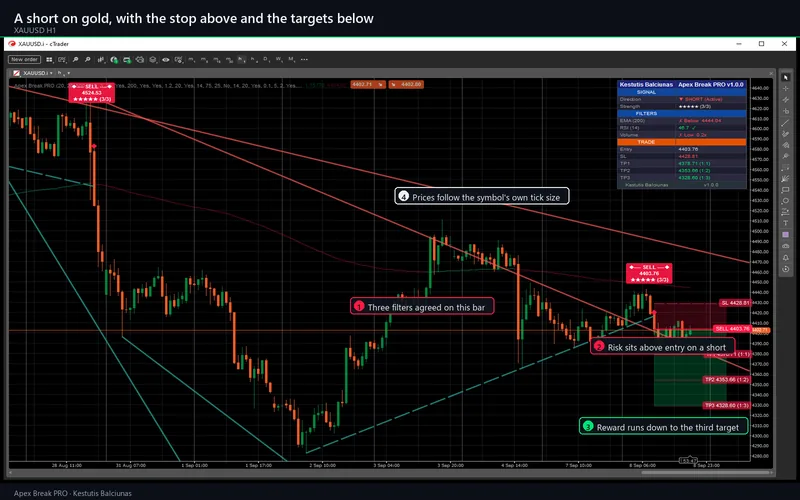
A signal appears when the close of a confirmed bar clears one of those lines by a margin measured in ATR, and only when enough independent filters agree. Four filters score the break: which side of the 200 EMA price is on, whether RSI is inside its boundaries, whether volume beat its own average, and whether ADX is above its threshold. Volume and ADX count for both directions; the EMA and RSI checks are directional. The score is shown as a five-star rating and as the raw fraction, for example 3 of 4.
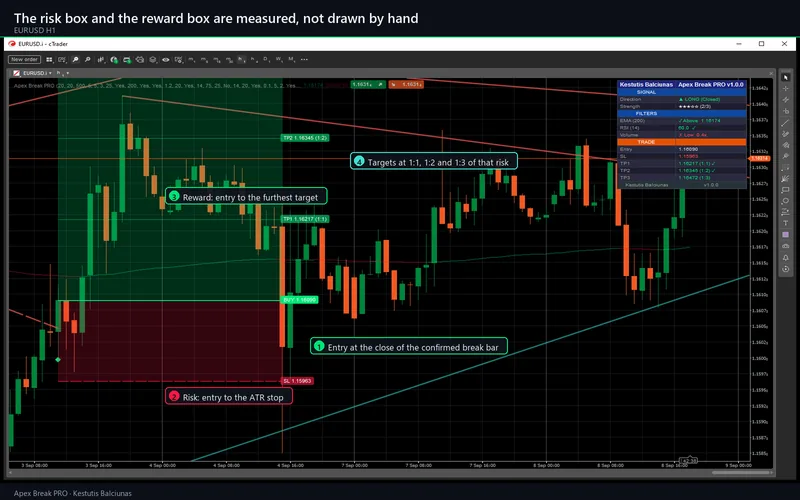
With the signal the indicator draws an entry at that close, a stop at 1.5 times ATR by default, and three targets at 1:1, 1:2 and 1:3 of that stop distance, with a shaded risk zone and a shaded reward zone. One trade is tracked at a time; each target is marked as price reaches it, and tracking stops at the stop or the third target.
Non-repainting, and what that costs
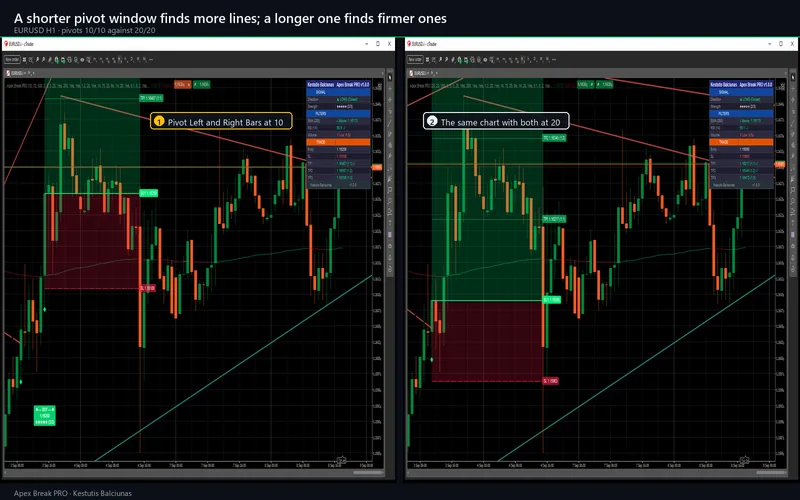
A pivot is only confirmed once the configured number of bars has formed to its right, and the breakout itself is evaluated on a closed bar. Once a marker prints, it does not move, and neither do its stop and targets. The price of that is the confirmation lag: with the default window of 20 bars, a pivot is recognised 20 bars after it happened.
The trendlines themselves are provisional on the bar still forming, because the newest bar in a pivot's right-hand window is the one currently forming and a new extreme can invalidate it. That is exactly how the original behaves, on both platforms.
The dashboard
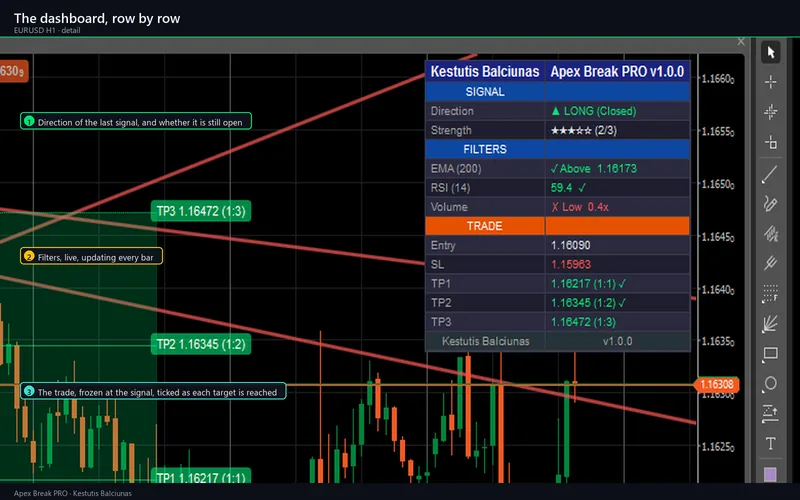
A two-column table in the corner of your choice, in six positions. A SIGNAL section with the direction of the last signal, whether it is still open, and its star rating with the raw fraction. A FILTERS section that updates every bar and shows each enabled filter passing or failing with its current value. A TRADE section with the entry, the stop and the three targets, each ticked as price reaches it. Rows for a disabled filter are simply absent, so the table is 15 rows with the three default filters and 16 with ADX enabled.
Alerts
Nine events, each behind its own toggle: buy, sell, either, a raw resistance break and a raw support break before filtering, the three target hits and the stop. Each fires once per closed bar, only for bars that close after you attach the indicator, never for history. The bodies are the same text as the original, or the same JSON. Channels are the cTrader log, a sound of your choice and email through cTrader's own settings. Nothing is sent anywhere by the indicator itself: it declares no access rights and makes no network call. A hidden signal output (+1, -1) lets a cBot consume the signals, alongside read-only properties for the trade state.
Parameters
| Group | Inputs | Notes |
|---|---|---|
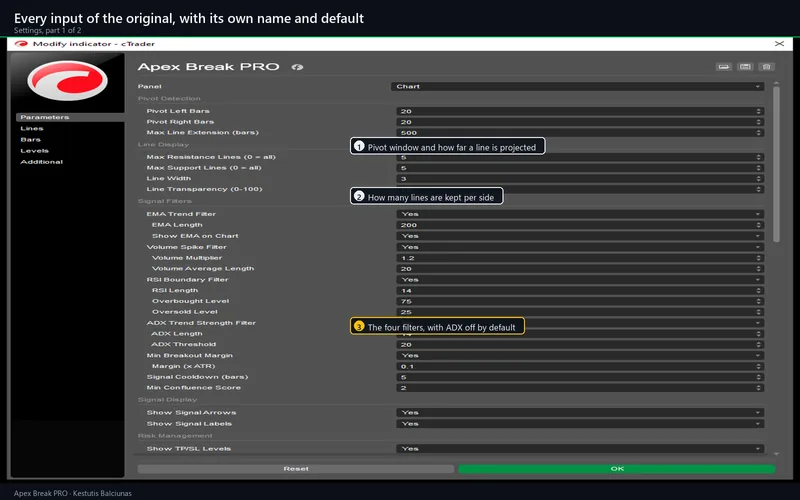
| Pivot Detection | 3 | Left and right bars for a pivot, and how far a line is projected |
| Line Display | 4 | How many lines are kept per side, line width and transparency |
| Signal Filters | 17 | EMA, volume, RSI and ADX filters with their windows and levels, the ATR breakout margin, the cooldown and the minimum score |
| Signal Display | 2 | Arrows and labels on or off |
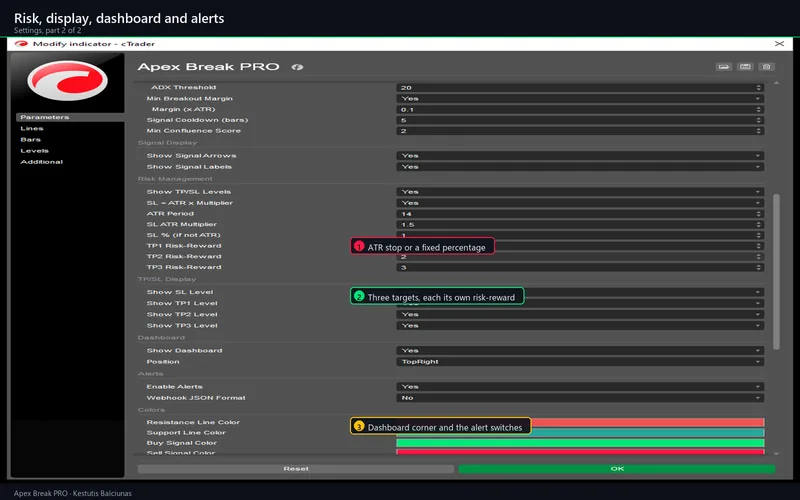
| Risk Management | 8 | Levels on or off, ATR stop or a fixed percentage, ATR period, and the three risk-reward ratios |
| TP/SL Display | 4 | Each level shown or hidden |
| Dashboard, Alerts, Colors | 8 | Dashboard on or off and its position, alerts on or off, JSON format, and the four line and signal colours |
| cTrader | 19 | One toggle per alert event, sound and email delivery, marker style, object caps, draw-ahead and a debug log |
65 parameters in total. The 46 inputs of the original keep their titles, groups, order and defaults; the 19 cTrader-only ones cover the alert events that the original leaves to its platform's alert dialog, the delivery channels, and four platform settings. The full table with every default ships with the product.
Requirements and installation
cTrader 5.0 or newer, desktop, tested on 5.9. Buy or try on the Store listing, press Install, then add Apex Break PRO from the indicator list. With the default settings it needs about 250 bars of history before it draws anything, because the 200 EMA has to seed and a pivot is confirmed 20 bars after it forms. On a short chart you will correctly see nothing until you scroll back.
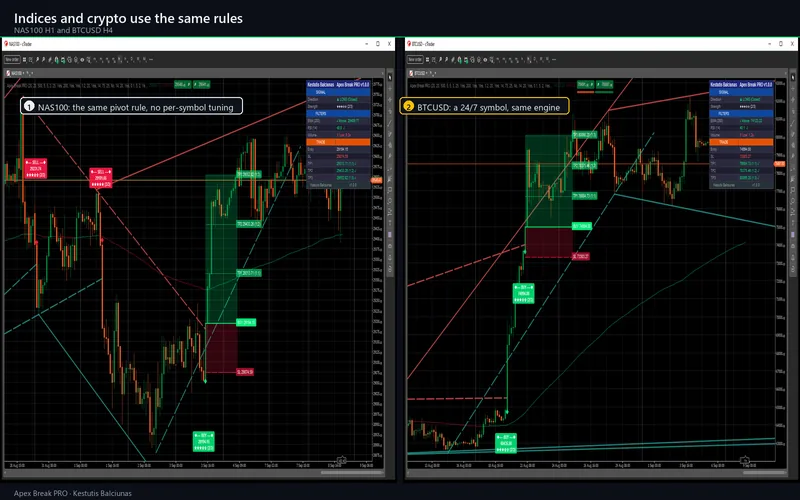
It runs on any symbol and any timeframe. M15, H1 and H4 are the window it was designed around. The volume filter is only meaningful where your broker supplies volume; switch it off elsewhere rather than leave it failing.
The trial
The trial edition is the same build with one restriction: it runs on EURUSD only, and broker suffixes such as EURUSD.i are accepted. On any other symbol it draws a notice instead. There is no time limit and every parameter is available.
How the port was verified
The bars were read straight out of the TradingView chart model, 20,561 EURUSD five-minute candles from June to September 2026, and replayed through the same engine that ships inside the .algo. On the TradingView side, three probe copies of the script exposed its internals to the data window at ten decimals: the indicator legs, the pivots and their anchors, the breakout flags, the confluence counters, the signal and cooldown state, the whole stop-and-target state machine, and for each of the ten trendlines its start bar, start price, projected endpoint, detection bar and active flag on every bar of its life.
The result is zero. All 46 scalar series match. Both trendline collections match across 1,439,270 field comparisons. 211 resistance breaks, 199 support breaks, 142 buy signals and 132 sell signals fall on exactly the same bars on both sides. Against what the script actually draws: all ten trendlines match including whether each is solid or dashed, the entry, stop and three target lines match in price, width and style, 275 signal labels match in text and anchor price, and 13 of the 15 dashboard rows are identical strings. Two filter-combination sweeps repeat the whole exercise with zero mismatches.
Four behaviours of the original were measured rather than assumed, and all four turned out to match the implementation: a 1e-10 tolerance in its float comparisons, the asymmetric tie rule of its pivot functions, how it derives a line's price beyond the drawn segment, and one number format whose leading-zero rule was not documented anywhere.
What differs on purpose: the author name in the dashboard header and footer, and the broker's symbol name, since cTrader prints EURUSD.i where the original prints EURUSD. The alert channels are cTrader's. Two rendering differences are documented rather than hidden: the level lines and the risk and reward zones are re-extended to the right edge each bar instead of running to the edge of the chart forever, and the EMA plot is two output series because a cTrader plot colour is fixed at compile time while the original flips it per bar.
Signals on a live chart will still differ from the same indicator on another broker's feed, because the candles differ. That is a data difference, not a difference in the calculation, and it is why the comparison above is a same-bar replay rather than two screenshots.
Support
Questions about the product go through the Discussion tab of the Store listing or the contact page. Refunds are the Store's 14-day money-back. Updates are free for buyers and are announced in the listing's version history.
Chart captures are from the cTrader build on a demo account. This is analytical software, not investment advice; it never places, modifies or closes an order, and the marks on the target rows record only that price later touched a drawn level on the loaded history, with no spread, commission or slippage. Trading involves risk. Past performance does not guarantee future results.