Break Tracer for cTrader: the original, ported and verified bar by bar
Two layers that have to agree before anything happens: a fast pair of EMAs for the short-term direction, and a 200-bar trend average with an ATR channel around it for the trend. When both point the same way a Long or Short plate goes on the chart; when they stop agreeing, a Close cross marks the exit. The cTrader edition is a C# transcription checked against the original on the same bars, value by value and pixel by pixel - including its higher-timeframe mode, replayed from TradingView's own higher-timeframe bars.
cTrader 5.x · C# on the cAlgo API · 55 parameters: the 18 of the original plus 37 cTrader-only · AccessRights = None, webhook included · free on the cTrader Store
ICMARKETS EURUSD M5 with probe generations across EURUSD M5, M15 and H1 and XAUUSD M5, and twenty-four input sweeps covering both strategies, long-only and short-only, every source, the stop loss, the channel, the date window, the Golden and Death Cross and four higher timeframes. Every internal series, every position event, every colour and every mark compared on identical bars, at zero in the indicator's own output; the one residue is the last bits of TradingView's simple moving average, declared and never large enough to change a decision. Then the drawing itself, compared with TradingView's own screenshots. Zero was the acceptance bar, set before any C# was written.
The Break Tracer gallery, picture by picture
The 10 pictures of the cTrader Store gallery. Select any picture to open it full size.

What it does
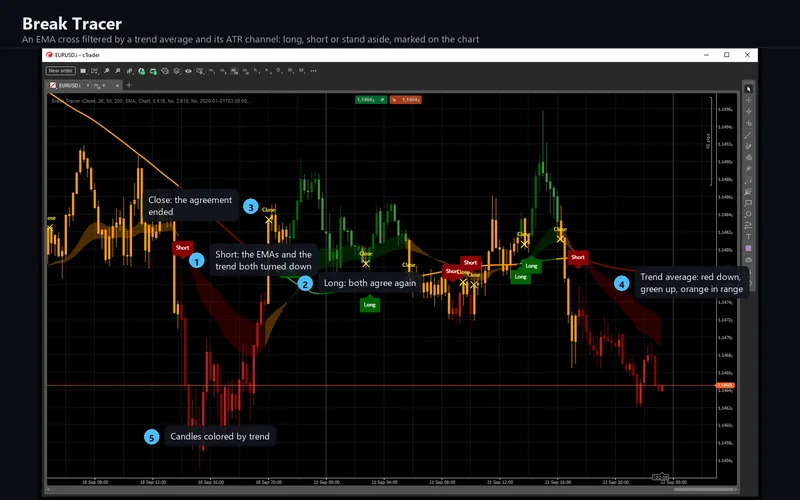
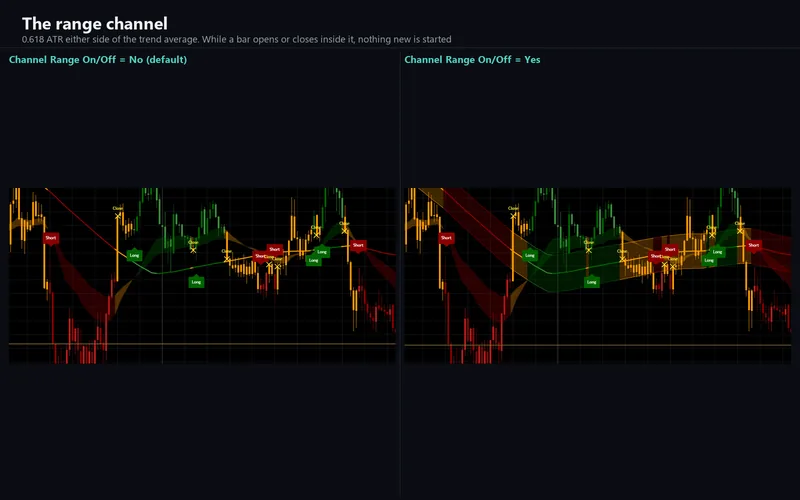
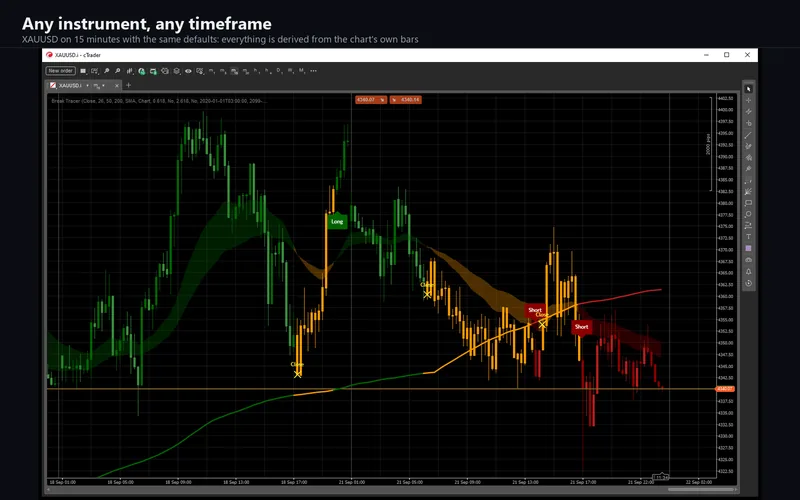
Break Tracer reads the trend in two layers and only acts when they agree. A fast pair of exponential moving averages, 26 and 50 bars, gives the short-term direction. A 200-bar trend average - simple or exponential, on the chart's own timeframe or a higher one - gives the trend, with a channel of 0.618 times the average true range around it. When the fast pair points up and price is above the trend average, the trend is up and a Long plate goes under the bar; when both point down, a Short plate goes over it. While a bar opens or closes inside the channel the market is treated as ranging, the trend line turns orange, and nothing new is started. When the two layers stop agreeing, a yellow Close cross marks the exit.
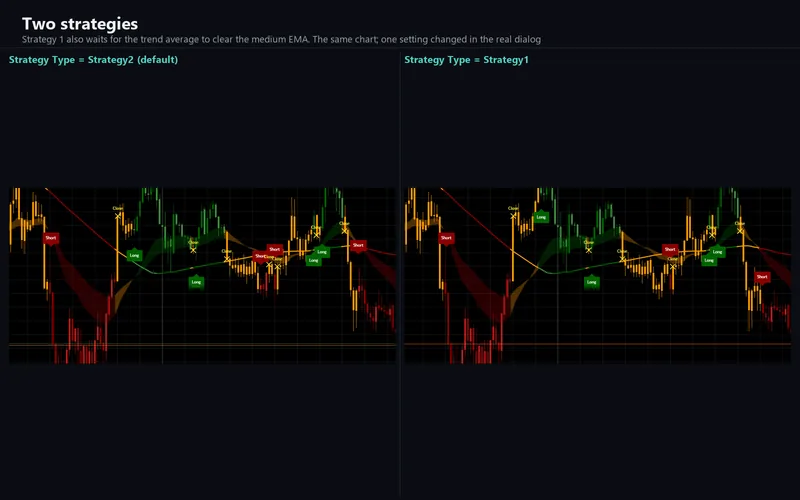
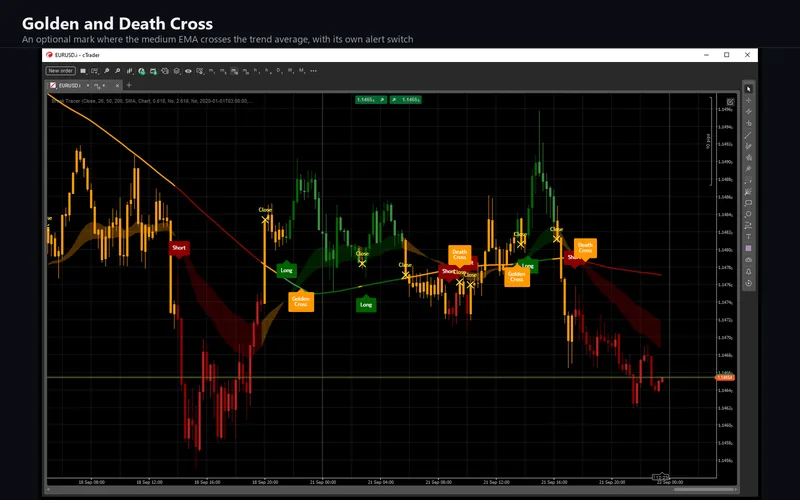
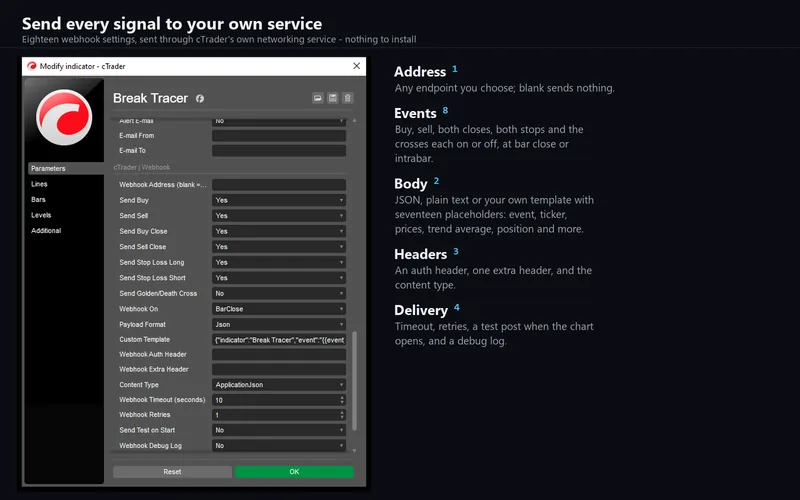
Two strategies decide how strict the agreement is: the second, the default, needs the fast pair and the trend; the first also waits for the trend average to clear the medium EMA. An optional percentage stop draws its own line while a position is open and an SL cross where it closed. Golden and Death Cross plates mark the medium EMA crossing the trend average, candles can be coloured by trend, and a date window can limit the whole thing to a period of your choosing. Six alert events, plus the crosses as an option, go to the log, a sound or an e-mail, and to a webhook that posts JSON, plain text or a template of your own with seventeen placeholders. It is free on the cTrader Store, with nothing held back.
Read literally, the way it was written
Three details of the original surprise people, and the port keeps all three. The position state is not a persistent variable: it restarts at zero on every bar and is then assigned, so "the previous bar's state" is always the value that bar finished with. Until the averages have enough history every comparison is false, which the script reads as a down-trend - so the first mark on every chart is a Short on the second bar. And with the stop loss off, the stop level is not a number, and every comparison against it quietly returns false; the port walks the same paths rather than skipping them, because the two readings only agree if the engine treats a missing value exactly as TradingView does.
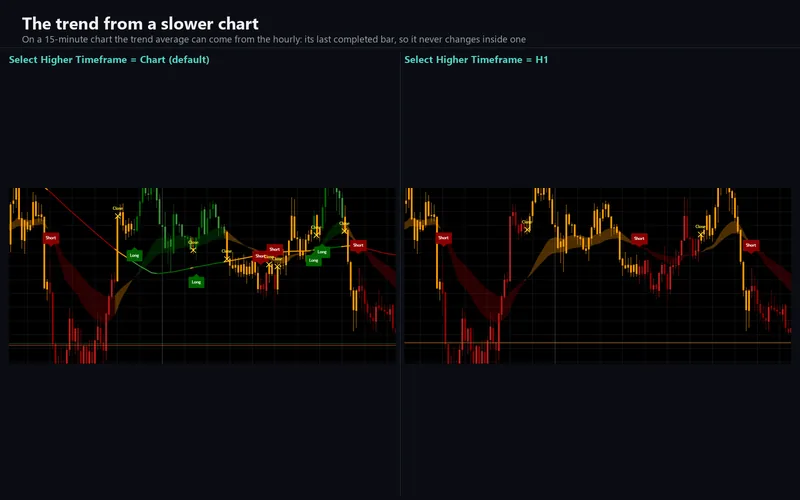
The higher-timeframe mode reads the previous completed bar of the higher timeframe, so the trend average never changes inside one. TradingView computes that average on higher-timeframe history that starts long before the chart's first bar - on the reference chart, 2,784 hourly bars earlier. Re-aggregating the chart's own bars would get the first months wrong, so the parity runs replay TradingView's own higher-timeframe bars, and the indicator asks cTrader for that history before it draws.
How the port was verified
The engine is platform-free C#: it references no cTrader type, so the code that ships can be compiled outside the platform and replayed against a bar series. Probes were derived from the original mechanically, plotting every internal series to the data window, and each probe and its bars were read in one evaluate.
33,746,912 cell comparisons over 38 runs on identical bars - ICMARKETS EURUSD M5, M15 and H1, XAUUSD M5 and twenty-four input sweeps, four of them on a higher timeframe - with zero mismatches in the indicator's own output. The one residue is TradingView's simple moving average: its running sum is not reproducible to the last bit by any closed form tried (eleven were fitted), so the trend average and the channel edges differ by at most 1.1e-11 in price. The script compares everything with a tolerance of 1e-10, so that drift can never change a direction, a mark, an alert or a colour, and none differs in any run. The differ counts those cells separately, as declared residue, never as agreement.
And the pixels. Everything except the candle colours is drawn by a rasteriser in the engine, so the same code could be fed TradingView's own chart geometry and compared with TradingView's own screenshots. Across ten pixel reports on EURUSD, XAUUSD, GBPUSD, AUDUSD and USDJPY, 98.6 to 100% of the fills' pixels and 96.3 to 98.2% of the plates' and crosses' land within two colour units of TradingView's; the lines match 85 to 100%, the rest sitting on their anti-aliased edges.
What the comparison found
Colours that are palette entries, not colours. TradingView stores a per-bar colour as an index into the study's palette of literal colours, not as the colour itself. Read as colours, the numbers made no sense; read against the study's own palette, every one of the trend line, band, channel, stop line and candle colours matched on every bar.
A band with seams. The shaded band between the two EMAs is a separate solid polygon for every bar. Drawn that way on cTrader it showed faint vertical seams where neighbouring polygons each covered half a pixel column. Covering the partial boundary column once per segment removed them, and the band now matches TradingView's pixels at 99.8%.
Plates measured, not guessed. The Long, Short and Golden/Death Cross plates are size-normal labels with text, and the crosses carry their text beside them. Their bodies were extracted from TradingView captures and checked on held-out captures of four more symbols; the pointer tail is drawn from the exact sub-pixel tip, the text sits on its own snapped template, and the three layers are painted in TradingView's order.
A date picker that shows local time. The date window's defaults are midnight at GMT-3, as the original writes them. cTrader has native date-and-time parameters, but its settings dialog shows them in the platform's own time zone, so the same instant reads 06:00 on a platform set to UTC+3. The value is exactly TradingView's; the parameter descriptions say how it is shown.
A webhook retry that never retried. A test endpoint answering HTTP 500 comes back from cTrader's networking service flagged as OK - the flag describes the transport, not the server's answer. The retry is keyed on a 2xx status instead, and a refused post was seen to be retried and its 200 logged on a live chart.
The things that are deliberately different
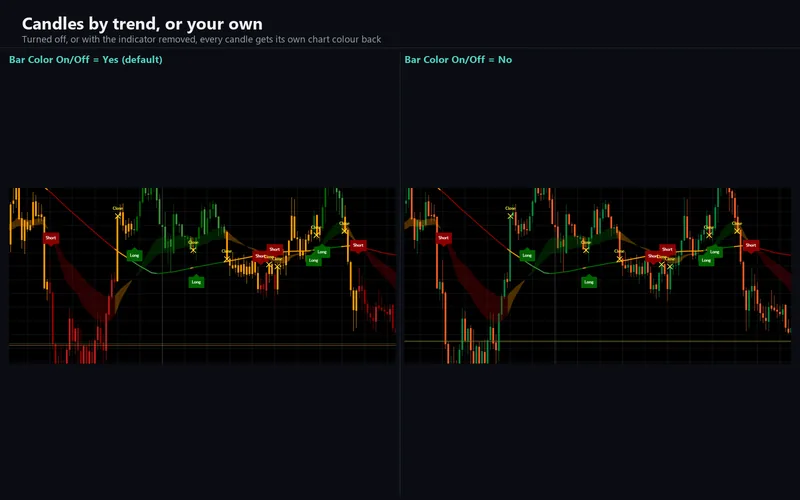
The original's seven alert conditions become a cTrader group with a switch per event, bar close or intrabar, and log, sound and e-mail delivery, plus the webhook, which the original does not have. The Golden and Death Cross can alert too, off by default. Select Higher Timeframe is a list of cTrader's own periods rather than a free text field. Candles are coloured through cTrader's own bar colours, so turning the option off or removing the indicator gives every candle its colour back.
The gray shading outside the date window is drawn over the candles rather than beneath them, because cTrader's drawing layer always sits above the chart's own candles; inside a shaded window the candles carry the gray's 10% tint. On a live chart the indicator follows your broker's candles and your broker's higher-timeframe bars - the parity above was run on TradingView's own bars, because two different feeds cannot otherwise be compared at all.
Requirements
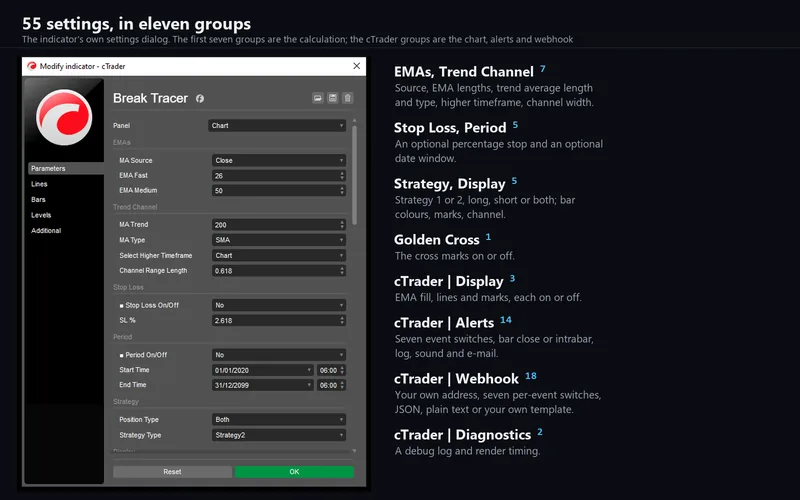
cTrader Desktop 5.x. It declares no access rights at all; the webhook posts through cTrader's own networking service, which is why it needs none. Fifty-five parameters: the eighteen of the original with the same titles, defaults, options and tooltips, plus thirty-seven cTrader-only ones for display, the alert channels, the webhook and diagnostics.
Support
Through the Discussion tab of the Store listing, so the conversation stays next to the product. Please include your broker, symbol, timeframe, cTrader version and a screenshot of the whole chart.
This is analytical software, not investment advice. It never places, modifies or closes an order, and it is built with no trading permissions at all. Trading involves risk. Past performance does not guarantee future results.