Corex Smart Bear Bull for cTrader: the original, ported and verified bar by bar
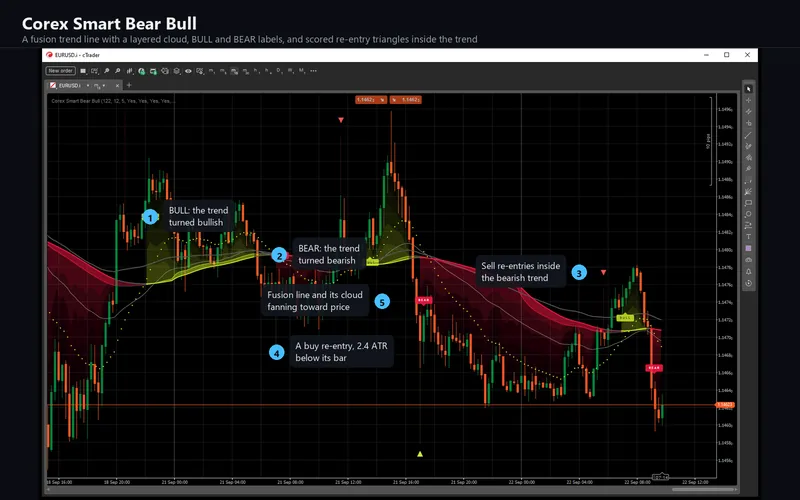
Two layers: a fusion line - five moving averages blended into one and smoothed twice, with a layered cloud toward price and a BULL or BEAR label on every change of trend - and, inside the trend, Williams %R re-entry triangles, scored for confidence and filtered by a trend gate, with an exit cross when the move is over. The cTrader edition is a C# transcription checked against the original on the same bars and volumes, value by value and pixel by pixel.
cTrader 5.x · C# on the cAlgo API · 78 parameters: the 42 of the original plus 36 cTrader-only · AccessRights = None, webhook included · free on the cTrader Store
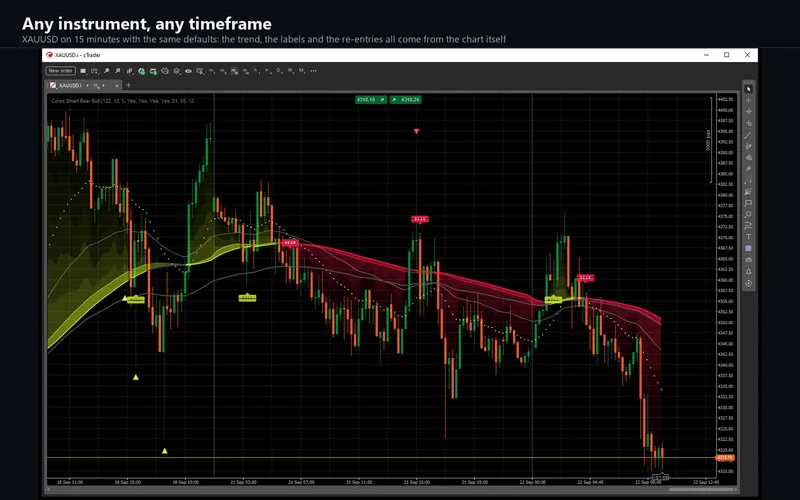
ICMARKETS EURUSD M5 with probe generations across EURUSD M5 and H1 and XAUUSD M5, and nineteen input sweeps covering the gate, strict mode and the recovery rule, the confidence minimum, the cooldown, the fusion length and sensitivities, the Williams %R periods and levels, the mark distance and size, the cloud, the EMAs, the date window and a second colour theme. Every internal series, every trigger, every score, every colour and every mark compared on identical bars, at zero in the indicator's own output; the two residues are the last bits of TradingView's simple moving average and of one exponential, declared and never large enough to change a decision. Then the drawing itself, compared with TradingView's own screenshots. Zero was the acceptance bar, set before any C# was written.
The Corex Smart Bear Bull gallery, picture by picture
The 10 pictures of the cTrader Store gallery. Select any picture to open it full size.





What it does
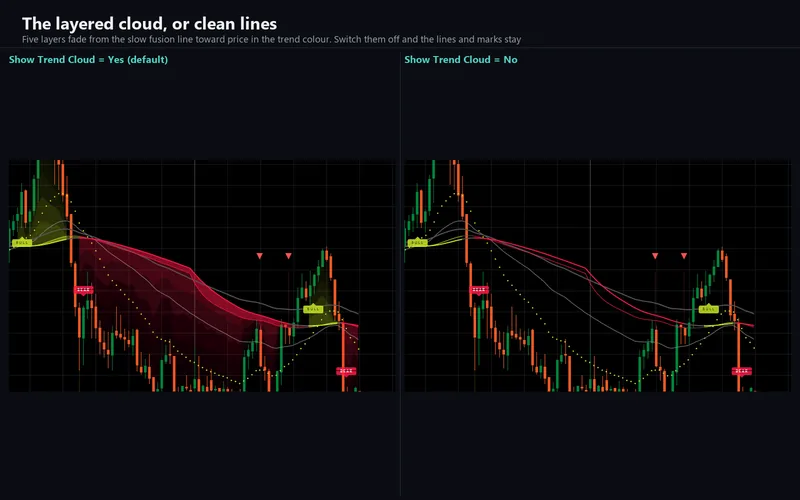
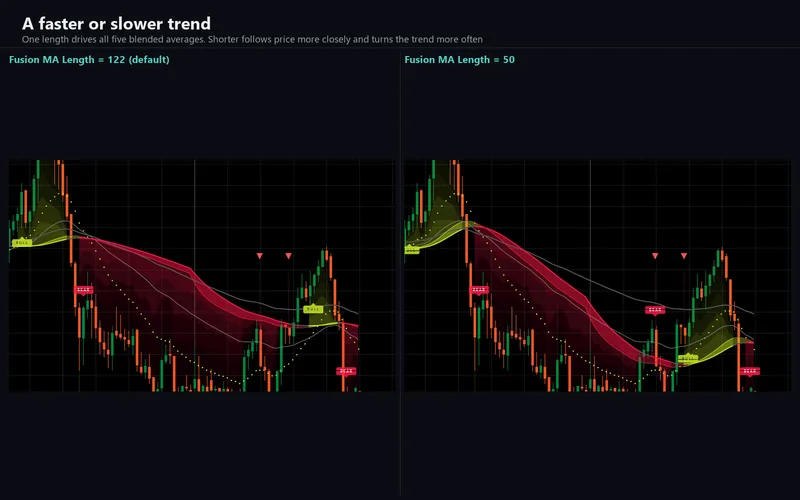
Corex Smart Bear Bull reads the trend in two layers. The first is a fusion line: five moving averages of the same length - exponential, simple, weighted, Arnaud Legoux and the VWAP of the trading day - blended into one and smoothed into a slow and a fast line. The market is bullish while price closes above a rising slow line and bearish while it closes below a falling one. The lines take the trend colour, a layered cloud fans out from the slow line toward price, and a BULL or BEAR label marks each change of trend.
The second layer works inside the trend. A Williams %R engine with three periods watches the fast line cross out of its oversold or overbought zone, recognises the kind of move, and scores it from 0 to 100 on the readings, the speed of the move, the trading session, the position against the 50 and 200 averages, RSI and volume. A trend gate holds counter-trend candidates back while the slower lines show a strong trend, unless the fast line has already recovered from an extreme. What passes becomes a lime triangle under the bar in a bullish trend or a red one over it in a bearish trend, joined to the bar by a dotted line, and the first opposite signal after a re-entry is marked with a gray exit cross. Six alert events go to the log, a sound or an e-mail, and to a webhook that posts JSON, plain text or a template of your own. It is free on the cTrader Store, with nothing held back.
Read literally, the way it was written
The VWAP in the fusion line restarts every trading day, and on the reference feed that day opens at 17:00 New York time - 21:00 UTC in US summer time, 22:00 in winter. The port computes that boundary from each bar's time and the US daylight-saving calendar, so it does not depend on a broker's server clock, and the VWAP matched on every bar of three charts, the hourly one spanning every clock change since 2023.
Two parts of the original never produce anything, and the port keeps them that way. A block of momentum scores is computed and read by nothing. And the divergence trigger in the scoring can never fire: a pivot is confirmed five bars after it forms, while the divergence test asks for a pivot at most three bars old. TradingView and the port agree on it - zero divergence triggers in every run - so the product documentation does not advertise divergence signals.
How the port was verified
The engine is platform-free C#: it references no cTrader type, so the code that ships can be compiled outside the platform and replayed against a bar series. Probes were derived from the original mechanically, plotting every internal series to the data window, and each probe and its bars - with their volume - were read in one evaluate.
39,198,761 cell comparisons over 31 runs on identical bars - ICMARKETS EURUSD M5 and H1, XAUUSD M5 and nineteen input sweeps - with zero mismatches in the indicator's own output. Two residues are declared, and both live in the last bits of a price. TradingView's simple moving average is not reproducible to the last bit by any closed form, so the SMA and the lines built from it differ by at most 1.2e-14. And the weights of the Arnaud Legoux average come from an exponential function that is none of four implementations tried; a correctly rounded one is bit-exact at the default length, and at a length of 50 it leaves six values one unit in the last place away. The script compares everything with a tolerance of 1e-10, so neither can change a trend, a trigger, a score, a mark, an alert or a colour, and none differs in any run. A mutation test proves the comparison goes red: 26 deliberate breaks of the engine, each caught.
And the pixels. Everything is drawn by a rasteriser in the engine, so the same code could be fed TradingView's own chart geometry and compared with TradingView's own screenshots. On EURUSD, XAUUSD and GBPUSD, 99.9 to 100% of the cloud's pixels and 97.4 to 99.8% of the labels', triangles' and crosses' land within two colour units of TradingView's; the lines match 87 to 89%, the rest sitting on their anti-aliased edges.
What the comparison found
A weighted average summed the other way round. TradingView's weighted moving average adds its terms oldest first. Summed newest first, the same formula agreed on 3,650 bars of 20,410; oldest first, on every one.
An exponential that is not the computer's. The Arnaud Legoux average normalises its weights before summing, and one of its 122 weights comes out one unit in the last place differently from the Windows runtime's exponential. A search moving each weight by one unit found exactly which; a correctly rounded exponential, computed in double-double arithmetic, then matched all 20,410 bars.
Labels whose edges are rounded separately. The BEAR label's top edge follows one rounding of the anchor and its bottom and pointer another, so the label is one pixel shorter on some bars than on others. The labels were measured from TradingView captures row by row, and every triangle and cross was extracted at all three sizes.
A highlight that drew bands. The six event outputs a cBot can read were first published as 0 or 1 on every bar. When cTrader highlights a selected indicator, those lines drew full-height gray bands across the chart. They are now empty except on the event's own bar.
The things that are deliberately different
The original's six alert conditions become a cTrader group with a switch per event, bar close or intrabar, and log, sound and e-mail delivery, plus the webhook, which the original does not have. One settings group loses the original's brand name; every setting keeps its title, default, limits and order. The script's limits of 500 labels and 50 lines are kept by default, with a switch to keep every mark.
On a live chart the indicator follows your broker's candles and your broker's tick volume. The VWAP, one fifth of the fusion line, and a volume filter in the confidence score read that volume, so the same settings can mark different bars on different feeds - the parity above was run on TradingView's own bars and volumes, because two different feeds cannot otherwise be compared at all.
Requirements
cTrader Desktop 5.x. It declares no access rights at all; the webhook posts through cTrader's own networking service, which is why it needs none. Seventy-eight parameters: the forty-two of the original with the same titles, defaults and limits, plus thirty-six cTrader-only ones for display, the alert channels, the webhook and diagnostics.
Support
Through the Discussion tab of the Store listing, so the conversation stays next to the product. Please include your broker, symbol, timeframe, cTrader version and a screenshot of the whole chart.
This is analytical software, not investment advice. It never places, modifies or closes an order, and it is built with no trading permissions at all. Trading involves risk. Past performance does not guarantee future results.