Flintridge Trader Pro for cTrader: the original, ported and verified bar by bar
Supply and demand zones built from confirmed swing pivots, each an ATR-thick band with its point of interest through the middle and converted into a break-of-structure mark when price closes through it. A higher timeframe moving average crossover for the entry, a stop and three targets as percentages of that entry, an eleven row dashboard and twelve alerts. The cTrader edition is a C# transcription of the original that was checked column by column on the same bars.
cTrader 5.x · C# on the cAlgo API · 64 parameters: the 41 inputs of the original plus 23 cTrader-only · sold on the cTrader Store, EURUSD trial
EURUSD M5, IC Markets feed, end of May to September 2026, the account’s full history, which TradingView reported as complete; measured with the parity harness described below
The Flintridge Trader Pro gallery, picture by picture
The 11 pictures of the cTrader Store gallery. Select any picture to open it full size.





What it does
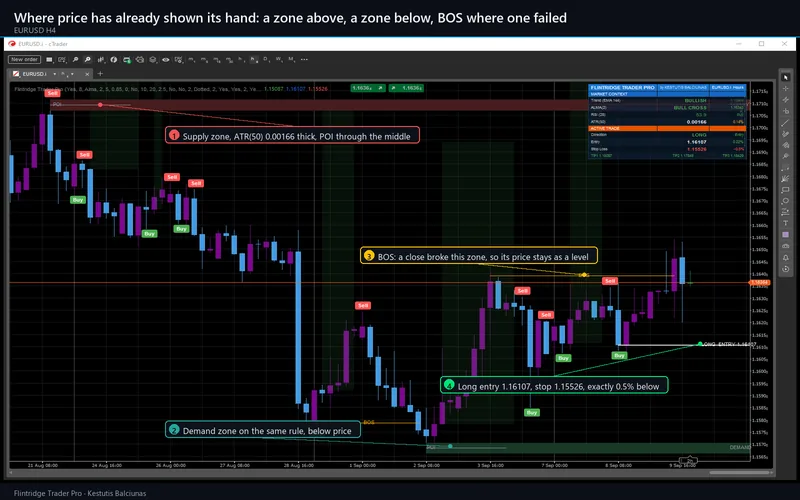
Flintridge Trader Pro marks where price has already shown its hand, and then tells you when the market turns at those places. Confirmed swing pivots build supply and demand zones, each one a band as thick as the current ATR with a point-of-interest line through the middle. When a close breaks through a zone, the zone is not deleted: it is converted into a break-of-structure mark and stays on the chart as the record of a level that failed. Twenty of each are kept, oldest dropped, and a new zone is refused if it would sit within two ATR of one that already exists.
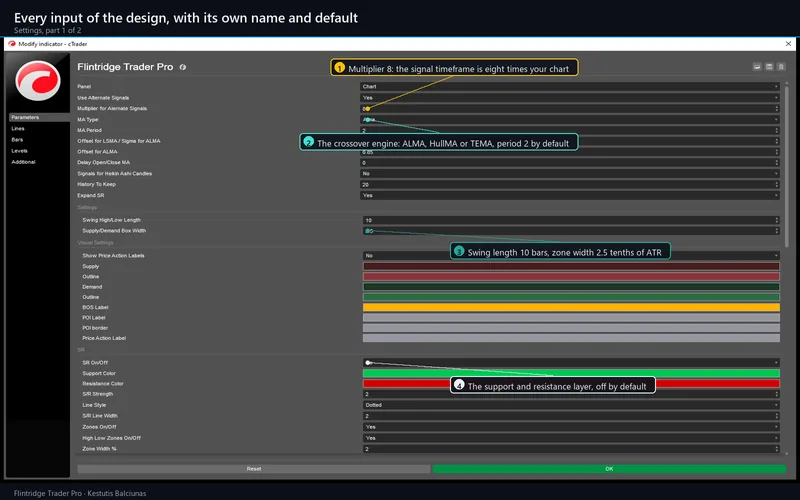
The signal is separate from the zones. A moving average of the closes and a moving average of the opens are computed on a higher timeframe (eight times your chart by default, so eight-hour bars on H1), and their crossover is the entry. The moving average is ALMA, HullMA or TEMA, at a period you choose, optionally on Heikin Ashi candles and optionally shifted back by a number of bars.
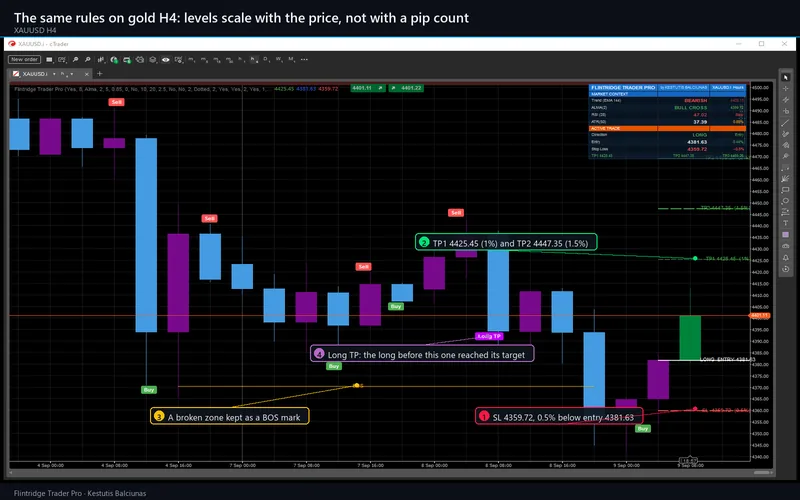
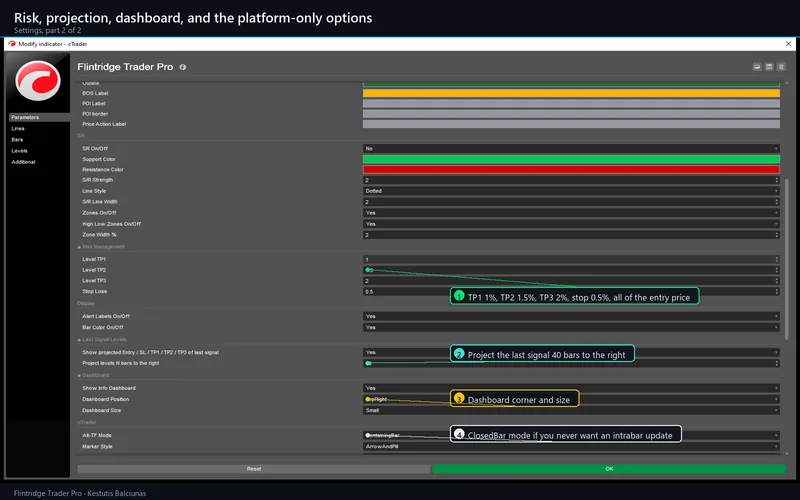
With the entry come a stop and three targets, all as percentages of the entry price: 0.5, 1, 1.5 and 2 by default, and a short reuses the same four numbers. They are drawn as stepped lines with a shaded risk band from entry to stop and a shaded reward band from entry to the first target, and the last signal is also projected forward as five labelled lines carrying each level’s price and its percentage.
What repaints, and what does not
A signal is evaluated on a closed bar. Once a Buy or Sell marker prints, its entry, stop and three targets are fixed.
Two things move while the newest bar is still forming, and both are inherited from the design rather than added by the port. A swing high is only confirmed once ten further bars exist, so the newest zone can appear, move or vanish until then; a confirmed zone never moves. And the higher-timeframe value is read from the larger bar that contains the current one, using that bar’s completed value. That is a genuine look-ahead on history, and it is exactly what the original does. While the containing bar is still forming, its value moves.
The cTrader edition adds one parameter the original does not have: Alt-TF Mode. Left at ContainingBar it reproduces the original exactly, which is what the verification below measures. Set to ClosedBar it reads the previous completed higher-timeframe bar instead, which cannot repaint: the behaviour the MetaTrader editions of this product have.
The dashboard
Eleven rows in the corner of your choice, in six positions and four sizes. A MARKET CONTEXT block that describes the market and blocks nothing: trend against the 144 EMA, the current crossover state, RSI(28) with a bull or bear read, and ATR(50) both in price and as a percentage of price. An ACTIVE TRADE block that is the last signal frozen at the bar it fired on: direction, entry, stop, and the three targets, each of which gains a tick when price reaches it, with the distance travelled from entry alongside.
Alerts
Twelve events, each behind its own toggle: the long and short entries, the three targets for each direction, and the two stops. Each fires once per closed bar, only for bars that close after you attach the indicator, never for history. Channels are the cTrader log, a sound of your choice and email through cTrader’s own settings. Nothing is sent anywhere by the indicator itself: it declares no access rights, opens no network connection, reads no file and never places, modifies or closes an order.
Parameters
| Group | Inputs | Notes |
|---|---|---|
| Signal engine (ungrouped, as in the original) | 10 | Alternate signals on or off and the multiplier, MA type and period, the ALMA sigma and offset, the MA delay, Heikin Ashi source, history depth and the S/R expansion switch |
| Settings | 2 | Swing high/low length and the supply/demand box width in tenths of an ATR |
| Visual Settings | 9 | Price action labels on or off, and the eight zone, BOS, POI and swing-label colours |
| SR | 9 | The support and resistance layer: on or off, its two colours, strength, line style and width, zones on or off, high-low zones, and the zone width in percent |
| Risk Management | 4 | The three target percentages and the stop percentage, reused by both directions |
| Display, Last Signal Levels, Dashboard | 7 | Alert labels and bar colouring, the projection and how far it extends, and the dashboard’s switch, corner and size |
| cTrader | 5 | Alt-TF mode, marker style, object caps and a debug log |
| cTrader · MT compatibility | 5 | An EMA-144 trend gate, an RSI(28) gate and a minimum bar gap between entries, with their thresholds. All three off by default; turning them on reproduces the MetaTrader editions’ signal set |
| cTrader · Alerts | 13 | One toggle per alert event, plus sound and email delivery |
64 parameters in total: the 41 inputs of the original with their titles, groups, order and defaults kept, including one upstream typo in an input title that was preserved rather than quietly fixed, and 23 cTrader-only ones. Every cTrader-only parameter is neutral at its default, so the shipped configuration reproduces the original exactly. The full table with every default ships with the product.
One default was deliberately changed. The original leaves all eight zone colours fully transparent, so its supply and demand layer is invisible until the user picks colours. The cTrader edition ships the visible palette the MetaTrader editions use, because an indicator whose main visual feature is invisible out of the box is a support problem rather than a faithful port. Every other default is the original’s.
Requirements and installation
cTrader 5.0 or newer, desktop. Buy or try on the Store listing, press Install, then add Flintridge Trader Pro from the indicator list. On the default settings it needs about 250 bars before it draws anything: the 144 EMA has to seed, ATR(50) needs its window, and a pivot is confirmed ten bars after it forms. It also needs enough history for two higher-timeframe bars to exist before the first crossover can happen. On a short chart you will correctly see nothing until you scroll back.
It runs on any symbol and any timeframe. M15, H1 and H4 are the window it was designed around; on lower timeframes the default MA period of 2 crosses often, which is what the multiplier and the three optional filters are there to control.
The trial
The trial edition is the same build with one restriction: it runs on EURUSD only, and broker suffixes such as EURUSD.i are accepted. On any other symbol it draws a notice instead. There is no time limit and every parameter is available.
How the port was verified
The bars were read straight out of the TradingView chart model: 20,841 EURUSD five-minute candles from the end of May to September 2026, which TradingView reported as the account’s full history. They were replayed through the same engine that ships inside the .algo. The engine references no cTrader type, so it can be compiled and run outside the platform with nothing in the way of the comparison.
On the TradingView side, seven probe copies of the script exposed its internals to the data window at ten decimals. Each probe is generated from the shipped source by a script that makes four mechanical changes and edits nothing else, so a diff between the shipped script and the probe shows only those four hunks. Between them the seven generations expose 160 columns: the moving averages and their higher-timeframe versions, the crossover triggers, the risk state machine, the entry, stop and three target lines, the twelve alert conditions, RSI, EMA and ATR, the higher-timeframe bar time, every supply, demand, BOS and POI box slot by slot plus a whole-collection integer digest on every bar, the swing labels, the support and resistance levels, and the eight values of the forward projection.
The result is zero. Across all seven generations and 20,803 comparable bars, every cell matches. Seven input sweeps then repeat the exercise with a rewritten default on both sides at once (alternate signals off, TEMA, HullMA, the MA delay, Heikin Ashi candles, swing labels on, and the support and resistance layer on), and every one of them is also zero.
What the script draws was compared separately, as data rather than by eye: both platforms’ chart models were read back and the dashboard was diffed cell by cell, along with the five projection lines including their solid/dashed/dotted styles, their widths and the exact wording of their price labels.
Several behaviours of the original were measured rather than assumed, because guessing any of them would have produced a silent, plausible-looking difference. Its higher-timeframe grid is not aligned to the epoch but to a constant offset, which was confirmed on every one of 2,607 bucket starts. Its crossover built-ins compare exactly, while its hand-written comparisons carry a 1e-10 tolerance. Its ALMA does not floor its offset. Its math.max and math.min propagate na rather than skipping it. And an index into a value computed inside a function reaches into that function’s own call history, not into the bar series. That rule, once measured, fixed 9,388 mismatches in one column.
What differs on purpose is written down rather than hidden: the dashboard’s brand cell carries the seller’s name, the zone colour defaults are visible instead of transparent, and cTrader has no zero-height box so a point-of-interest band is drawn as a line at the same price with the same extent.
Signals on a live chart will still differ from the same indicator on another broker’s feed, because the candles differ. That is a data difference, not a difference in the calculation, and it is why the comparison above is a same-bar replay rather than two screenshots.
Support
Questions about the product go through the Discussion tab of the Store listing or the contact page. Refunds are the Store’s 14-day money-back. Updates are free for buyers and are announced in the listing’s version history.
Chart captures are from the cTrader build on a demo account. This is analytical software, not investment advice; it never places, modifies or closes an order, and the marks on the target rows record only that price later touched a drawn level on the loaded history, with no spread, commission or slippage. Trading involves risk. Past performance does not guarantee future results.