Flux Gate Precision for cTrader: the original, ported and verified bar by bar
A rolling window of the last 44 candles gives a high and a low, and three Fibonacci thresholds are measured down from that high. A long needs a bar to close above both the mid line and the upper threshold; a short needs a close below both the mid line and the lower one. Every signal arrives with an entry, a stop and up to four targets already drawn and priced, and a break-even ladder that walks the exit up behind the trade. The cTrader edition is a C# transcription of the original that was checked column by column on the same bars.
cTrader 5.x · C# on the cAlgo API · 38 parameters: the 19 inputs of the original plus 19 cTrader-only · sold on the cTrader Store, EURUSD trial
EURUSD M5, IC Markets feed, the account’s full history, which TradingView reported as complete; measured with the parity harness described below
The Flux Gate Precision gallery, picture by picture
The 11 pictures of the cTrader Store gallery. Select any picture to open it full size.


What it does
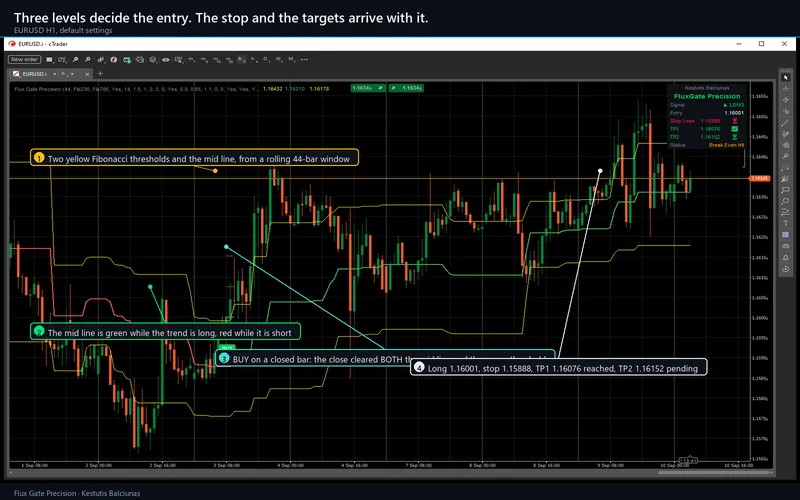
Flux Gate Precision measures the range the market has actually traded in, and tells you when price commits to one end of it. A rolling window of the last 44 candles gives the highest high and the lowest low, and three levels are measured downward from that high: an upper Fibonacci threshold at 23.6 per cent, a mid line at 50 per cent, and a lower threshold at 78.6 per cent. All three are drawn, and the mid line is green while the trend is long and red while it is short.
A long needs a bar to close above both the mid line and the upper threshold. A short needs a close below both the mid line and the lower one. Requiring two levels rather than one is what keeps it quiet while price oscillates around the middle of the range. A trend state also has to change hands: it will not print a second long until a short has intervened, so a single strong move does not produce a cluster of the same signal.
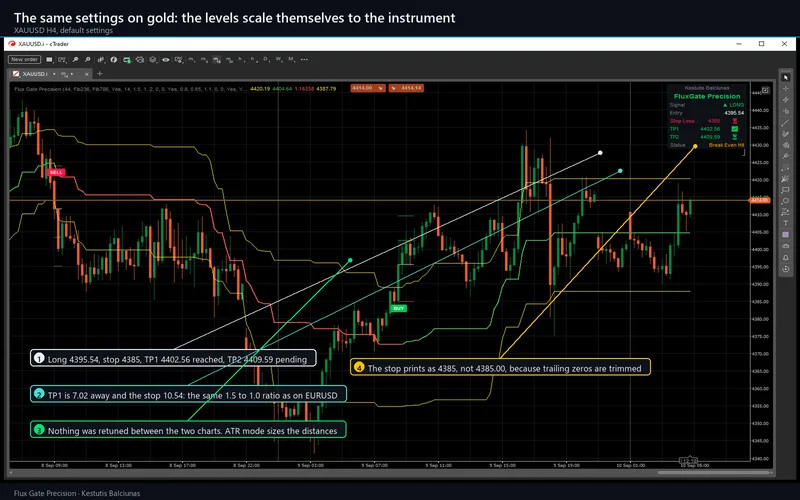
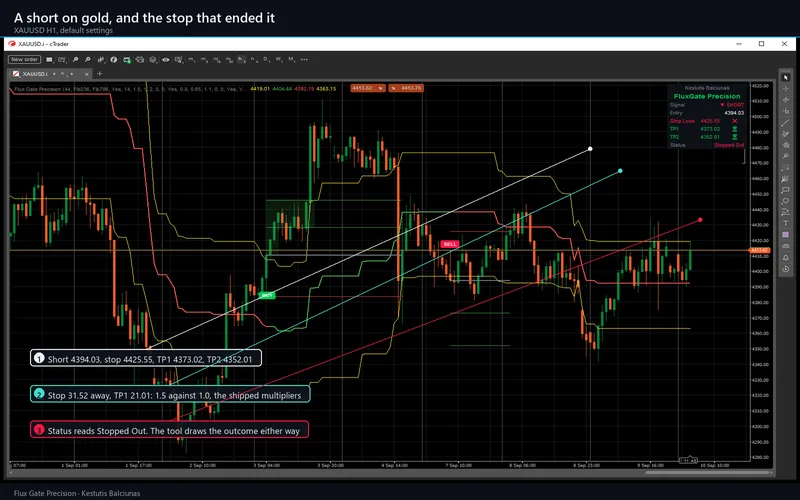
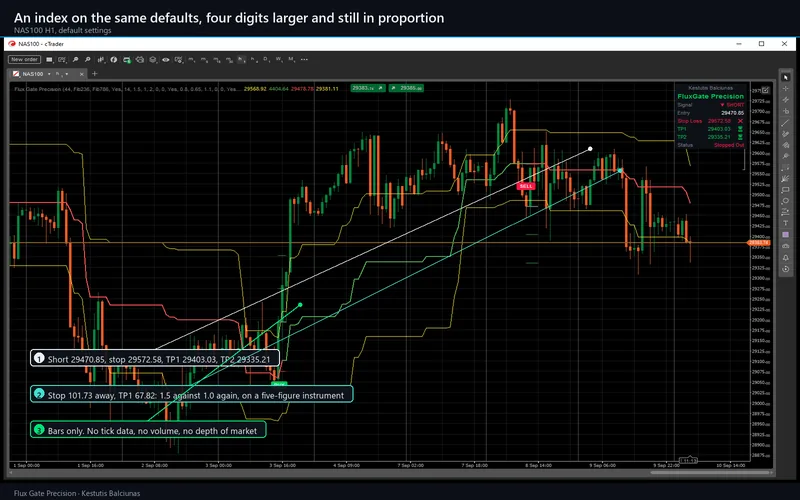
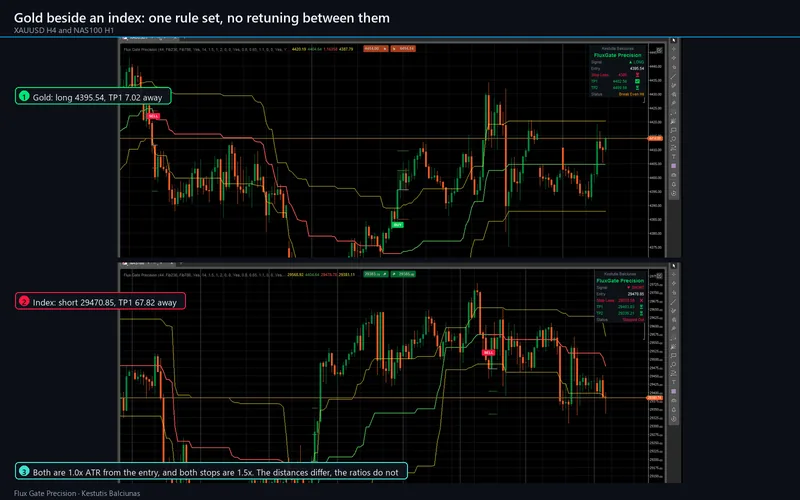
The moment a signal prints, the indicator fixes an entry, a stop and up to four take profits and draws each as a labelled line carrying its price. In the default ATR mode those distances come from current volatility, so the same settings behave sensibly on a five-minute chart and on a daily one, and on a currency pair and on gold. Manual mode sizes them as a fixed percentage of the entry instead.
What repaints, and what does not
Nothing that matters. Every decision is evaluated on a closed bar: the signal, the entry, the stop, all four targets and every alert. A marker that has printed will not move or vanish, and the level prices are fixed at the signal bar.
One thing does move while the newest bar is forming, and it is drawing rather than calculation: a live trade’s level lines and their price labels are redrawn a little further right on every tick so they keep up with the chart. That is the original’s own behaviour, and the prices they carry do not change.
The break-even ladder
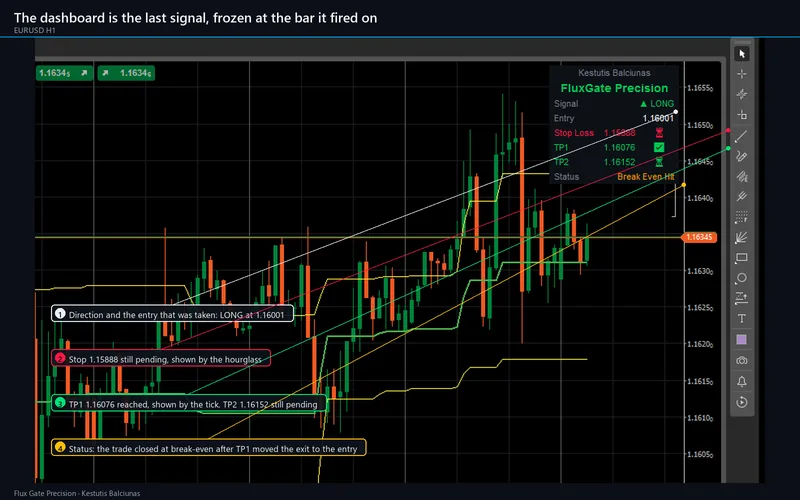
With Break Even on, the exit walks up behind the trade: reaching the first target moves it to the entry, the second moves it to the first target, the third to the second, and reaching the fourth closes the trade. A shaded band is drawn each time a level is reached, so a finished trade leaves a readable record on the chart instead of disappearing.
One property of the design is worth stating, because it surprises people: the ladder assumes the targets are in ascending order. If the third target is set nearer than the second, then reaching it moves the exit to a level price has already passed on the wrong side, and the trade closes on that same bar. On the test data every one of the 147 third-target hits behaved that way with the multipliers out of order, and only 10 of 25 did once they were ascending. The port reproduces the original exactly here rather than quietly correcting it.
The dashboard
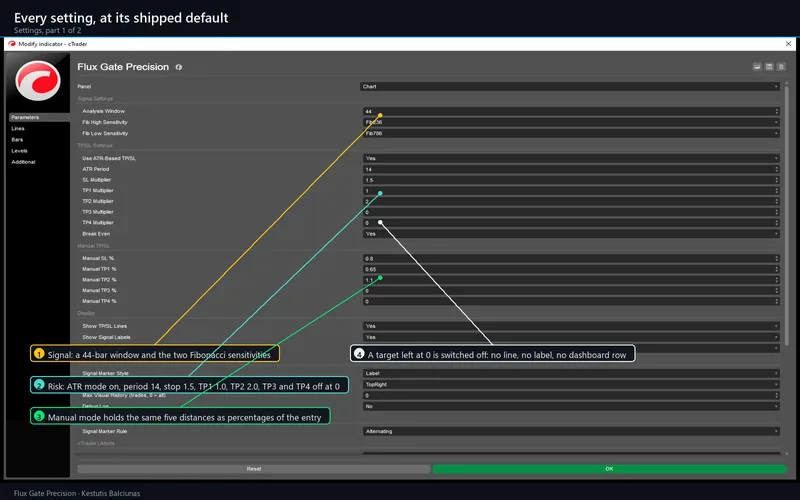
A panel in the corner of your choice, showing the last signal and what has happened to it since: direction, entry, stop, and each active target with a tick as price reaches it, over a status line that reads Active, All TPs Hit, Stopped Out, Break Even Hit or Trend Change. It is seven to ten rows depending on how many targets you have enabled, because a target with a multiplier of zero does not exist at all: no line, no label, no row and no alert.
Alerts
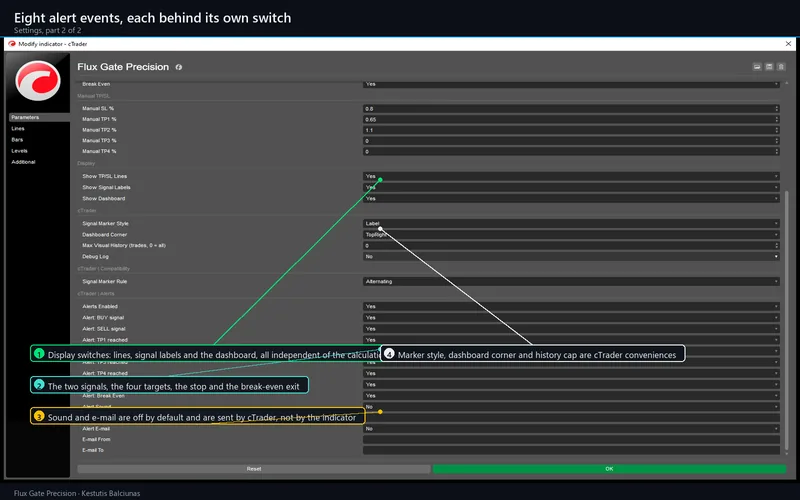
Eight events, each behind its own switch: the two signals, the four targets, the stop and the break-even exit. Each fires once per closed bar, and only for bars that close after you attach the indicator, so adding it to a long chart does not produce a wall of old alerts. Channels are the cTrader log, a sound of your choice and email through cTrader’s own settings. Nothing is sent anywhere by the indicator itself: it declares no access rights, opens no network connection, reads no file and never places, modifies or closes an order.
Parameters
| Group | Inputs | Notes |
|---|---|---|
| Signal Settings | 3 | The analysis window, and the two Fibonacci sensitivities. The original offers these as a fixed choice of values, so they are dropdowns here rather than free numbers |
| TP/SL Settings | 8 | ATR mode on or off, the ATR period, the stop multiplier and four target multipliers, and the break-even switch |
| Manual TP/SL | 5 | The same five distances as percentages of the entry price, used when ATR mode is off |
| Display | 3 | The level lines, the signal labels and the dashboard. All three are display only: none of them gates the calculation, which is measured rather than assumed |
| cTrader | 4 | Marker style, dashboard corner, a visual history cap and a debug log |
| cTrader · Compatibility | 1 | Which entries print a marker and fire an alert. The default reproduces the original; the alternative announces every trade the indicator opens |
| cTrader · Alerts | 14 | A master switch, one toggle per event, plus sound, sound file, email and two addresses |
38 parameters in total: the 19 inputs of the original with their titles, groups, order and defaults kept, and 19 cTrader-only ones. Every cTrader-only parameter is neutral at its default, so the shipped configuration reproduces the original exactly, and that is the configuration the verification below measures. The full table with every default ships with the product, generated from the built algorithm so it cannot drift from it.
Requirements and installation
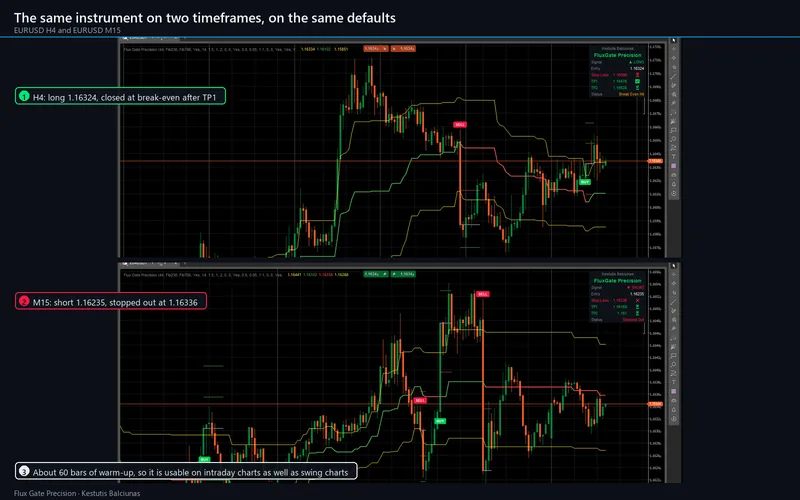
cTrader 5.0 or newer, desktop. Buy or try on the Store listing, press Install, then add Flux Gate Precision from the indicator list. It needs about 60 bars before it draws anything: a 44-bar window and a 14-period average. That is a short warm-up, so it is as usable on intraday charts as on swing charts. During those first few bars the stop and targets sit on the entry price until the average has enough data.
It runs on any symbol and any timeframe, and it uses bars only: no tick data, no volume, no depth of market. M15, H1 and H4 are the window it was designed around.
The trial
The trial edition is the same build with one restriction: it runs on EURUSD only, and broker suffixes such as EURUSD.i are accepted. On any other symbol it draws a notice instead. There is no time limit and every parameter and every feature is available.
How the port was verified
The bars were read straight out of the TradingView chart model: 20,995 EURUSD five-minute candles, which is the account’s entire history. The feed reported it as complete rather than being cut off at a round number. They were replayed through the same engine that ships inside the .algo. That engine references no cTrader type at all, so it compiles and runs outside the platform with nothing in the way of the comparison.
On the TradingView side, two probe copies of the script exposed its internals to the data window at ten decimals. Each probe is generated from the shipped source by a script that makes four mechanical changes and edits nothing else, so a diff between the shipped script and the probe shows only those four hunks. Between them the two generations expose 56 columns: the volatility path, the rolling high and low, all three Fibonacci levels, the trend state machine, the eight alert events, and every field of the live trade: its direction, entry, stop, four targets, break-even level and each of its triggered flags.
The result is zero. Across 6,088,283 cell comparisons, every cell matches. Eight input sweeps then repeat the exercise with a rewritten default on both sides at once: the manual percentage mode, both Fibonacci sensitivities, a different window length, break-even off, the two dormant targets switched on in two different orders, and the level display switched off. Every one of them is also zero. Each sweep was then checked to confirm it actually changed the output, because a sweep that changes nothing agrees perfectly and proves nothing.
Several behaviours of the original were measured rather than assumed, because guessing any of them would have produced a silent, plausible-looking difference. Its default number formatting, which governs every price in the dashboard and on every label. Its tick-rounding, which turns out to carry the same tiny floating-point residue the C# does, so no special case was needed. And the tolerance in its own float comparisons: the original decides whether a target exists at all by asking whether that target’s price differs from the entry price, in ten separate places. Ported with an ordinary comparison, every disabled target would have come back to life, adding two lines, two labels, two dashboard rows and two alert streams. Measured, it is correct.
What differs on purpose is written down rather than hidden: the dashboard’s brand cell carries the seller’s name, the single trend line becomes two coloured outputs with a bridge value where they meet because cTrader fixes an output’s colour at declaration, and the shaded bands are drawn as filled rectangles because cTrader has no fill-between-two-lines primitive.
Signals on a live chart will still differ from the same indicator on another broker’s feed, because the candles differ. That is a data difference, not a difference in the calculation, and it is why the comparison above is a same-bar replay rather than two screenshots.
Support
Questions about the product go through the Discussion tab of the Store listing or the contact page. Refunds are the Store’s 14-day money-back. Updates are free for buyers and are announced in the listing’s version history.
Chart captures are from the cTrader build on a demo account. This is analytical software, not investment advice; it never places, modifies or closes an order, and the ticks on the target rows record only that price later touched a drawn level on the loaded history, with no spread, commission or slippage. Trading involves risk. Past performance does not guarantee future results.