FXB Confluence Engine for cTrader: the original, ported and verified bar by bar
Ten independent conditions are scored on every closed bar and the dashboard shows every one of them separately, so a signal that is suppressed can be explained rather than guessed at. A range filter that steps only when price clears its ATR band supplies the trend; agreement across four timeframes, a cross-check of the same filter at three other sensitivities, EMA and momentum alignment, volatility, RSI, volume, VWAP and candle structure supply the rest. Two anti-chop filters, ADX and the Choppiness Index, can each take a point away and can shut the gate entirely. The cTrader edition is a C# transcription of the original that was checked column by column on the same bars.
cTrader 5.x · C# on the cAlgo API · 65 parameters: the 46 inputs of the original plus 19 cTrader-only · sold on the cTrader Store, EURUSD trial
EURUSD M5, IC Markets feed, the account’s full history, which the charting platform reported as complete; measured with the parity harness described below
The FXB Confluence Engine gallery, picture by picture
The 13 pictures of the cTrader Store gallery. Select any picture to open it full size.



What it does
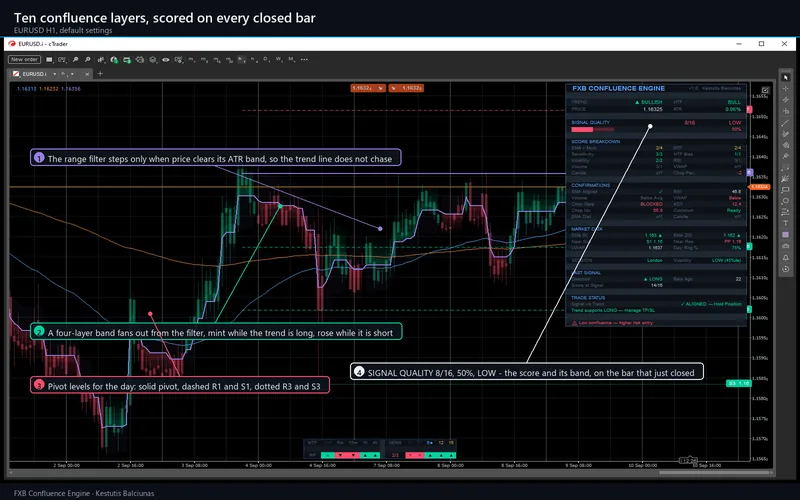
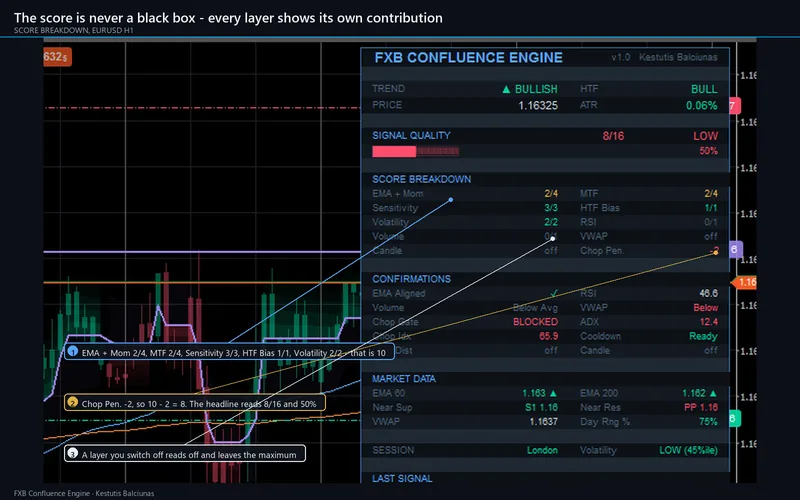
FXB Confluence Engine scores ten independent conditions on every closed bar and then shows you all ten, separately, in a panel on the chart. The number is not the product; the breakdown is. When the headline reads 8/16 you can see which layers agreed, which did not, and what the anti-chop filters took away.
The trend itself comes from a range filter: a line that only steps when price clears a band sized from the current ATR, so it holds still through noise instead of chasing it. Around it sits a four-layer band, coloured with the trend, and beneath it a strip showing the same filter on five timeframes and at four different sensitivities at once.
The other nine layers are agreement across the 5m, 15m, 1h and 4h charts; a cross-check of the same filter at sensitivity 12 and 16; EMA and momentum alignment over three lookbacks; a volatility rank and percentile; RSI; volume against its own average; VWAP; and candle structure. Each contributes a bounded score. Switch one off and it reads off and leaves the maximum, so the denominator follows your settings rather than pretending the layer scored zero.
The anti-chop gate
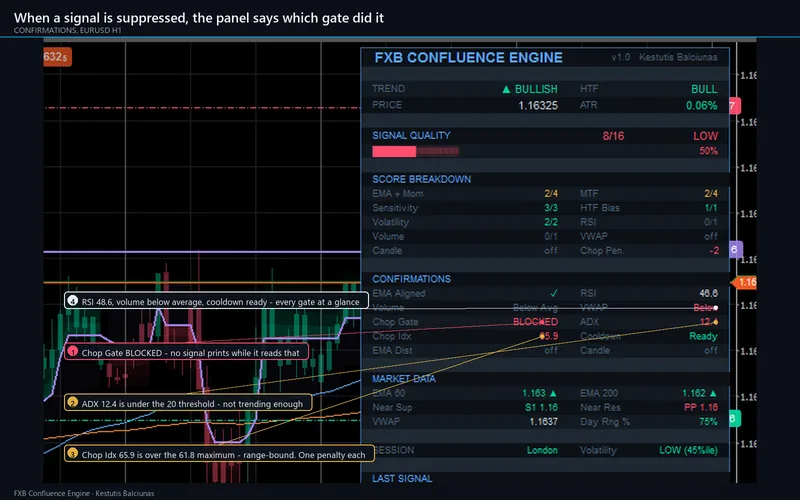
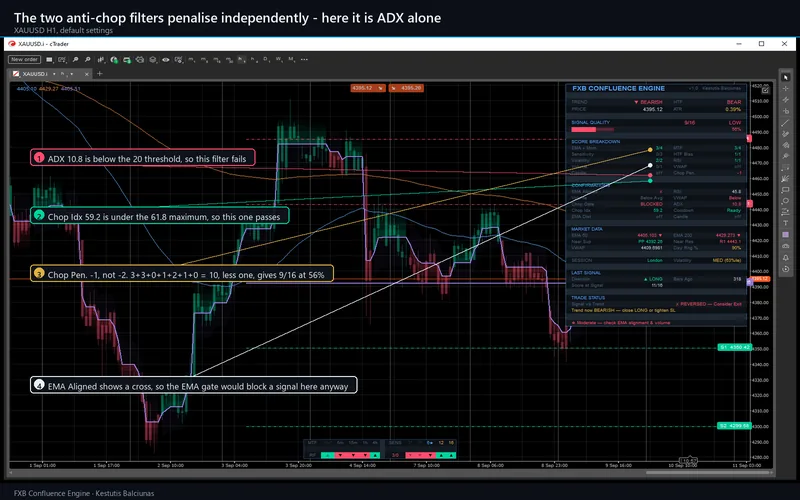
Two filters decide whether a signal is allowed at all. ADX measures whether the market is trending strongly enough; the Choppiness Index measures whether it is range-bound. They are independent, each costs one point when it fails, and either can shut the gate on its own. A cooldown stops a whipsaw firing twice.
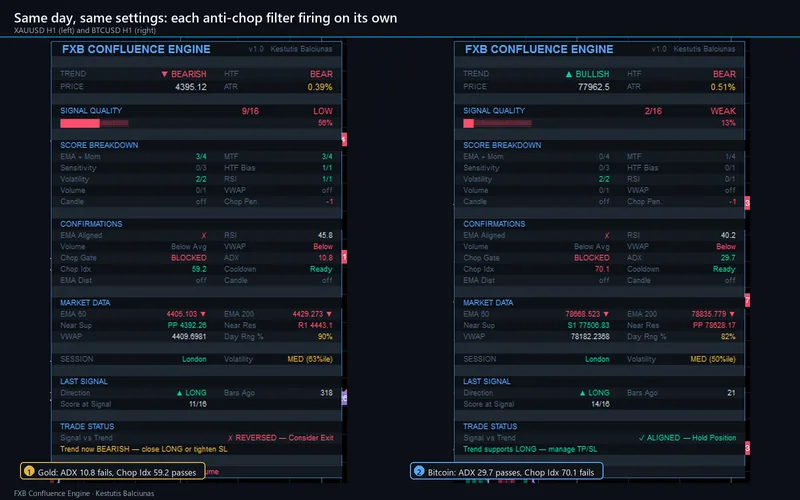
This is the part worth seeing on more than one chart. On the same afternoon, gold failed only the ADX test - 10.8 against a threshold of 20, while the Choppiness Index at 59.2 passed - and bitcoin failed only the Choppiness test, at 70.1 against a maximum of 61.8, while ADX passed at 29.7. Both showed a penalty of minus one, for opposite reasons, and in both cases the panel named which filter had acted. A suppressed signal is never a mystery here.
What repaints, and what does not
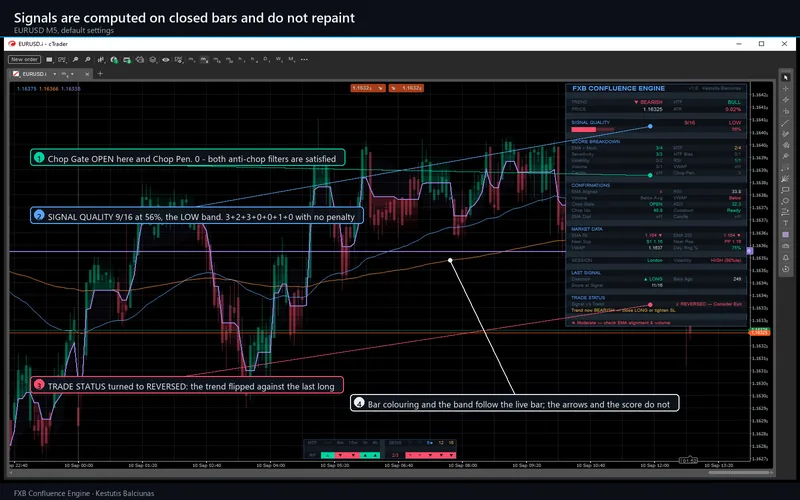
Signals do not. Every signal is computed from a closed bar and the score that accompanies it is fixed at that bar. A marker that has printed will not move or vanish.
Four things do follow the live bar, deliberately, because the original does: the range-filter line, the four-layer band, the optional background tint and the bar colouring. They will move within the forming bar. If you are reading the chart to make a decision, read the arrows and the dashboard, not the moving line.
The dashboard
Four columns and about thirty rows: trend and higher-timeframe bias; price and ATR; the score with a band label and a bar; the ten-layer breakdown; the state of every gate; both EMAs with slope arrows, the nearest pivot support and resistance, VWAP and the day’s range against its average; the trading session, worked out in its own timezone with daylight saving handled; the last signal and how long ago it fired; and whether that signal still agrees with the current trend.
Under the chart, a second strip shows the trend on 1m, 5m, 15m, 1h and 4h, and the same filter at sensitivity 3, 5, your setting, 12 and 16. Two details are faithful to the original and worth knowing: the 1m cell is dimmed because it is informational and does not enter the score, and on a 4-hour chart every slot in that row is a lower timeframe, so the row is telling you about internal agreement. The higher-timeframe bias row is the one that looks upward.
Pivot levels
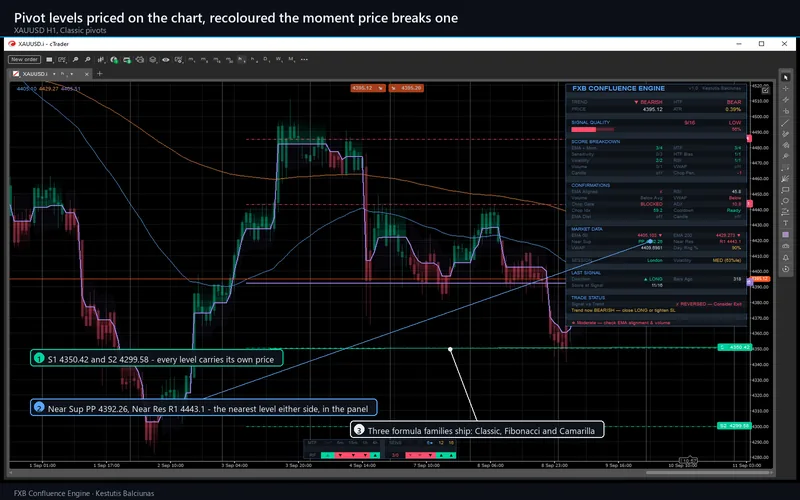
Nine levels on a timeframe you choose, in three formula families - Classic, Fibonacci and Camarilla. Each is drawn with its own weight and style, carries its price in a label, and recolours the moment price closes through it. The panel also reports the nearest level above and below as a running pair.
Alerts
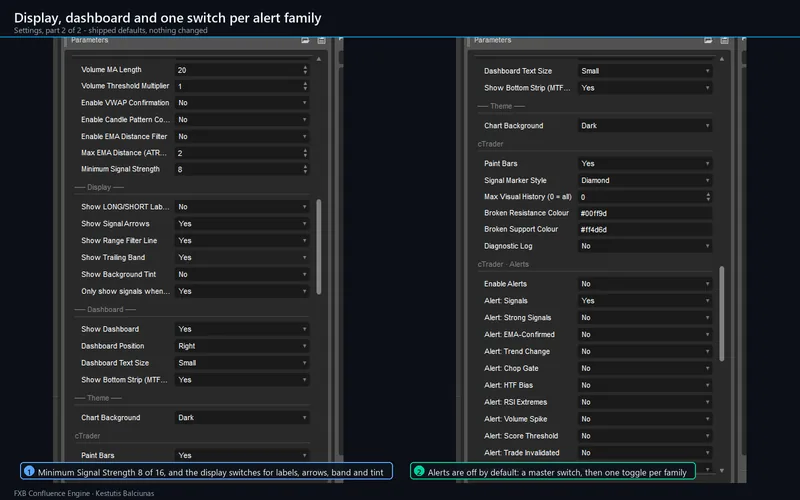
Nineteen conditions grouped into ten families, because nineteen separate switches would be unusable: signals, strong signals, EMA-confirmed signals, trend changes, chop-gate transitions, higher-timeframe bias flips, RSI extremes, volume spikes, score-threshold crossings and trade invalidation.
They are off by default. Each fires once per closed bar, is deduplicated, and none fire while the indicator is still loading history, so attaching it to a chart of twenty thousand bars does not produce twenty thousand alerts. Nothing is sent anywhere by the indicator itself: it declares no access rights, opens no network connection, reads no file and never places, modifies or closes an order.
Parameters
| Group | Inputs | Notes |
|---|---|---|
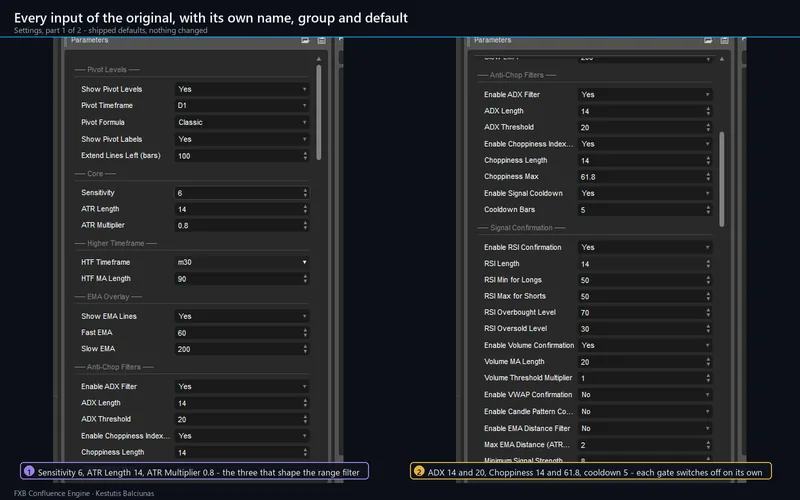
| Pivot Levels | 5 | Show or hide, the pivot timeframe, the formula family, the labels, and how far left the lines extend |
| Core | 3 | Sensitivity, ATR length and ATR multiplier - the three that shape the range filter |
| Higher Timeframe | 2 | The timeframe that drives the bias layer, and one input the original declares and never uses, kept so the dialog matches it exactly |
| EMA Overlay | 3 | Show or hide, and the fast and slow periods |
| Anti-Chop Filters | 8 | ADX, the Choppiness Index and the cooldown, each with its own switch, length and threshold |
| Signal Confirmation | 14 | RSI, volume, VWAP, candle patterns and the EMA-distance filter, plus the minimum score a signal must reach |
| Display | 6 | Labels, arrows, the filter line, the band, the background tint, and whether the EMA gate applies to signals |
| Dashboard | 4 | Show or hide, corner, text size, and the bottom strip |
| Theme | 1 | Dark or Light. Cosmetic: it moves no computed value, which was measured rather than assumed |
| cTrader | 6 | Marker style, bar painting, a visual history cap, the two break colours and a diagnostic log |
| cTrader · Alerts | 13 | A master switch, one toggle per alert family, plus sound and log output |
65 parameters in total: the 46 inputs of the original with their titles, groups, order and defaults kept, and 19 cTrader-only ones. Every cTrader-only parameter is neutral at its default, so the shipped configuration reproduces the original exactly, and that is the configuration the verification below measures. The full table with every default ships with the product, generated from the built algorithm so it cannot drift from it.
Requirements and installation
cTrader 5.0 or newer, desktop. Buy or try on the Store listing, press Install, then add FXB Confluence Engine from the indicator list. Give it about 300 bars before judging it: the slow EMA is 200 periods and the volatility percentile needs 60, so on a shorter history the score is computed from an incomplete window.
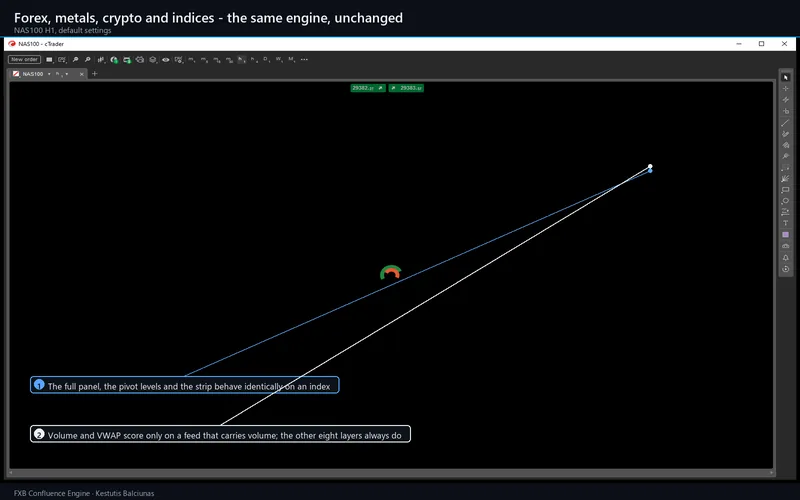
It runs on any symbol and any timeframe, from one minute to daily, with 5m, 15m, 1H and 4H the window it was designed around. Two of the ten layers - volume and VWAP - need a feed that carries volume; the other eight work on any feed, and the maximum adjusts so the score stays honest.
The trial
The trial edition is the same build with one restriction: it runs on EURUSD only, and broker suffixes such as EURUSD.i are accepted. On any other symbol it draws a notice instead. There is no time limit and every parameter and every feature is available.
How it was verified
The engine is written so that it can be run outside cTrader entirely. The calculation lives in a layer that references no platform type at all, which means the same code that ships can be replayed over a bar file by a test harness. That is the whole basis of what follows: the thing being measured is the product, not a second implementation of it.
A probe was derived mechanically from the original - the source unchanged apart from a handful of generated edits, one plot per internal series - and attached to a chart alongside it. Both sides then read the same bars: the harness replays the very file dumped from the chart the probe was attached to. Seven probe generations covered 135 internal series; nine sweeps moved one input at a time to reach code the defaults never execute, including two entire pivot formula families and both display flags.
| Measure | Result |
|---|---|
| Bars compared, identical feed | 20,849 |
| Runs | 16 - seven generations and nine sweeps |
| Series compared | 135 |
| Cell comparisons | 6,922,033 |
| Mismatches | 0 |
Zero was the target rather than the hope. Every one of the eighteen indicator calls in the original runs on every bar at the top level, with none buried inside a conditional branch - the construct whose behaviour is genuinely undefined. A script built that way has nothing indeterminate in it, so anything short of exact agreement would have been a defect.
What the verification found
Six real defects, four of which were invisible at the default settings. The two most interesting were not arithmetic at all.
The first was in how the alternate timeframes are built. Deriving four-hour and daily bars from five-minute ones by simple arithmetic puts them on a grid anchored to the epoch; the charting platform anchors them to the session open instead. Fifteen-minute, thirty-minute and hourly bars aggregate correctly, so the error was invisible on four of the six series it affected - and it accounted for more than twenty thousand differences in the VWAP column alone. The fix was to capture the real bars for every timeframe rather than to guess an offset.
The second was a session window. A session defined as 00:00 to 09:00 in Tokyo applies no weekday mask at all, and excluding weekends produced 1,008 differences - every one of them a Tokyo Saturday morning, which is Friday afternoon in London, when the currency market is plainly open. London and New York were unaffected either way, because no bar falls inside their windows at a weekend. That is exactly how a wrong assumption survives a port: it only bites where one window happens to straddle the edge of the week.
Two failures during the run turned out not to be defects at all, and that mattered more. One generation failed on nearly nine thousand cells and then passed twice with no change to the code; a sweep disagreed on twenty thousand cells of a column the swept input cannot influence. In both cases the capture had moved, not the engine. Re-running until a test goes green is the habit that hides real defects, so every generation now carries two shared canary series and a separate check asserts that all seven captures describe one consistent chart state.
One limitation is stated rather than smoothed over. The one-minute series feeding a single cell of the bottom strip could only be verified over the most recent quarter of the window, because that is as much one-minute history as the feed would serve. It affects one display cell and no signal: that series does not enter the score. Every other timeframe covers the full range and matches exactly.
What differs from the original, deliberately
Three things, all recorded with the product. The dashboard’s corner cell prints my name instead of a web address, because a URL inside a chart visual is not permitted on the Store. The band fills keep their dark colours under the Light theme, because cTrader’s cloud fills take fixed colours and cannot re-tint; everything else follows the theme. And the nineteen alert conditions are grouped into ten switches rather than nineteen.
Everything else is reproduced as found, including the parts that look like mistakes: the bullish and bearish candle patterns are not mirror images of each other, the cooldown counter reads one rather than zero on the bar after a signal, and one input is declared and never used. The last of those is not merely asserted - a dedicated sweep moves it and compares nearly four hundred thousand cells to prove it changes nothing.
Support
Questions about the product go through the Discussion tab of the Store listing or the contact page. Refunds are the Store’s 14-day money-back. Updates are free for buyers and are announced in the listing’s version history.
Chart captures are from the cTrader build on a demo account. This is analytical software, not investment advice; it never places, modifies or closes an order, and the score it prints is a count of conditions met on a closed bar, not a forecast. Trading involves risk. Past performance does not guarantee future results.