Helix Volume Profile for cTrader: the original, ported and verified bar by bar
Most volume profiles bin a fixed window into flat horizontal bars. This one derives its window from a higher-timeframe session that adapts to the chart, fits a logarithmic regression across every bar of that session, and leans each bin along the fitted slope, so the profile describes where volume accumulated relative to the session’s drift rather than ignoring it. A Point of Control marks the heaviest level and takes its colour from the direction the channel is travelling. The cTrader edition is a C# transcription that was checked column by column against the original on the same bars.
cTrader 5.x · C# on the cAlgo API · 24 parameters: the 22 of the original plus 2 cTrader-only · AccessRights = None · sold on the cTrader Store, EURUSD trial
EURUSD M5, IC Markets feed. This port does not claim zero. Every mismatch traces to the charting platform’s own standard-deviation function, which does not compute the textbook value in double precision; the residue is bounded at 8.79e-06 in price and reaches 99 bars of 21,267. The regression itself is bit-perfect.
The Helix Volume Profile gallery, picture by picture
The 10 pictures of the cTrader Store gallery. Select any picture to open it full size.



What it does
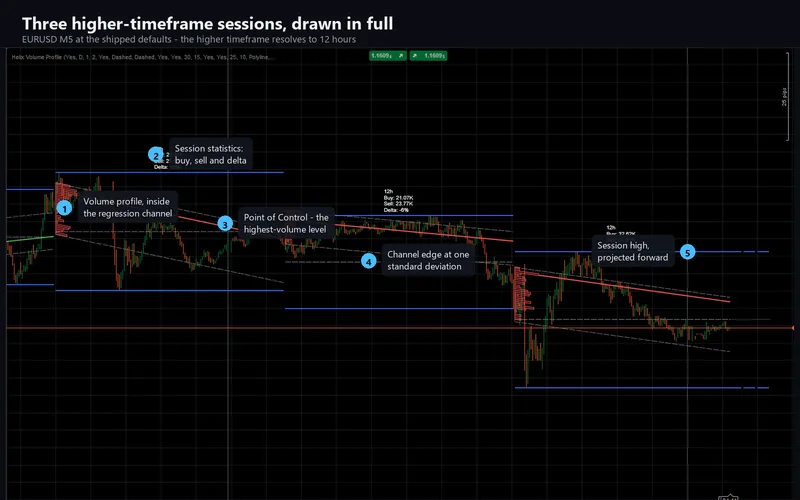
A volume profile tells you where trading actually happened. Most of them take a fixed window, a day or a visible range, and stack flat horizontal bars against it. Helix Volume Profile does two things differently, and both come from the same idea: a session is not a flat box.
First, the window is a higher-timeframe session that adapts to the chart you are on. On a 5-minute chart it is 12 hours; on 1-minute, four hours; on 15-minute, two days; on hourly, a week. You can override it and type any resolution you like, in minutes, days, weeks or months.
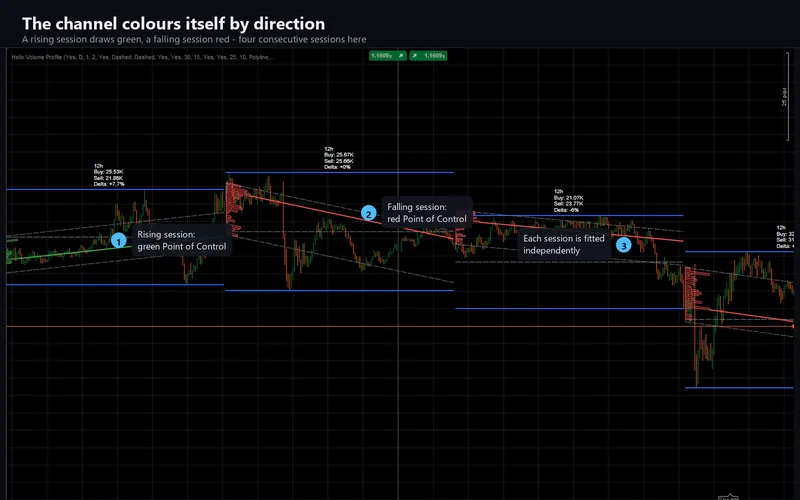
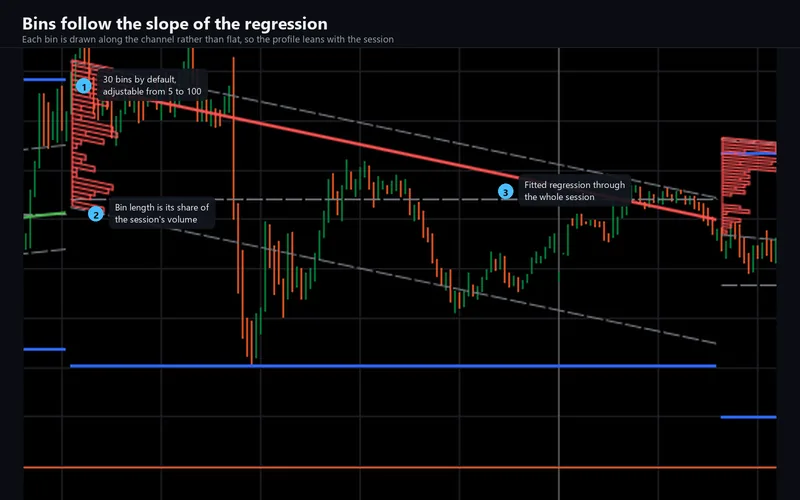
Second, a logarithmic regression is fitted across every bar of that session, a channel is drawn a configurable number of standard deviations around it, and the profile’s bins are drawn along that slope. A bin is a sheared parallelogram, not a flat bar. So the histogram describes where volume gathered relative to the session’s own drift. That is a different question from where it gathered in absolute price terms, and usually a more useful one inside a trend.
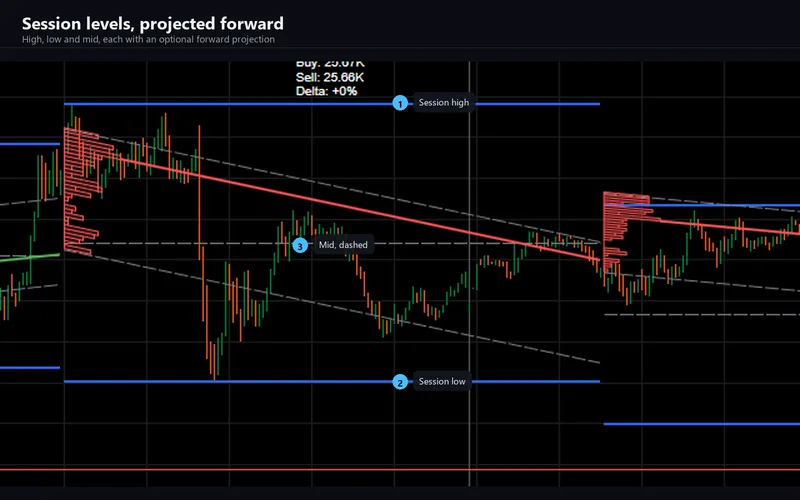
On top of that: the heaviest bin is marked with a Point of Control line coloured by the direction the channel is travelling; the session’s high, low and mid are drawn and can be projected forward; and a compact label reports buy volume, sell volume and the delta between them.
What repaints, and what does not
Everything in the live session moves, and this is worth being blunt about rather than burying.
The original has no closed-bar gate anywhere. While a session is open, its high and low, the regression, the channel and every profile bin are re-measured on every tick across the bars so far. They will move. Once the session closes, its drawings are frozen and never change again.
That is the method working as designed: a session-based profile cannot be final until the session is. But it means the live channel is context, not a level to hang an order on. Read a closed session for that.
How it was verified
The cTrader edition is a C# transcription, and it was checked against the original rather than eyeballed. The engine is kept free of any platform type so the exact code that ships can be replayed outside the terminal; the original was instrumented to publish its internals on the same chart; and the two were compared column by column, bar by bar, on identical data.
2,423,542 cell comparisons across five runs on 21,318 identical EURUSD M5 bars. 551 mismatches, 0.023%.
This page does not claim zero, and the reason is worth stating plainly, because it is the single most interesting thing the port turned up.
Everything structural is exact on every bar: the session boundaries, the window length, the regression’s slope and intercept, both channel endpoints, the natural logarithm of every close, the session high, low and mid, and the buy, sell and delta figures. The log-regression, the calculation the product is named for, is bit-perfect.
Every one of the 551 mismatches comes from one place: the charting platform’s own standard-deviation function does not compute the textbook value in double precision. Measured against a hand-rolled equivalent over 20,961 bars, the built-in differs on every single one of them even at a fixed window length, and at one bar it returned a small positive number where the true answer is exactly zero. Five independent formulations, including the platform’s own published reference implementation, all agree with each other and disagree with the built-in.
The residue is bounded at 8.79e-06 in price, well under a pip, and its median is 5.34e-10. It matters in exactly one place: at the very start of a session the channel is narrow, a bin can be narrower than the residue, and a price sitting on a bin boundary can land one bin over. That reaches 99 bars of 21,267, 0.47%, and their median session age is five bars.
There is no fix for it, on either side, because it is a built-in rather than something the original could be written differently to avoid. So it is measured, bounded, published, and the tolerance that would have hidden it was removed.
Reproduced faithfully, including the awkward parts
A port that quietly improves its source is no longer a port. Three behaviours here look like defects, are the original’s, and are reproduced deliberately.
On a Daily chart the automatic higher timeframe picks Daily. The original’s selector has two separate branch chains where one was intended, so the daily case falls through to a daily result. Every bar then becomes its own session, which leaves no window to fit a channel to, and only the high, low and mid lines are drawn. Turn the automatic mode off and set a longer session by hand and it behaves normally. This is in the troubleshooting guide as the first entry, because it is the first thing anyone will hit.
Switching the volume profile off also removes the channel lines and the Point of Control. In the original those are drawn inside the same branch as the bin accumulation, so with the profile off no bin is ever filled and the branch that handles an empty profile removes them too. Surprising, documented, not repaired.
The first bar of every session has no channel. The window resets to one bar at a boundary, which leaves the regression undefined for that bar. It reappears on the next one.
Parameters
| Group | Inputs | Notes |
|---|---|---|
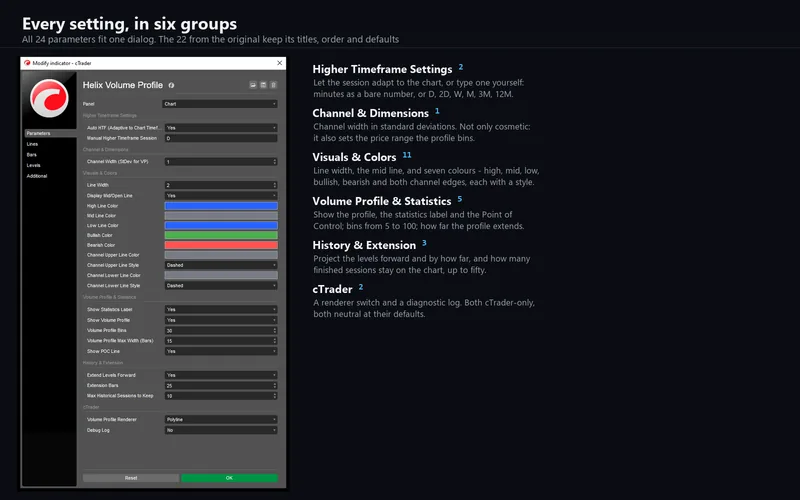
| Higher Timeframe Settings | 2 | Adapt the session to the chart automatically, or type one yourself in minutes, days, weeks or months |
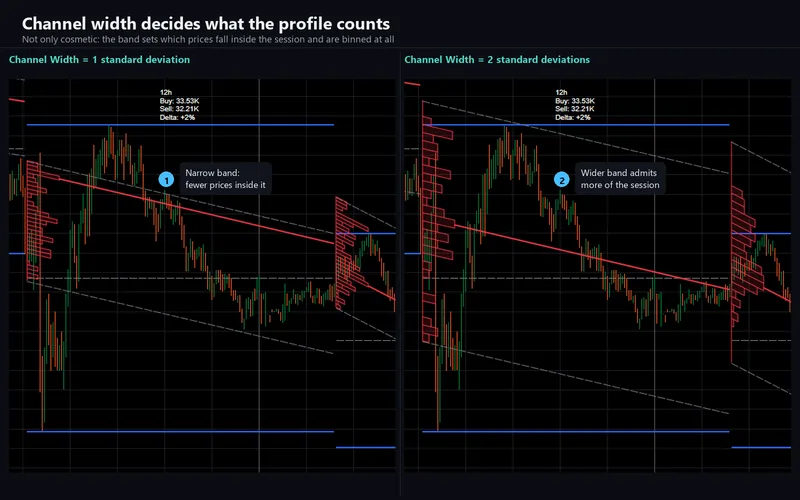
| Channel & Dimensions | 1 | Channel width, in standard deviations. It also sets the price range the profile bins |
| Visuals & Colors | 11 | Line width, the mid line, and seven colours: high, mid, low, bullish, bearish and both channel edges, each with its own line style |
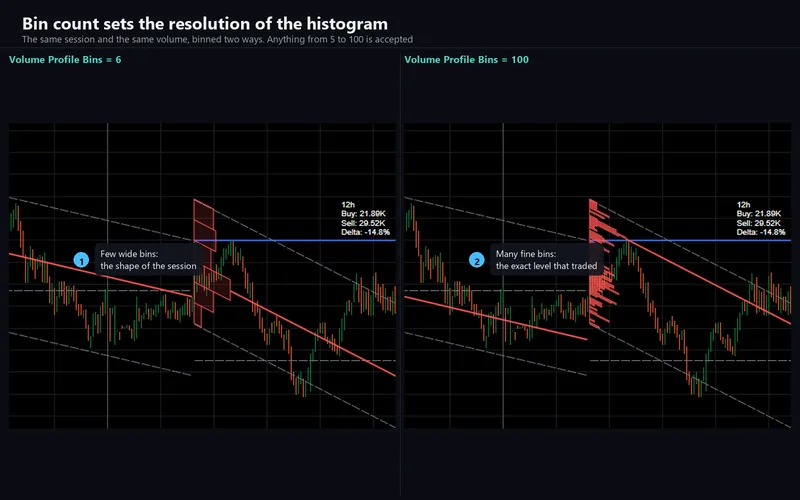
| Volume Profile & Statistics | 5 | Show the profile, the statistics label and the Point of Control; the number of bins from 5 to 100; and how far the profile extends |
| History & Extension | 3 | Project the levels forward and by how far, and how many finished sessions to keep, up to fifty |
| cTrader | 2 | A renderer switch that exists because the platform has no polyline drawing object, and a diagnostic log. Both neutral at their defaults |
Twenty-four in total: the twenty-two of the original, with its titles, order, defaults and groups preserved and checked against the source mechanically, plus two of the port’s own.
What it will not do
It has no alerts in this version, because the original has none and an alert family that fires where the original is silent would not be a port. It declares no access rights at all: it cannot place, modify or close an order, cannot read or write a file, and opens no network connection. It publishes the session high, low, mid and Point of Control as indicator outputs, drawn transparent, so a cBot can read the levels without re-implementing any of this.
One honest limitation: on a forex symbol, volume is the tick count your broker reports. Two brokers will not agree, so your profile is your feed’s. The levels and the channel will agree; the bin heights may not.
Support
Questions about the product go through the Discussion tab of the Store listing or the contact page. Refunds are the Store’s 14-day money-back. Updates are free for buyers and are announced in the listing’s version history.
Chart captures are from the cTrader build on a demo account. This is analytical software, not investment advice; it never places, modifies or closes an order, and it is built with no trading permissions at all. The live session updates on every tick and its drawings move until that session closes. Trading involves risk. Past performance does not guarantee future results.