Hyper Trend PRO for cTrader: the original, ported and verified bar by bar
A trend indicator that tells you the trend has turned is easy to write and hard to trade, because it says nothing about whether the rest of the chart agrees. This one grades every turn. A SuperTrend marks the flip; five independent checks then vote on it - the MACD histogram, a long EMA pair, ADX, volume against its own average, and the slope of a Hull average - and the signal carries that score as stars. A preset decides how high the score has to be before the signal is shown at all. At the moment it prints, an entry, an ATR-sized stop and three targets are fixed and drawn. The cTrader edition is a C# transcription checked against the original, bar by bar and object by object, on the same bars.
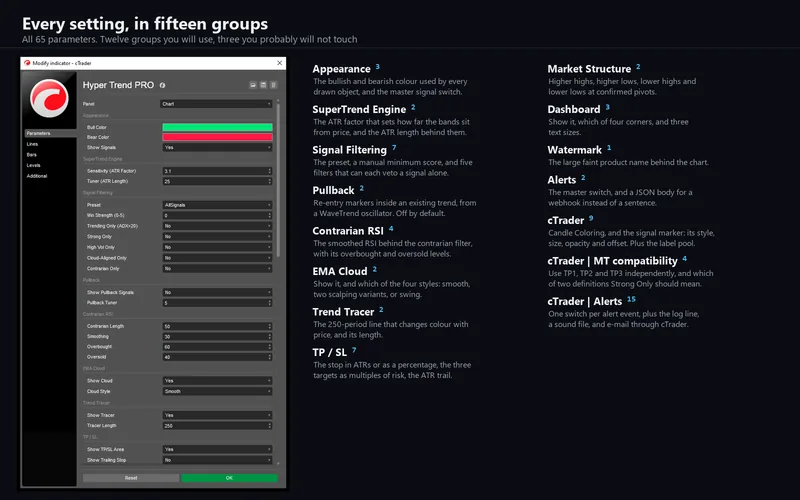
cTrader 5.x · C# on the cAlgo API · 65 parameters: the 37 of the original plus 28 cTrader-only · AccessRights = None · sold on the cTrader Store, EURUSD trial
ICMARKETS EURUSD M5, 20,141 bars - the whole history the feed would serve. Four probe generations compared every internal series bar by bar; 26 input sweeps moved one setting at a time on both sides, because most of this design is dormant at its defaults; and four further runs compared every drawn line, plate, box and table cell field by field. Zero was the acceptance bar, and it was set before any C# was written.
The Hyper Trend PRO gallery, picture by picture
The 10 pictures of the cTrader Store gallery. Select any picture to open it full size.
What it does
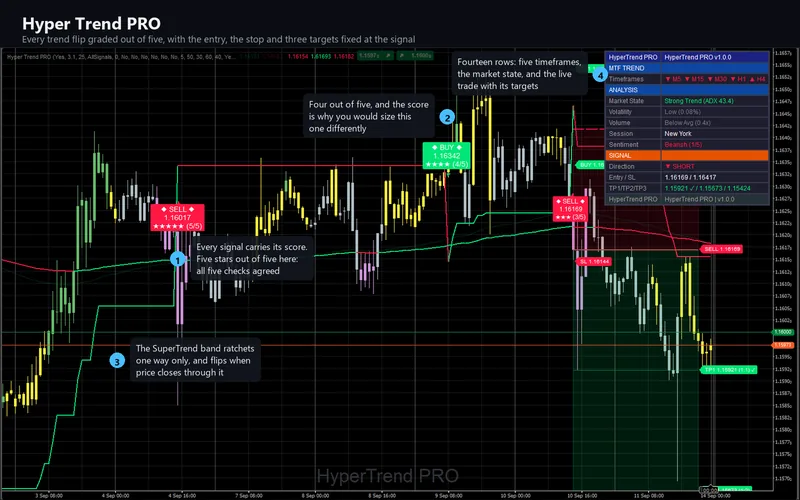
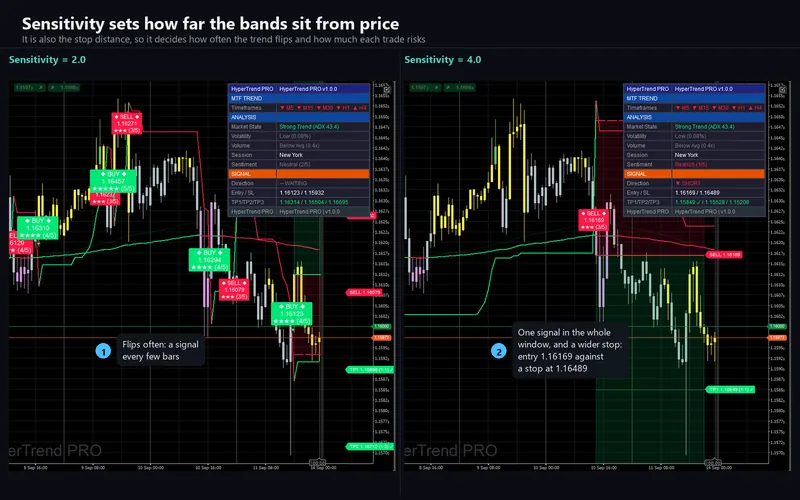
A SuperTrend marks the trend: bands sit a multiple of a 25-bar ATR above and below price, each band ratchets one way only, and the trend flips when price closes through the band on the far side. Every signal begins as one of those flips, and nothing else creates one.
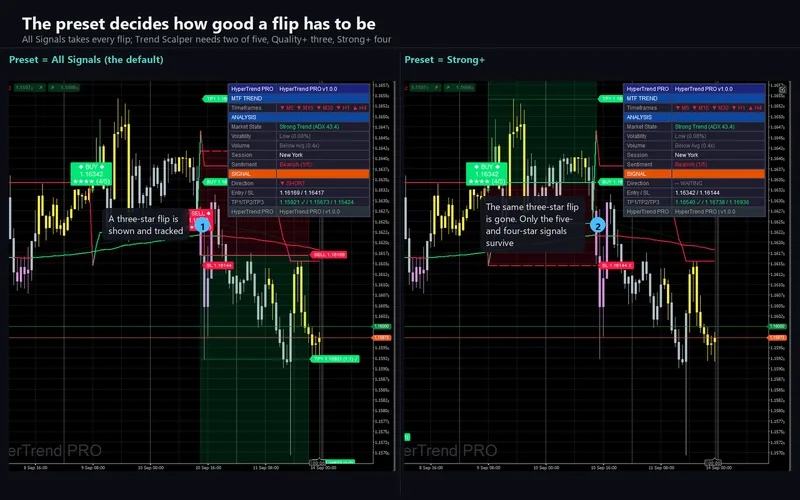
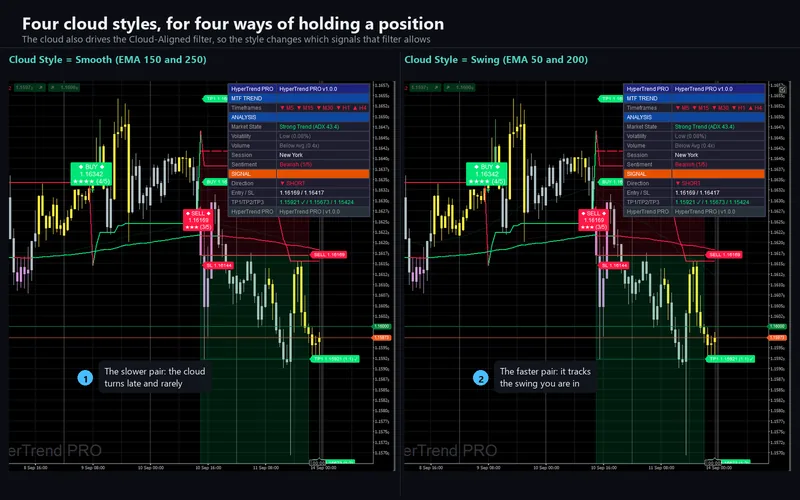
What makes it more than a SuperTrend is what happens next. The flip is graded out of five by five independent checks: the MACD histogram direction, the 150-period EMA against the 250, ADX above 20, volume against its own 20-bar average, and the slope of a 55-period Hull average. The score is drawn on the signal as stars and named on the alert as Weak, Moderate or Strong. A preset then decides how high that score has to be before the signal is shown at all, and six further filters can each veto it on their own.
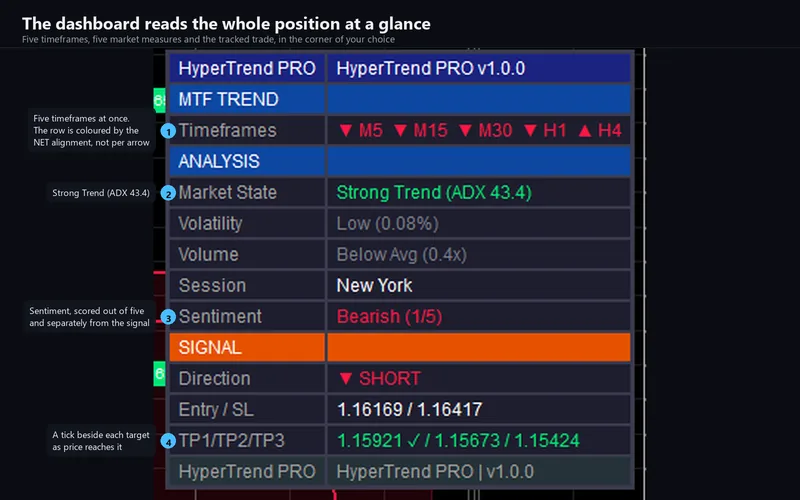
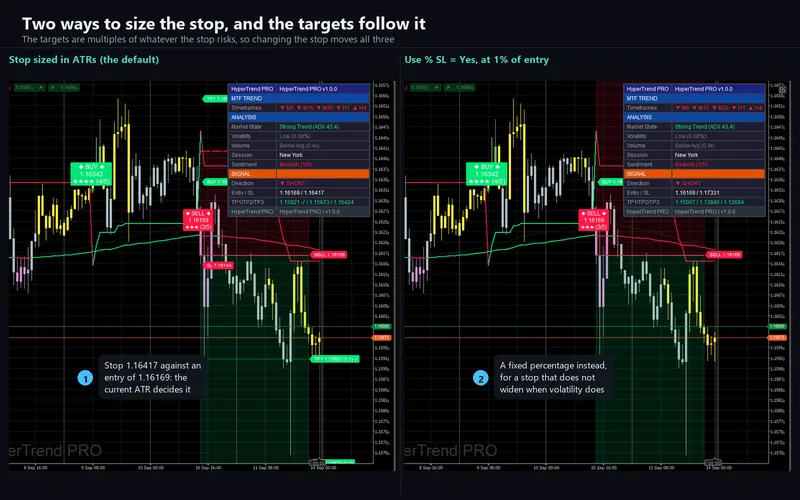
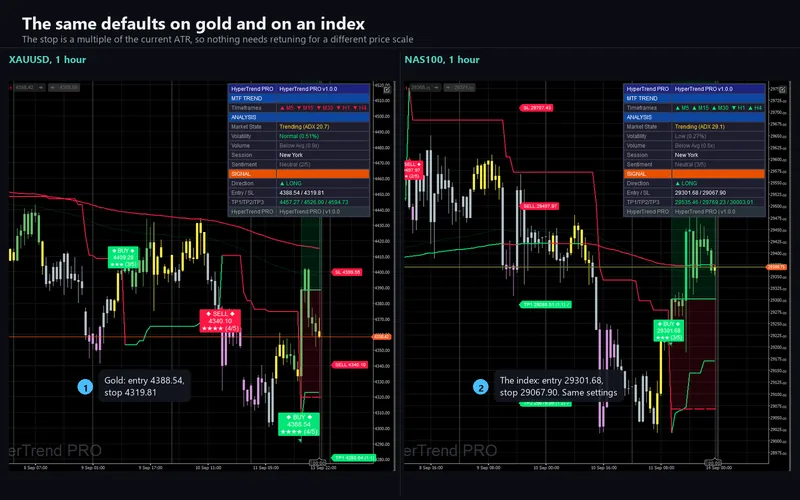
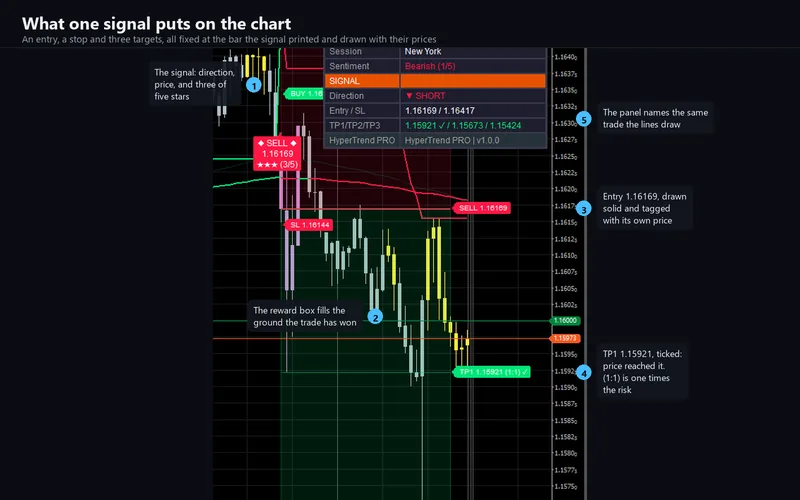
At the moment a signal prints, an entry, a stop and three targets are fixed and drawn as labelled lines. The stop is a multiple of the current ATR, so the same settings behave sensibly on a five-minute chart and on a daily one; the targets are multiples of that same risk. Each is ticked as price reaches it.
The candles are tinted by momentum on a six-step gradient. A Candle Coloring setting, added in 1.1.0 after a buyer asked for it, switches them to the trend colours, shades them by the confluence score, or leaves them alone so another indicator on the same chart can colour them instead. The default is the gradient, so the default chart is still the original's.
The signal itself is drawn as a plate carrying its direction, its price and its score, sized by that score. Four settings added in 1.2.0 control it after a buyer found it covering his candles: the marker can be a plate or a single character, its size can be fixed, it can be faded, and it can be pushed off the bar. As with the candle colouring, the defaults are the original's.
What repaints, and what does not
Signals do not. They are evaluated on closed bars only, so a marker never appears during a candle and then disappears when it closes. The cost is a one-bar delay and it is deliberate.
Drawings do move, and that is a different thing: while a trade is open, its level lines and their price tags extend to the right as the chart advances. The levels themselves are fixed at the signal bar and never change.
How the port was verified
The engine is platform-free C#: it references no cTrader type at all, which means the same code that ships can be compiled outside the platform and replayed against a bar series. That is what makes the comparison evidence about the shipped indicator rather than about a second implementation written to agree with it.
A probe was derived from the original mechanically, plotting every internal series to the data window. TradingView's chart model was read directly over the debugging protocol - every bar, every probe series, and every drawn label, line and table cell. The same bars were then replayed through the engine and compared cell by cell, and object by object.
Four probe generations covered the trend engine, the confluence scoring, the contrarian and pullback oscillators, all four cloud styles, the whole trade state machine and the visual layer. Twenty-six input sweeps then moved one setting at a time on both sides, because a great deal of this design is dormant at its defaults: the pullback engine is off, the trailing stop is off, market structure is off, six of the seven filters are off, and three of the four cloud styles are unreachable. At the defaults every one of those branches agrees perfectly by agreeing about nothing.
Four more runs compared what was actually drawn: every line, plate, box and table cell, field by field - anchors, colours, line styles, widths, text and size classes. A value comparison proves the numbers and is blind to everything a rendering decision can get wrong.
Across all thirty-four runs: zero mismatches.
Four things the comparison found
None of them was in any documentation, and two are invisible in any comparison of values.
TradingView's float tolerance reaches inside its own indicators. The directional movement test inside ADX compares two price moves, and on a five-decimal currency pair a one-tick up move and a one-tick down move are unequal as floating-point numbers and equal to TradingView. Using an ordinary comparison put 4,229 of 20,127 +DI values wrong by up to 3.84 and more than half the ADX series with them - which then changed a confluence factor, both scores, and every signal that depended on them.
The exponential average is not computed the way the manual prints it. The documented form and the implemented form are algebraically identical and round differently. That is invisible almost everywhere and decisive in one place: the pullback oscillator divides one difference of near-equal numbers by another, and switching to the implemented form took its main series from a near-miss to bit-exact.
The original keeps two trades' level lines on the chart, not one. Its clearing routine is only called on signal bars, and a reference to "the previous value" inside such a routine means the previous call, not the previous bar - so what it deletes is the set from two signals ago. A port that clears on every signal draws five lines where the original draws ten, and looks entirely sensible doing it.
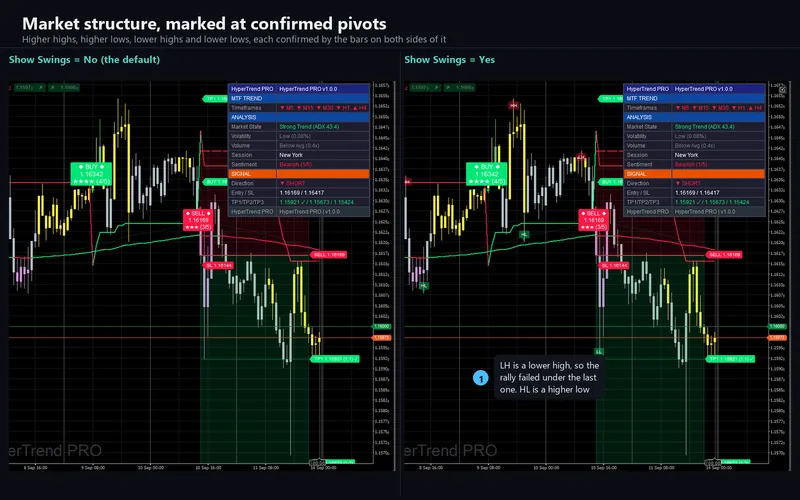
Labels share one pool. When it overflows, the oldest label is destroyed whatever kind it is - a market-structure label, a signal plate or a price tag. Capping each kind separately keeps far too many of one and too few of another, and again the chart looks reasonable either way.
The one thing that is deliberately different
The original prints a name and a web address on the chart in three places: a large watermark and two dashboard cells. Any URL or handle inside a chart visual is against the cTrader Store's rules, so the cTrader edition prints the product name there instead. No other string differs, and no other row in the visual comparison is marked as anything but identical.
There is a second, subtler difference, and it is worth explaining because it is a correction rather than a compromise. The original writes its symbols - the diamonds either side of BUY, the confluence stars, the ticks on reached targets - using an escape sequence that Pine Script does not interpret. What it actually prints on the chart is the escape text itself. The cTrader edition draws the symbols the original meant, and carries a setting that reproduces the original's own text character for character for anyone who wants the two charts to match exactly.
Requirements
cTrader 5.x on Windows. Bars and volume: no tick data, no depth of market, no external data. It declares no access rights at all - no network, no file access, and no ability to place, modify or close an order. Its longest average is 250 bars, so it wants a chart with some history behind it.
Support
Through the Discussion tab of the Store listing, or the contact page here. Include the symbol, the timeframe, your broker, your cTrader version and a screenshot with the dashboard visible - the dashboard shows the trend state, the scores and the tracked trade, which between them explain most of what looks like a missing signal.
This is analytical software, not investment advice. It never places, modifies or closes an order, and it is built with no trading permissions at all. Signals are evaluated on closed bars, which costs a one-bar delay and is why a marker never appears and then disappears. The ticks beside a target record that price touched a drawn level on loaded history, with no spread, commission or slippage in them. On a forex symbol, volume is the tick count your broker reports. Trading involves risk. Past performance does not guarantee future results.