Kumo Forge Pro for cTrader: the original, ported and verified bar by bar
An Ichimoku cloud drawn from fixed periods says the same thing in a fast market and a dead one. This one does not: in Adaptive mode all three periods are scaled by measured volatility, so the cloud tightens when the market moves and widens when it stops. On top of that, nine independent checks vote on every setup - where price sits against the cloud, the two lines, the Chikou span, the cloud's direction and thickness, volume, momentum, acceleration, and optionally RSI - and one input decides how high that total has to be before anything is drawn at all. When a signal does print, an entry, a stop and three targets are fixed and drawn with their prices. The cTrader edition is a C# transcription checked against the original, bar by bar and object by object, on the same bars.
cTrader 5.x · C# on the cAlgo API · 75 parameters: the 51 of the original plus 24 cTrader-only · AccessRights = None · sold on the cTrader Store, EURUSD trial
ICMARKETS EURUSD M5, 20,090 bars compared of the 20,141 the feed served. Eight probe generations compared every internal series bar by bar; 15 input sweeps moved one setting at a time on both sides, because four of this design's inputs are off by default; and a further run compared every drawn line, plate, box and table cell field by field. The three higher-timeframe series were dumped as real bars in the same session rather than aggregated. Zero was the acceptance bar for everything the indicator uses, and it was set before any C# was written.
The Kumo Forge Pro gallery, picture by picture
The 10 pictures of the cTrader Store gallery. Select any picture to open it full size.
What it does
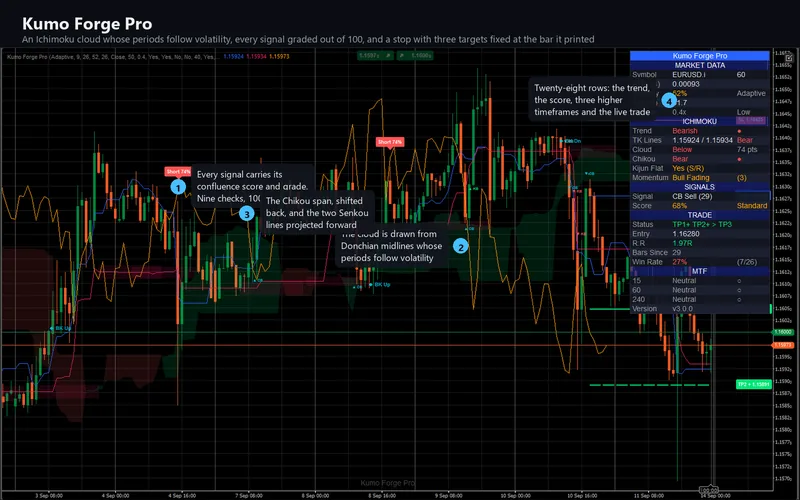
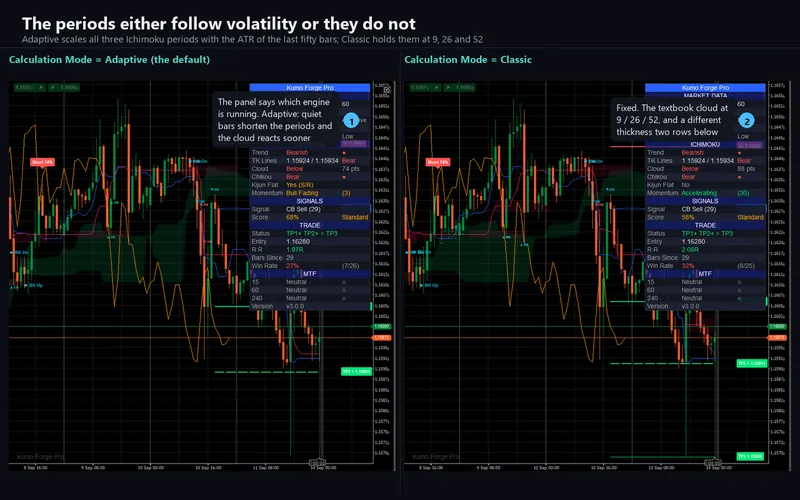
It draws a complete Ichimoku picture - Tenkan-Sen, Kijun-Sen, the Kumo cloud and the Chikou span - with one change to the textbook version. In Adaptive mode the three periods are not fixed: each one is scaled by how volatile the last fifty bars have been, so the cloud tightens in a fast market and widens in a quiet one. Classic mode holds them at 9, 26 and 52 for anyone who wants the original behaviour.
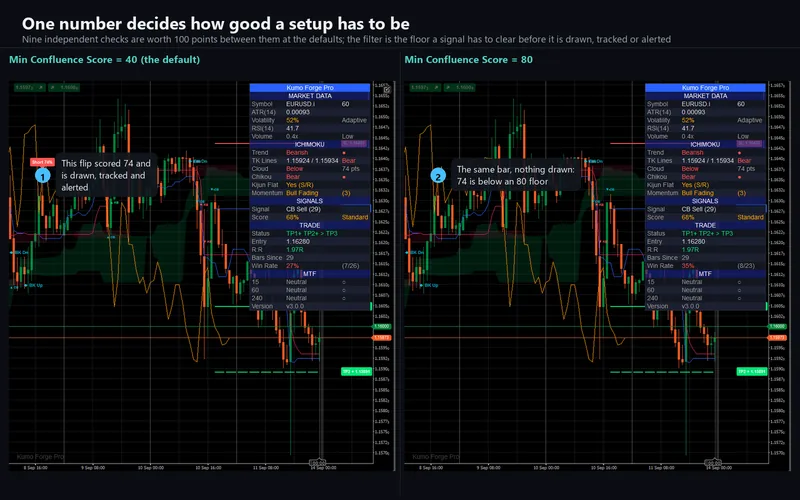
What makes it more than an Ichimoku overlay is what happens at a signal. Nine independent checks vote on every setup and the total is drawn on the plate: where price sits against the cloud (20 points), the two lines aligned (15), the Chikou span agreeing (15), the cloud's own direction (10), its thickness (8), volume against its average (10), momentum (12), momentum accelerating (10), and optionally RSI (10). A single input - Min Confluence Score, 40 by default - is the floor a setup has to clear before it is drawn, tracked or alerted at all.
Two of the nine ignore direction. A thin cloud on thin volume therefore drags the bullish and the bearish score down together and nothing fires either way, which is the design saying there is nothing there rather than picking a side.
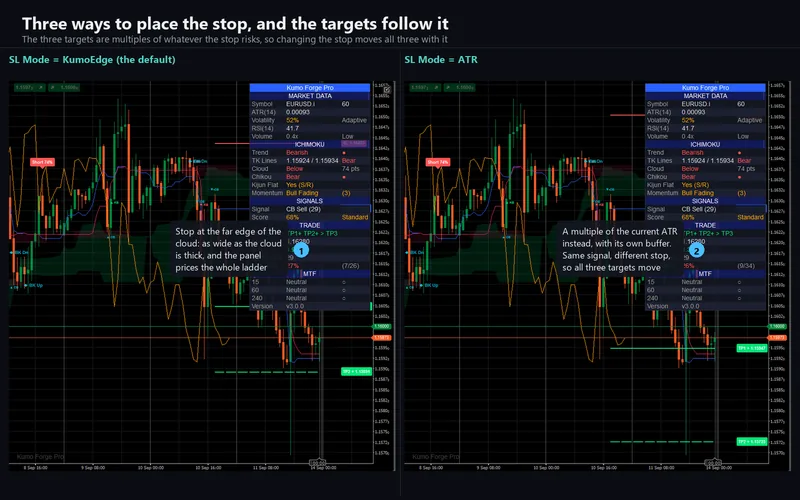
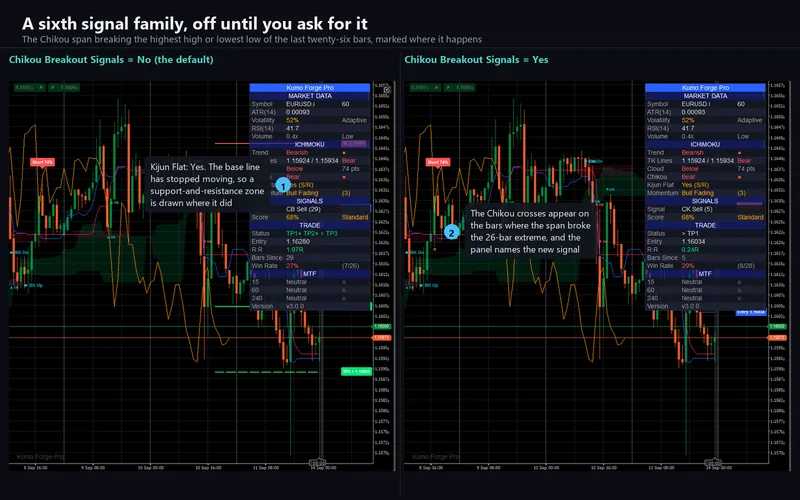
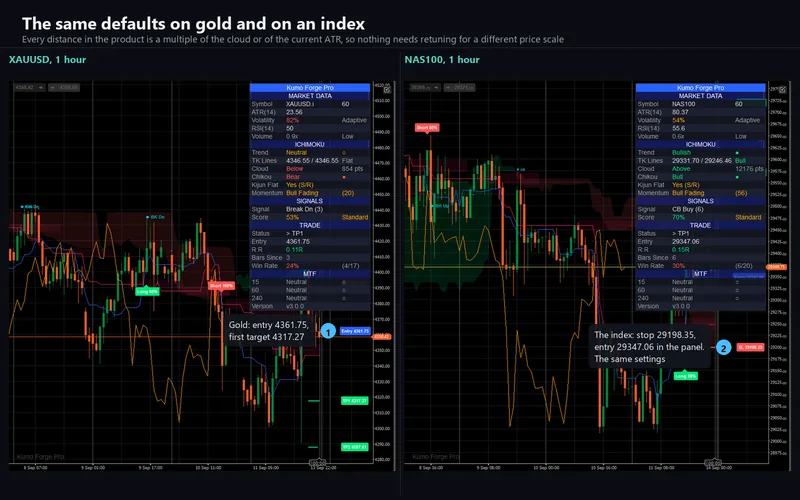
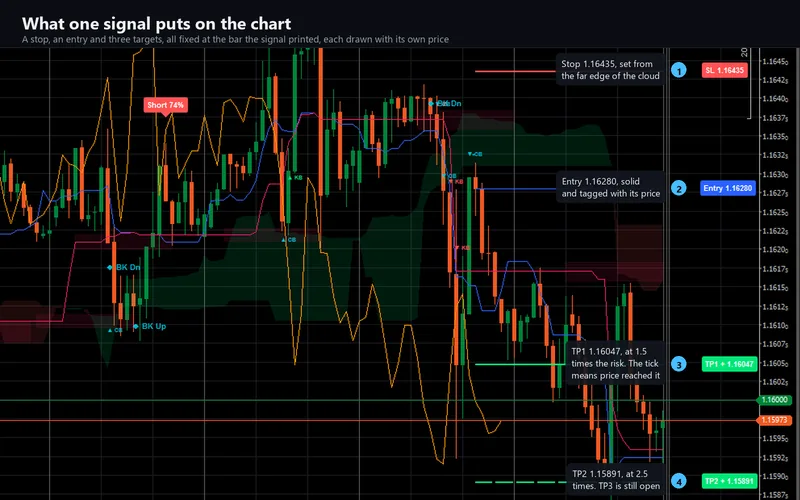
Six signal families feed it: the Tenkan/Kijun cross, a Kijun bounce, a cloud-edge bounce, a Kumo breakout with a volume requirement, the retest of a broken cloud edge, and a Chikou breakout that is off until you ask for it. At the moment a signal prints, an entry, a stop and three targets are fixed and drawn as labelled lines, each carrying its own price. The stop comes from the far cloud edge, the Kijun line or a straight ATR multiple, and the three targets are risk multiples of whichever you chose.
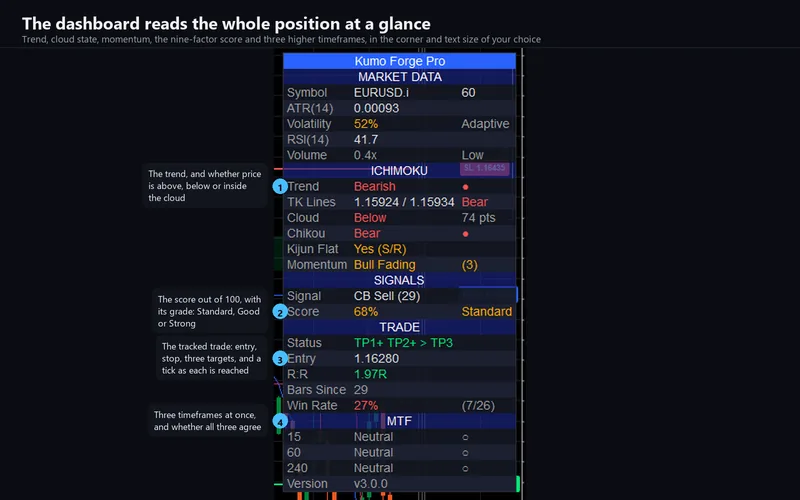
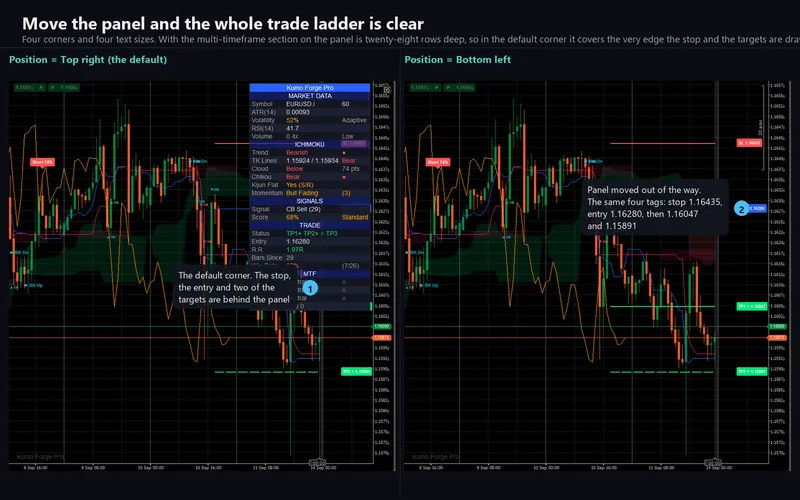
Above it all, a panel of up to twenty-eight rows: the market data, the Ichimoku state, the current signal and its grade, the tracked trade with its live risk-to-reward, and three higher timeframes reporting bullish, bearish or neutral from the same test.
What repaints, and what does not
Signals do not. They are evaluated on closed bars only, so a marker never appears during a candle and then disappears when it closes. The cost is a one-bar delay and it is deliberate.
Two things do move, and both are stated rather than buried. The five trade lines are deleted and redrawn on every bar so they keep reaching the right-hand edge; their prices are fixed at the signal bar and never change. And a higher-timeframe row in the panel reads that timeframe's developing bar until it closes - up to forty-seven five-minute bars for the four-hour row. That is how the data source behaves, not a shortcut, and the original's own comment describing the pattern as non-repainting is true of history and not of the live bar.
How the port was verified
The engine is platform-free C#: it references no cTrader type at all, so the same code that ships can be compiled outside the platform and replayed against a bar series. That is what makes the comparison evidence about the shipped indicator rather than about a second implementation written to agree with it.
A probe was derived from the original mechanically, plotting every internal series to the data window. TradingView's chart model was read directly over the debugging protocol - every bar, every probe series, and every drawn label, line and table cell. The same bars were then replayed through the engine and compared cell by cell.
Eight probe generations covered the adaptive period engine, the cloud geometry, all nine score factors separately, the six signal families and their eight gates, the trade state machine, the multi-timeframe subsystem and the panel's own arithmetic. Fifteen input sweeps then moved one setting at a time on both sides, because four of this design's inputs are off by default: without the sweeps the ninth score factor, the whole Chikou-breakout family and the trend background would agree perfectly by agreeing about nothing.
The three higher-timeframe series were not aggregated from the chart's bars. Real fifteen-minute, one-hour and four-hour bars were dumped in the same session, because four-hour bars do not tile the calendar evenly and an assumed offset is how a previous port earned four thousand mismatches in a single column.
15,026,434 cell comparisons over 20,090 identical bars, and every series the indicator computes, draws or alerts on is at zero.
Ninety-four cells did differ, all in one generation, and all in diagnostic columns that exist only so that a failure could name its own cause - a session-calendar difference in how the data source truncates the last bar of a session. They are reported rather than absorbed, because a total that quietly includes something real is worse than a total with an explanation attached.
Four things the comparison found
None of them is in any documentation, and two are invisible to any comparison of values.
The built-in cross functions compare exactly. The scripting language applies a small tolerance to comparisons you write yourself, and it does not apply it inside ta.crossover. Three bars in the sample had the two lines one unit in the last decimal place apart: the built-in fired, a tolerant engine did not, and then fired a bar late. On those same three bars the hand-written comparison two lines above was false on both sides, which is what turned a plausible theory into a measurement.
One cross machine per call site. Sharing one between a crossover and a crossunder makes the second read the pair the first has just stored as "previous", so the crossunder can never fire at all. Every sell signal in the product would have been missing, and no test of a rising market would have noticed.
A label plate and a table cell are not the same size. At the same nominal size class the label's digits render nine pixels tall and the table cell's ten. One font ladder cannot serve both; tuned until the panel matched, it left every signal plate about thirty per cent too large. The port carries two ladders, measured off the rendered pixels of both.
Turning the multi-timeframe panel off breaks the original. It writes a table cell one row past the end of its own table, which is a runtime error, and a runtime error does not drop the offending cell - it returns an empty series for every plot in the script. In that configuration the original draws nothing at all: no cloud, no lines, no signals, no panel. This edition draws the twenty-two-row panel correctly instead. It is the one place where this edition is better rather than equal, and it is written down as such.
The things that are deliberately different
Four, each a platform absence rather than an approximation, and all four are in the package's deviations document with what was measured.
Chart labels in cTrader have no hover text, so the content the original puts in a tooltip is surfaced in the alert body and the panel. There is no cross icon in the platform's set, so that one marker is drawn as a glyph. cTrader shows no right-hand margin unless Chart Shift is enabled, so the five price tags pin just inside the right edge rather than floating past the last bar. And the platform's alert channels are a log line, a sound and an e-mail - there is no pop-up, and a Store build opens no network connection, so the JSON webhook body is produced into the log line and the e-mail instead of being posted anywhere.
Requirements
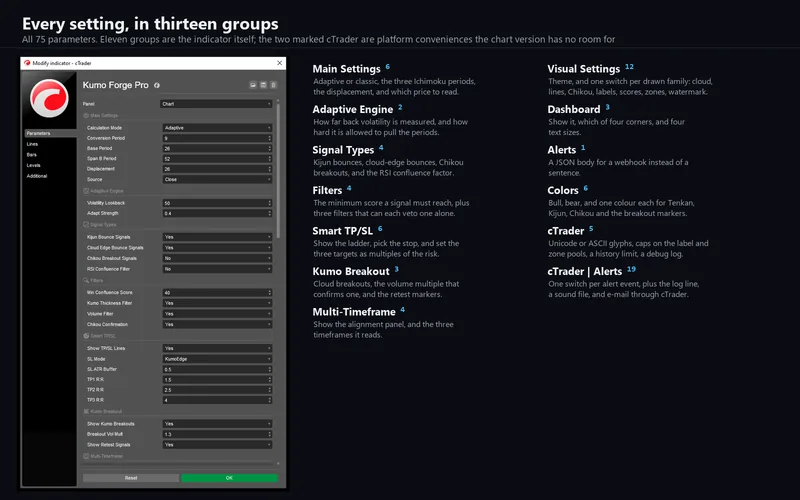
cTrader Desktop 5.x on Windows or Mac. It reads bars and tick volume only and declares no access rights at all, which you can check in the algorithm's own details. Seventy-five parameters: the fifty-one of the original, reproduced with the same titles, defaults, ranges and order, plus twenty-four cTrader-only ones for the alert channels, the object caps and a debug log.
Support
Through the Discussion tab of the Store listing, so the conversation stays next to the product. Please include your broker, symbol, timeframe, cTrader version and a screenshot of the whole chart including the panel.
This is analytical software, not investment advice. It never places, modifies or closes an order, and it is built with no trading permissions at all. Signals are evaluated on closed bars, which costs a one-bar delay and is why a marker never appears and then disappears. The ticks beside a target record that price touched a drawn level on loaded history, with no spread, commission or slippage in them. On a forex symbol, volume is the tick count your broker reports. Trading involves risk. Past performance does not guarantee future results.