Momentum Tidebreaker for cTrader: the original, ported and verified bar by bar
Most signal indicators give you an arrow and leave the rest to you. This one raises signals from three independent families - an EMA trend cross confirmed by RSI, trend strength and momentum, RSI reclaiming 50 in the direction of the trend, and a momentum divergence at an RSI extreme - and then draws the entry, an ATR stop and two targets for every one of them and follows the trade to its outcome on a sixteen-row panel. The cTrader edition is a C# transcription checked against the original, bar by bar and object by object, on the same bars.
cTrader 5.x · C# on the cAlgo API · 39 parameters: the 22 of the original plus 17 cTrader-only · AccessRights = None · sold on the cTrader Store, EURUSD trial
ICMARKETS EURUSD M5, 20,140 bars. Five probe generations compared every internal series bar by bar; fourteen input sweeps moved one setting at a time on both sides, including the two that reach the divergence and STRONG signals the defaults never fire on this data; a further run compared every drawn line, price tag and panel cell field by field, and the colour of both lines and the fill on every bar. A second symbol, gold, was compared the same way. Zero was the acceptance bar, set before any C# was written.
The Momentum Tidebreaker gallery, picture by picture
The 10 pictures of the cTrader Store gallery. Select any picture to open it full size.



What it does
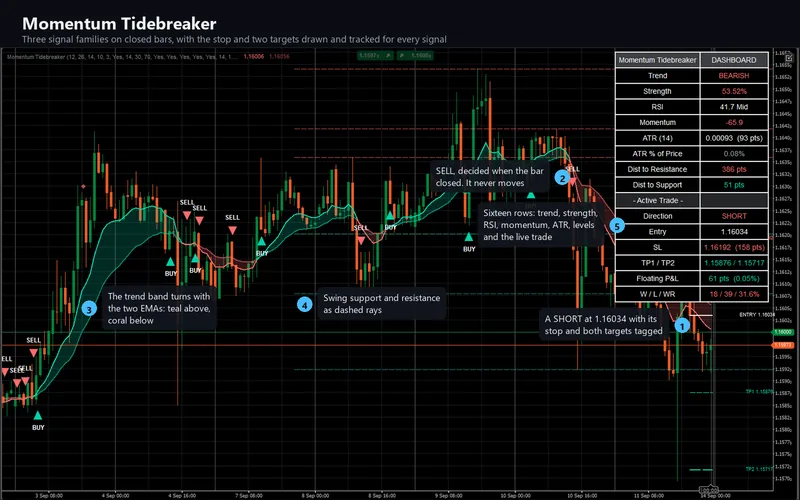
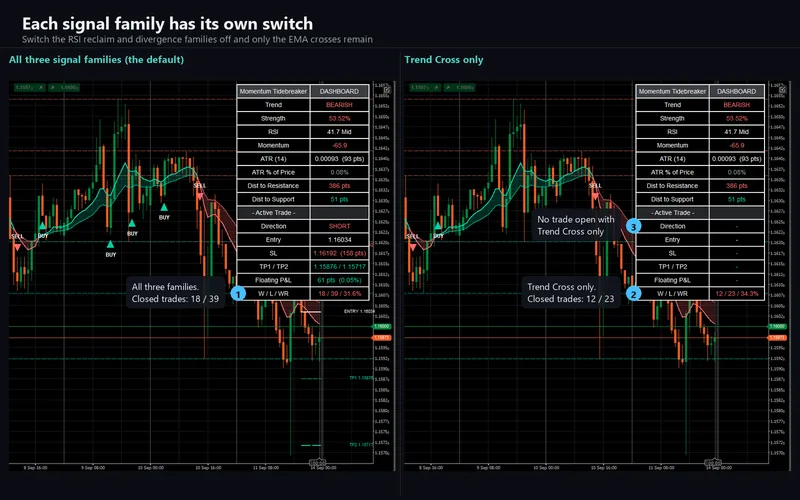
It draws a fast and a slow exponential moving average with a translucent band between them that takes the bullish or the bearish colour depending on which line is on top. On that picture it raises signals from three independent families, each of which can be switched off on its own.
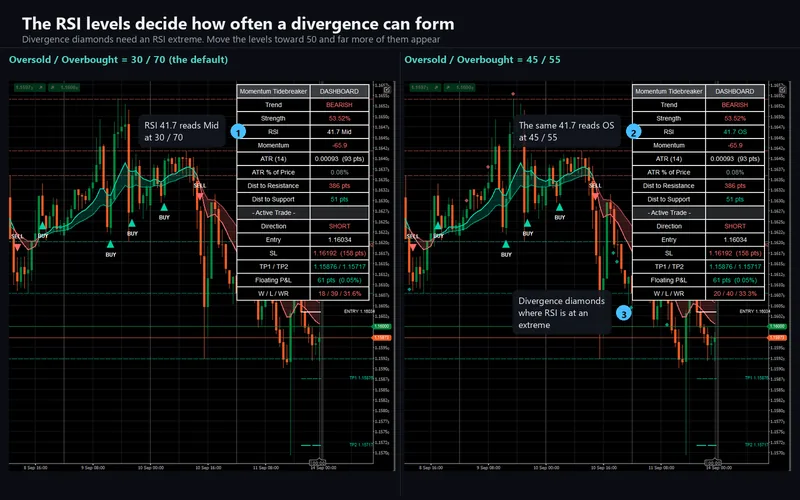
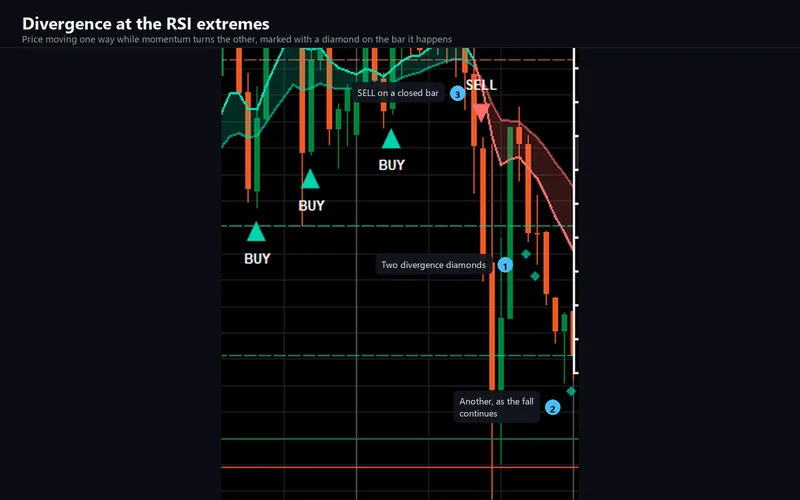
The trend cross fires when the fast average crosses the slow one, but only with RSI on the right side of 50, the gap between the averages worth more than one per cent of recent volatility, and - optionally - five-bar momentum pointing the same way. The RSI reclaim fires when RSI crosses 50 in the direction the averages already point and price holds the right side of the slow line. The divergence fires when price keeps falling while momentum turns up at an oversold RSI, or the mirror at overbought, and the close is back across the fast average. A signal that is also a divergence is marked STRONG, and every divergence bar gets a small diamond whether or not the family is enabled.
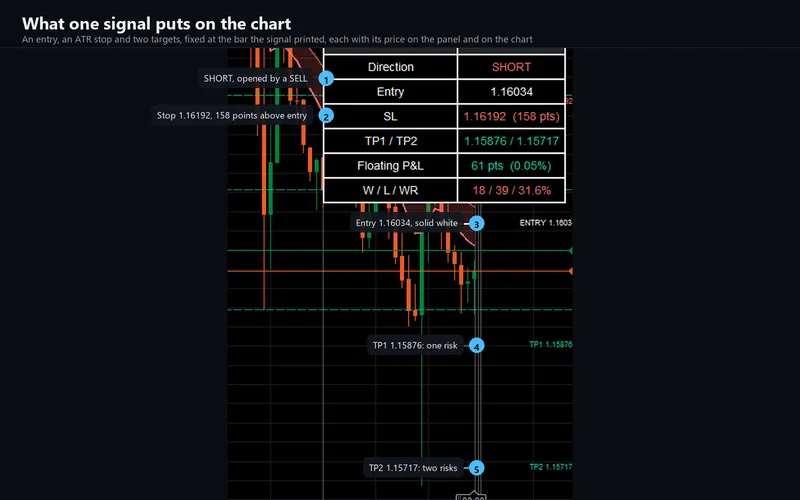
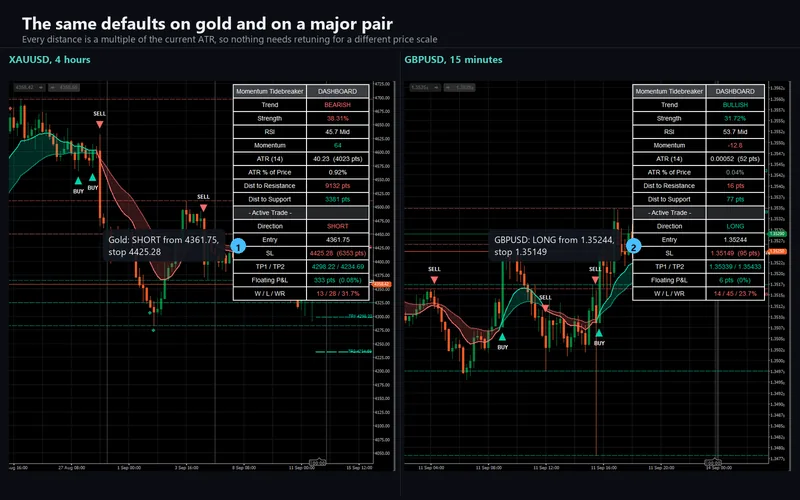
Every signal draws its trade: an entry line, a stop a chosen number of ATRs away, a first target one risk away and a second at the ratio you set, each tagged with its price. On each following bar the levels are checked in a fixed order - the second target, then the first, then the stop - and the panel in the corner tracks the open trade, its floating result, and a count of trades that reached the second target against those that reached the stop. The same panel shows trend, trend strength, RSI and its zone, momentum, the ATR in price, ticks and percent, and the distance to the nearest swing high and low, which are also drawn as dashed levels.
What repaints, and what does not
Signals do not. Every signal and every marker is decided when its bar closes and never moves afterwards, and the trade lines are drawn once, on the signal bar. Two things do update while a bar forms, and both are by design: the panel, and the support and resistance levels, which are redrawn from the newest confirmed swings. A swing is only confirmed once enough bars have formed on its right, so a level appears that many bars after the swing itself.
How the port was verified
The engine is platform-free C#: it references no cTrader type at all, so the same code that ships can be compiled outside the platform and replayed against a bar series. That is what makes the comparison evidence about the shipped indicator rather than about a second implementation written to agree with it.
A probe was derived from the original mechanically, plotting every internal series to the data window, and TradingView's chart model was read directly over the debugging protocol - every bar, every probe series, and every drawn line, label and table cell. The same bars were replayed through the engine and compared cell by cell: five probe generations covering the averages, the oscillators and the four crossings, the swing levels slot by slot, every component of the three signal families, and the whole trade ladder with every number on the panel. Fourteen input sweeps then moved one setting at a time on both sides.
7,334,164 cell comparisons over 20,140 identical bars, and zero mismatches. The drawn output was compared as data too: every level, trade line, price tag and panel cell, and on every one of the 20,140 bars the colour of both averages and of the band. Zero differences there as well, and zero again on a second symbol, gold, whose two-decimal prices take a different formatting path from the euro's five.
What the comparison found
A built-in called inside a conditional keeps its own history. The momentum reading calls the five-bar change only when the ATR it divides by is defined. The first replay disagreed with the original on exactly five bars, and on nothing else in 1.6 million cells: the built-in returned nothing for its first five executions, even though five bars of price already existed. From the sixth execution on the two agree to the last digit. The compiler warns about that exact call site, and the engine now reproduces the rule rather than the textbook formula.
The strongest signal never fires at the default levels. A STRONG signal can only come from the divergence family - the other two buys need RSI above 50, which cannot be oversold at the same moment - and at the default 30 and 70 levels that combination did not occur once in 20,140 five-minute bars. So the default run could not prove it. Two sweeps moved the levels until it did: 86 and 72 STRONG signals on one, 88 and 90 on the other, with zero differences in every marker. A comparison that only ran the defaults would have reported a clean result about a signal it never saw.
The built-in crossings compare exactly. The scripting language applies a small tolerance to comparisons you write yourself and does not apply it inside its crossover functions. The engine reproduces both, so a touch one unit in the last decimal place fires on the same bar in both.
The things that are deliberately different
cTrader fixes the colour of a plotted line when the indicator is compiled, so the two averages and the band keep the default colours if you change the three colour inputs, while every marker, level, tag and panel cell follows them; the lines are recoloured in cTrader's own style tab instead. cTrader shows no right-hand margin unless Chart Shift is enabled, so the price tags pin just inside the right edge rather than floating past the last bar. And the platform's alert channels are a log line, a sound and an e-mail - there is no pop-up. All of it is in the package's deviations document.
Requirements
cTrader Desktop 5.x on Windows or Mac. It reads the chart's own bars only and declares no access rights at all, which you can check in the algorithm's own details. Thirty-nine parameters: the twenty-two of the original, reproduced with the same titles, defaults, ranges and order, plus seventeen cTrader-only ones for the alert channels, one switch per alert event, the marker glyphs and a debug log.
Support
Through the Discussion tab of the Store listing, so the conversation stays next to the product. Please include your broker, symbol, timeframe, cTrader version and a screenshot of the whole chart including the panel.
This is analytical software, not investment advice. It never places, modifies or closes an order, and it is built with no trading permissions at all. Signals are evaluated on closed bars, which costs a one-bar delay and is why a marker never appears and then disappears. The win and loss count records drawn levels touched on loaded history, with no spread, commission or slippage in them. Trading involves risk. Past performance does not guarantee future results.