Reverse RSI Phantom for cTrader: the original, ported and verified bar by bar
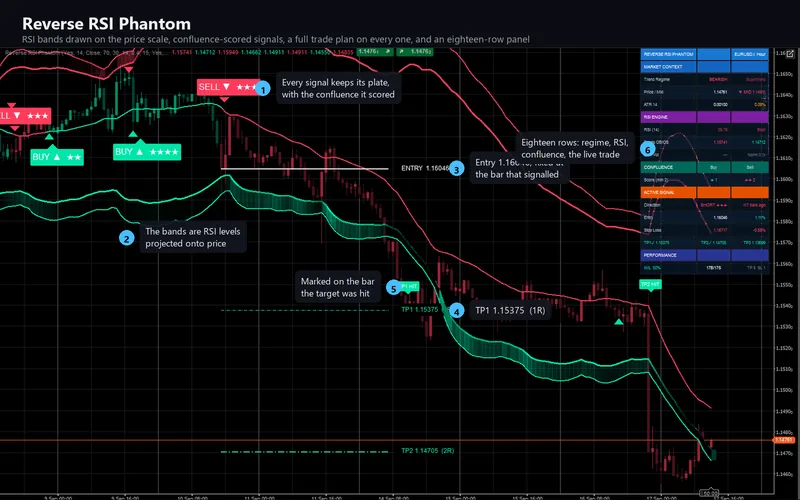
An RSI lives in a pane below the chart, and you read it against two horizontal lines. This one asks the question the other way round - what price would put the RSI at 70, and what price would put it at 30 - and draws those two prices on the chart as bands that move with every bar. On that picture it scores signals against five confluence layers, draws an entry, an ATR stop and three targets for each one, and follows the trade to its outcome on an eighteen-row panel. The cTrader edition is a C# transcription checked against the original, bar by bar and object by object, on the same bars.
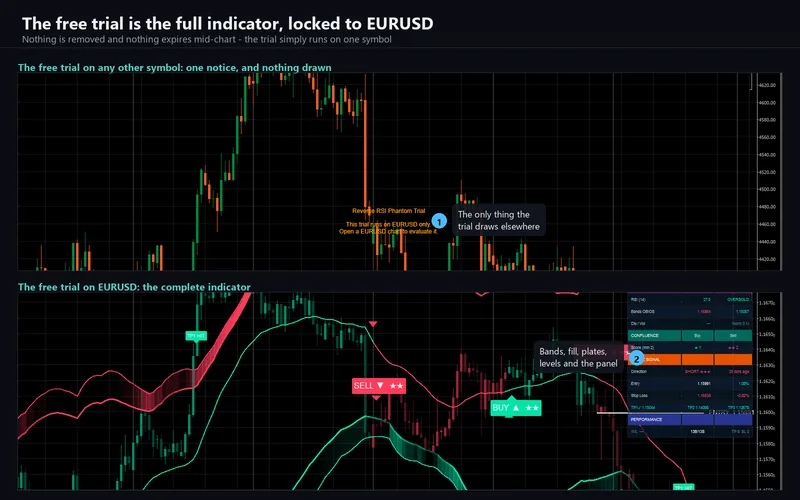
cTrader 5.x · C# on the cAlgo API · 74 parameters: the 41 of the original plus 33 cTrader-only · AccessRights = None, webhook included · sold on the cTrader Store, EURUSD trial
ICMARKETS EURUSD M5, 21,125 bars - the full depth this feed serves. Seven probe generations compared every internal series bar by bar; twenty-one input sweeps moved one setting at a time on both sides. A second symbol, gold, was compared the same way. Two further runs covered what a value comparison cannot see: the colour of both gradient fills and of every candle, on every bar, and every drawn object field by field - the fifty-four panel cells, the five trade lines, the five price tags and 495 signal plates, including the six-line tooltip each one carries. Zero was the acceptance bar, set before any C# was written.
The Reverse RSI Phantom gallery, picture by picture
The 10 pictures of the cTrader Store gallery. Select any picture to open it full size.
What it does
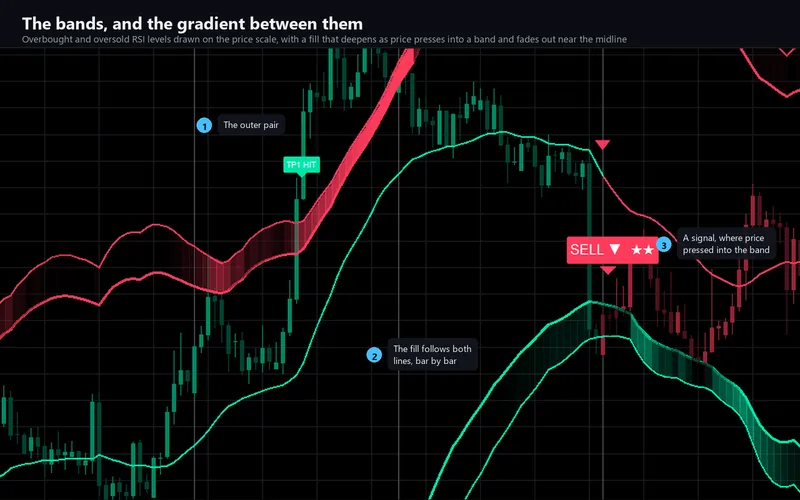
The RSI is normally drawn in a pane of its own, below the chart, and you read it against a pair of horizontal lines at 70 and 30. This indicator asks the question the other way round: what price would put the RSI exactly at 70, and what price would put it at 30? It solves the formula backwards for those two prices and draws them on the chart, where they move with every bar. The oscillator ends up on the price scale, beside the candles and beside your own levels.
Each band has an outer edge as well, and the space between the pair is filled with a gradient that deepens as price presses into it and fades out completely near the midline, so the chart shows you where the pressure is without a number. A supertrend built on that midline sets the trend regime, colours the midline, and tints the candles.
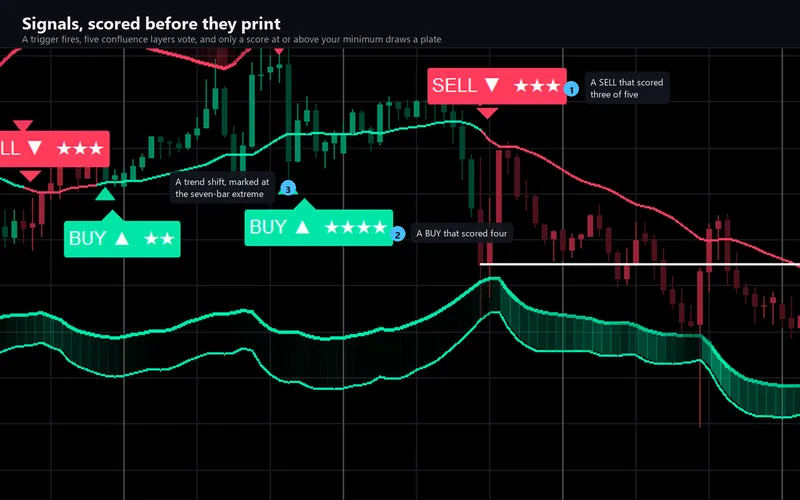
On that picture it raises signals. A trigger fires - the regime turns, price crosses a band, or an RSI divergence confirms - and then five confluence layers vote: the regime, an RSI confirmation, a band retest, the divergence itself, and a volume check. The score runs 0 to 5, it is printed as stars on the plate the signal draws, and it has to reach a minimum you set before anything appears. A trend gate and a per-direction cooldown filter what is left, and when both sides qualify on the same bar the higher score takes it - with equal scores going to the buy.
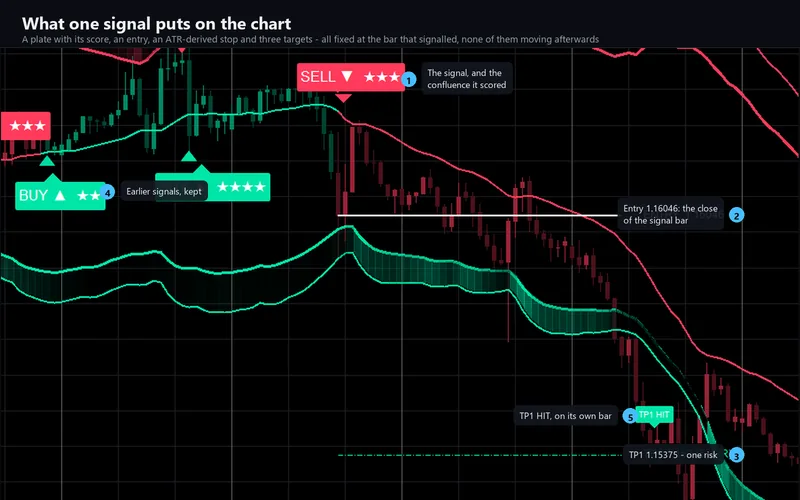
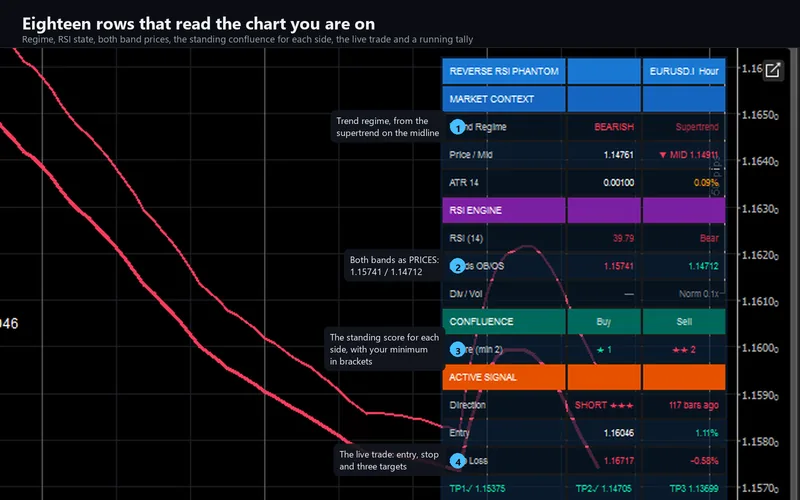
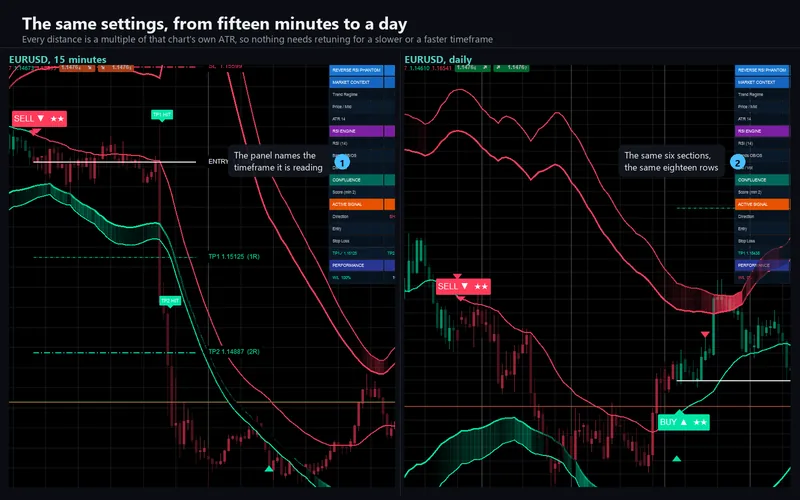
Every signal draws its whole plan on the bar that produced it: the entry, a stop derived from ATR, and three targets at risk multiples you choose, as five lines with five price tags. Later bars are tested against those levels, and the bar that reaches each target, or touches the stop, gets a plate of its own. An eighteen-row panel summarises the chart - regime, price against the midline, ATR in price and percent, RSI and its state, both bands as prices, divergence, volume, the standing confluence for each side, the live trade, and a tally of what the loaded history did.
What repaints, and what does not
Signals do not, at the default setting. Non-Repaint Mode judges a bar only once it has closed, so a plate that prints never moves and never disappears, and its alert arrives once. The original also offers the other mode, where bars are judged while they form and a signal can appear and vanish before the close; that is reproduced faithfully and documented as what it is.
The bands themselves move with every bar, as an oscillator does - that is the point of them. The levels a signal drew are fixed at its bar and never move, which is why they sit back in history rather than at the right edge.
How the port was verified
The engine is platform-free C#: it references no cTrader type at all, so the same code that ships can be compiled outside the platform and replayed against a bar series. That is what makes the comparison evidence about the shipped indicator rather than about a second implementation written to agree with it. The drawing is in there too - the panel, the plates, the lines and the tags are all built by the engine, because anything the host alone could build would sit outside every gate the project has.
A probe was derived from the original mechanically, plotting every internal series to the data window, and TradingView's chart model was read directly over the debugging protocol. Seven probe generations covered the RSI engine and both bands, the supertrend, the gradient inputs and their transparencies, the divergence detector, the confluence layers, the signals, the trade ladder and every counter on the panel. Twenty-one input sweeps then moved one setting at a time on both sides.
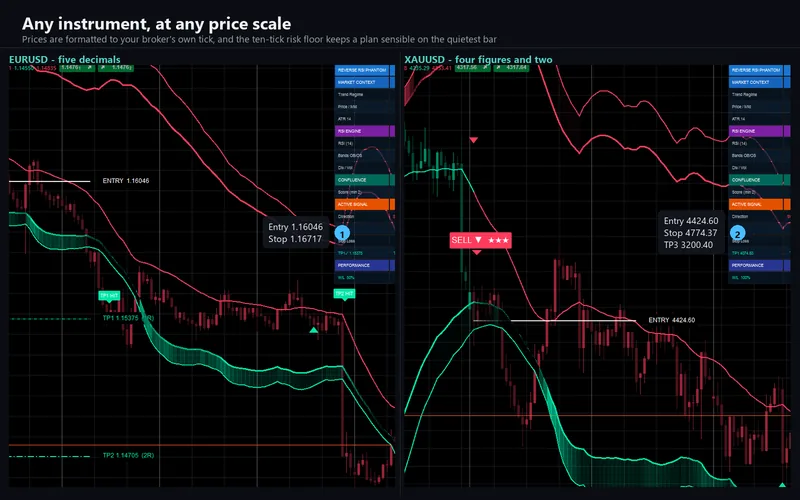
10,649,047 cell comparisons over 21,125 identical bars, and zero mismatches in the product's own output. A second symbol, gold, was compared the same way - 543,312 cells, zero - because its two-decimal prices take a different formatting path from the euro's five, and because the ten-tick risk floor depends on the instrument.
Two things a value comparison cannot see were compared separately. The colours were read from TradingView's own colorer slots and compared per bar: both gradient fills and the candle body, wick and border, 105,625 comparisons, zero differences. And the drawn objects were compared field by field against the chart model - the fifty-four panel cells, the five trade lines, the five price tags and four hundred and ninety-five accumulating plates, including the six-line tooltip the original attaches to each signal - 3,784 field comparisons, zero differences.
What the comparison found
Two smoothing built-ins that look identical are not. The first replay was not at zero. The running average the RSI is built on uses Wilder's form - the previous value weighted by the length less one - while the exponential average beside it uses the incremental form. They agree to nineteen decimal places and that was enough to flip a pivot comparison: 1,652 cells. Measured bit-exact on 21,111 bars and corrected.
A boolean OR short-circuits around a built-in. Two of the triggers are crossings behind an or. When the left side is true the crossing on the right is never evaluated, and a built-in that is not evaluated does not advance its own history. The compiler warns about it; the port reproduces it.
A gradient truncates where you would round. Each channel of the colour blend is truncated, not rounded, and the transparency-to-alpha conversion is floating-point dependent, so 90 % transparent and 70 % transparent do not land where a clean formula puts them. An undefined transparency renders fully transparent, not fully opaque.
A chart is not a spreadsheet. With ten and a half million matching cells behind it, the first attach to a real chart found seven things, four of them defects: the two pixel-space layers never repainted on a zoom or a scroll, so the band fill detached from the lines it belongs between until the next tick; not one signal plate, hit plate or marker was ever drawn, because the code that builds them sat where no gate could reach it; every label's pointer tail pointed away from the price it names; and every marker triangle was upside down. All four are fixed and re-checked on a chart.
The things that are deliberately different
cTrader builds a drop-down from names in the code, and a name cannot contain a space, a plus sign, an arrow or an emoji - so three settings whose choices carry those characters read as AtrPlusBand rather than ATR + Band. The choices, their order and their effect are the same, and the plate on the chart still prints the original's own text. Two ways of overriding the displayed text were tried on the real dialog and neither works on this build.
cTrader shows no right-hand margin unless Chart Shift is on, so the five price tags pin just inside the right edge instead of floating past the last bar, where they rendered clipped. The platform's alert channels are a log line, a sound and an e-mail - there is no pop-up - and chart labels carry no tooltip, though every number in the original's tooltip is already on the chart and in the panel. One setting is declared in the original and never used; it ships anyway, so the settings list matches one for one, and the documentation says it is inert.
There is exactly one difference in calculation, and it is unreachable at the shipped defaults. A non-default stop mode calls a lookback function from inside a conditional block, which the original's own compiler flags; what it returns there is internal state rather than a rule, and on four per cent of signals it returns zero, which makes the stop negative. The port computes what that call means when it is evaluated properly - the extreme of the last ten bars - so the stop is always a real price. All of it is in the package's deviations document.
Requirements
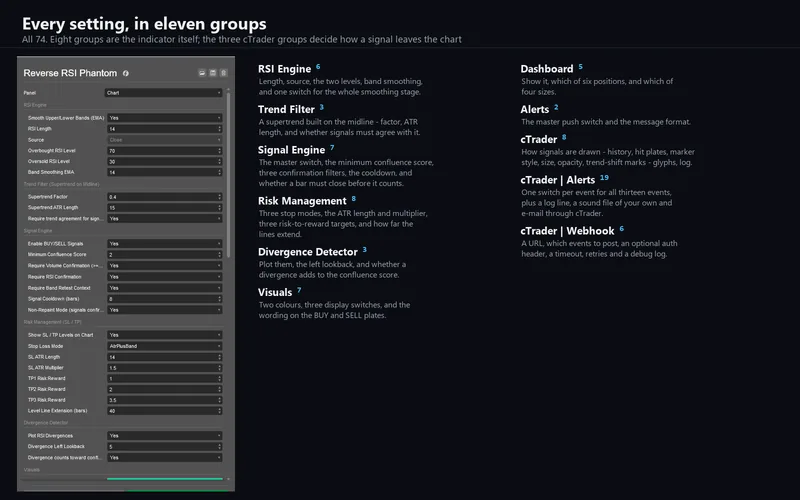
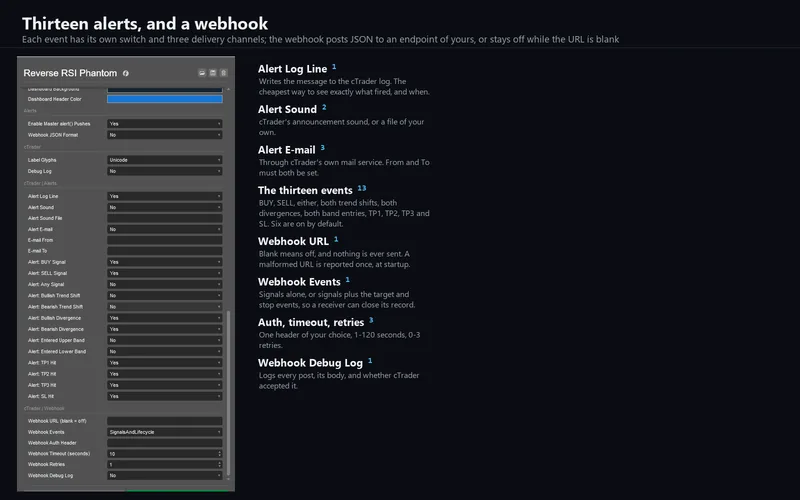
cTrader Desktop 5.x on Windows or Mac. It needs volume, because one of the five confluence layers reads it, and it declares no access rights at all - which you can check in the algorithm's own details. The webhook posts through cTrader's own HTTP service, which is why it needs none. Seventy-three parameters: the forty-one of the original, reproduced with the same titles, defaults, ranges and order, plus thirty-two cTrader-only ones for the alert channels, one switch per alert event, the webhook, the glyph set, a debug log, and the five signal display controls added in 1.1.0: how many signals to keep, whether the target and stop hit plates are drawn, the marker style, its size and its opacity. All five act only on what is drawn, never on the calculation.
Support
Through the Discussion tab of the Store listing, so the conversation stays next to the product. Please include your broker, symbol, timeframe, cTrader version and a screenshot of the whole chart including the panel.
This is analytical software, not investment advice. It never places, modifies or closes an order, and it is built with no trading permissions at all. At the default setting signals are evaluated on closed bars, which costs a one-bar delay and is why a plate never appears and then disappears. The win and loss count records drawn levels touched on loaded history, with no spread, commission or slippage in them. Trading involves risk. Past performance does not guarantee future results.