Rigid Volume Profile for cTrader: the original, ported and verified object by object
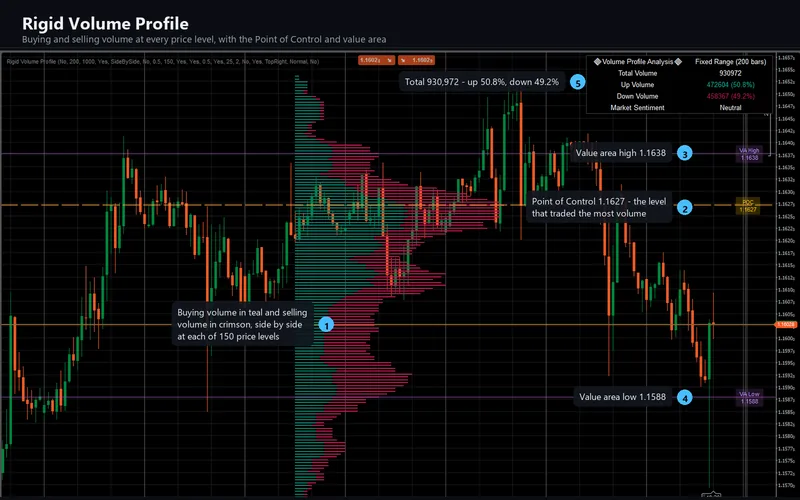
Most volume profiles draw one bar per price level and colour it by whichever side won. This one splits every level in two and draws both halves: the buying volume and the selling volume that traded at the same price, side by side, across a fixed grid of up to 400 levels. A level that absorbed heavy volume from both sides and one that absorbed the same total from a single side look identical on a single-bar profile, and they are not the same thing. On top of the histogram it marks the Point of Control, the 70% value area and a table of the totals. The cTrader edition is a C# transcription that was checked against the original, object by object, on the same bars.
cTrader 5.x · C# on the cAlgo API · 26 parameters: the 25 of the original plus 1 cTrader-only · AccessRights = None · sold on the cTrader Store, EURUSD trial
EURUSD M5, IC Markets feed. The shape of this evidence is unusual and the honest description is less impressive than the number: this design computes on one bar, so there is no column of values running back through twenty thousand bars to diff. The population is configurations multiplied by drawn objects: 26 input sweeps, 4 probe generations over the five quantities that are computed on every bar, and 3 drawn-object runs comparing every line, label and table cell field by field. Zero was the acceptance bar, and it was set before any C# was written.
The Rigid Volume Profile gallery, picture by picture
The 10 pictures of the cTrader Store gallery. Select any picture to open it full size.


What it does
A volume profile tells you where trading actually happened. Most of them draw one bar per price level and colour it by whichever side won. Rigid Volume Profile splits every level in two and draws both halves: the buying volume that traded at that price and the selling volume that traded at the same price, side by side.
That difference matters more than it sounds. A level that absorbed a lot of volume in both directions and a level that absorbed the same total almost entirely from one side look identical on a single-bar profile, and they are not the same thing. Here they look different, because they are drawn differently.
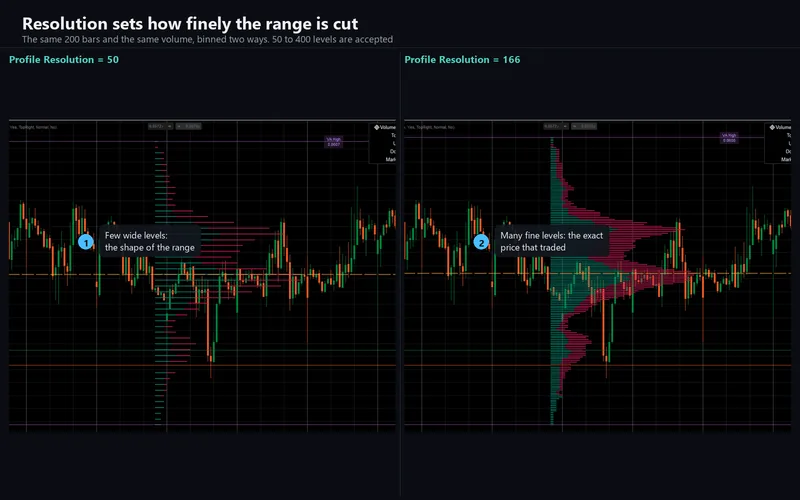
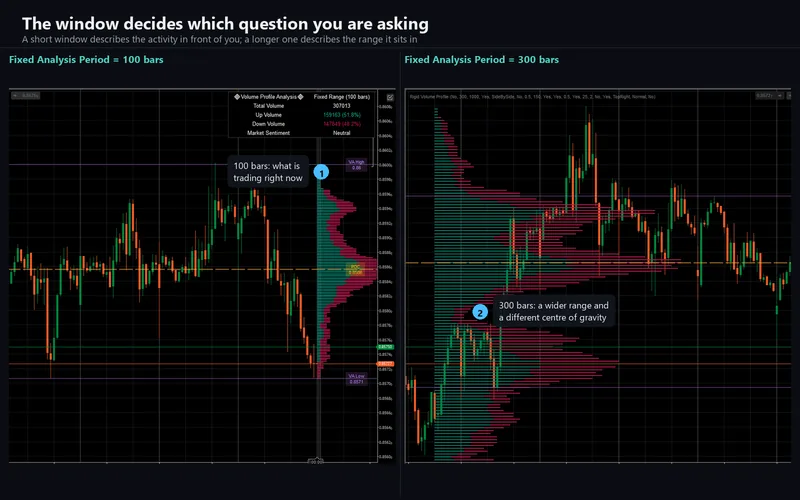
The window is a fixed number of bars, 200 by default and settable from 50 to 2000, and the price range of that window is cut into a fixed number of levels, 150 by default and settable up to 400. Fixed rather than adaptive is the point of the name: the same setting produces the same grid on two charts, so two profiles are comparable.
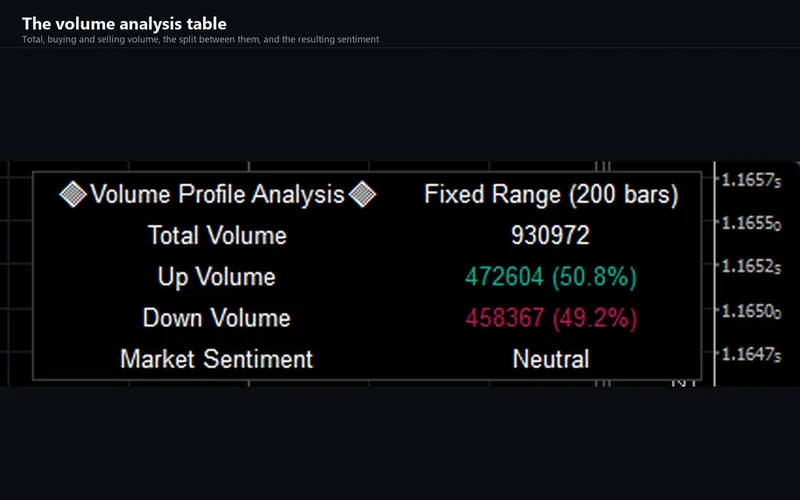
On top of the histogram it marks the Point of Control, the single level that traded the most, and the value area, the price band holding seventy per cent of the window’s volume. A compact table in the corner reports the totals: volume, buying, selling, and the balance between them.
Three display modes change how the split is presented. Side by Side puts the two halves back to back from a centre line. Stacked runs the selling volume on from the end of the buying volume. Split draws them as one bar divided in place. A mirror option flips the whole profile to the other side of its anchor, and a delta marker can flag the levels where one side dominates beyond a threshold you set.
What repaints, and what does not
The profile is rebuilt on every tick of the newest bar, because the newest bar’s volume is still changing. While that bar is forming, the histogram, the Point of Control and the value area can all move.
Nothing older moves. No completed bar’s contribution to a level ever changes, and no level is redrawn from history. When a bar closes its volume is final and the profile stops moving until the next tick of the next bar.
There is a second thing worth knowing, and it is the design’s rather than the port’s. The window is the last N bars, so it slides. A Point of Control sitting at a given price today can move tomorrow without a single new trade at that price, simply because the oldest bar fell out of the window. That is what a rolling profile is; it is not drift and it is not a fault.
How it was verified
The cTrader edition is a C# transcription, and it was checked against the original rather than eyeballed. The engine is kept free of any platform type so the exact code that ships can be replayed outside the terminal; the original was instrumented to publish its internals on the same chart; and the two were compared against each other on identical data.
4,988,367 comparisons across 33 runs on EURUSD M5. 0 mismatches.
The shape of that evidence is unusual and it is worth being straight about, because the honest description is less impressive-sounding than the number.
This design computes on one bar. The profile, the Point of Control, the value area and the table are all gated behind a check for the last bar on the chart, so there is no column of values running back through twenty thousand bars to compare. A bar-by-bar diff, which is what the previous ports in this series rested on, is impossible here for almost everything the product draws.
So the population is different: it is configurations multiplied by drawn objects. Twenty-six input sweeps, each changing one setting and re-comparing everything the change touches; four probe generations covering the five quantities that are computed on every bar, which is what proves the two sides were reading identical data in the first place; and three drawn-object runs that compare every line, label and table cell that reaches the chart, field by field: both endpoints, the packed colour, the width, the line style and whether the object exists at all.
Zero was the acceptance bar, and it was set before any C# was written rather than chosen afterwards to match the result. The reason it was reasonable to demand: the source calls only two platform functions, both at the top level of the script on every bar with a constant length. There is no standard-deviation call, no cross-timeframe request, and nothing computed conditionally. Nothing in it depends on platform behaviour that is undefined, so “close enough” would have been the wrong standard.
The measurement the port turned on
The source declares a drawing budget of five hundred objects. It is not five hundred. The platform keeps five hundred and one, and the difference decides whether the port is right or one line short at every resolution above the boundary.
It was measured rather than read off the declaration. Each price level costs three line objects, so a resolution of 166 creates exactly 501 of them, plus the Point of Control and the two value-area lines. At that setting the platform discards nothing. At 167 it discards three, and those three are the lowest price level, because the oldest objects are the ones that go.
An engine built on 500 passes every test at the default and fails silently at the boundary. This one was rebuilt on 501 after the measurement, and the two resolutions either side of the boundary are shipped as their own parity runs.
Reproduced faithfully, including the awkward parts
A port that quietly improves its source is no longer a port. Several behaviours here look like defects, are the original’s, and are reproduced deliberately.
Above 166 levels, the bottom of the profile is not drawn. This is the budget above. At the maximum of 400, the lowest 234 levels are missing from the drawing. Their volume is still counted in the table, the Point of Control and the value area; only the histogram stops. Turning the value area off frees two slots and brings part of a level back, which means two display toggles also change which bars render.
A perfectly flat bar poisons its level. The weighting divides by the bar’s range with no guard, so a bar whose high equals its low contributes an undefined value and the level it lands in ends up empty for the whole pass. Rare, and confined to one level.
Switching the bull and bear split off moves the whole profile ninety-nine bars. The two branches start the drawing at different offsets, one hard-coded and the other not. A display toggle that relocates the drawing is exactly the kind of thing a port is tempted to tidy up.
The Point of Control line ignores the colour input named after it. That input colours the label; the line itself is a fixed amber. And in the table, the up-volume figure uses a hard-coded teal while the down-volume figure follows its input, so the two rows are deliberately not symmetrical.
The mirror option does nothing in Split mode. Both sides of that decision are written identically in the source.
The value area is not the textbook one. Levels are sorted by volume, the busiest are taken until seventy per cent of the total is reached, and the value-area high and low are the highest and lowest prices among the levels taken, which is not the same as a contiguous band grown outward from the Point of Control. Two busy levels far apart therefore produce a wide value area with a quiet middle.
All of these are listed with their measurements in the product’s deviations document, and the ones a buyer is likely to hit lead the troubleshooting guide.
Parameters
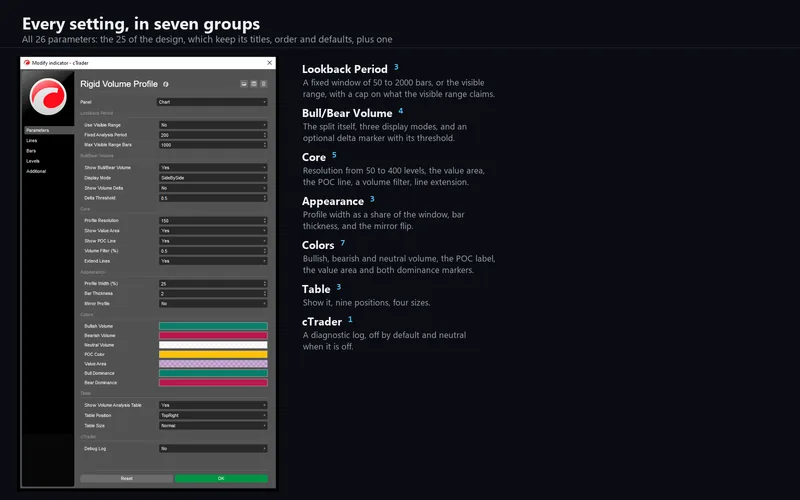
| Group | Inputs | Notes |
|---|---|---|
| Lookback Period | 3 | A fixed window of 50 to 2000 bars, or the visible range, with a cap on how many bars the visible range may claim |
| Bull/Bear Volume | 4 | The split itself, the three display modes, and an optional delta marker with its threshold |
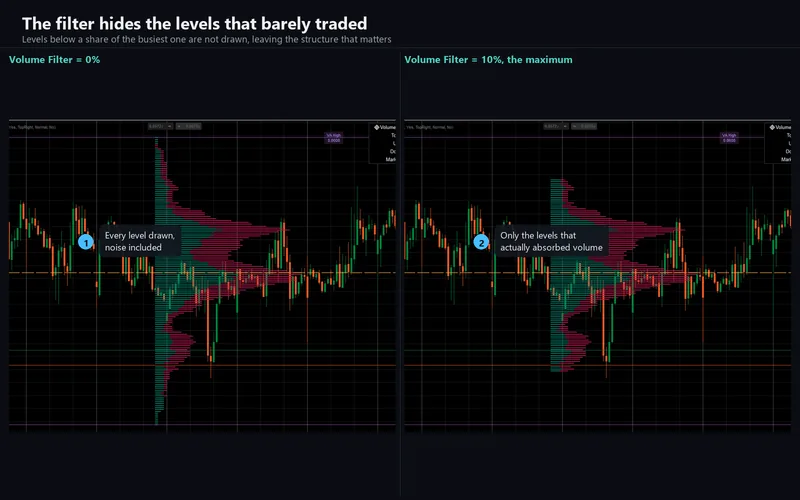
| Core | 5 | Resolution from 50 to 400 levels, the value area, the Point of Control line, a volume filter that hides quiet levels, and whether the lines extend |
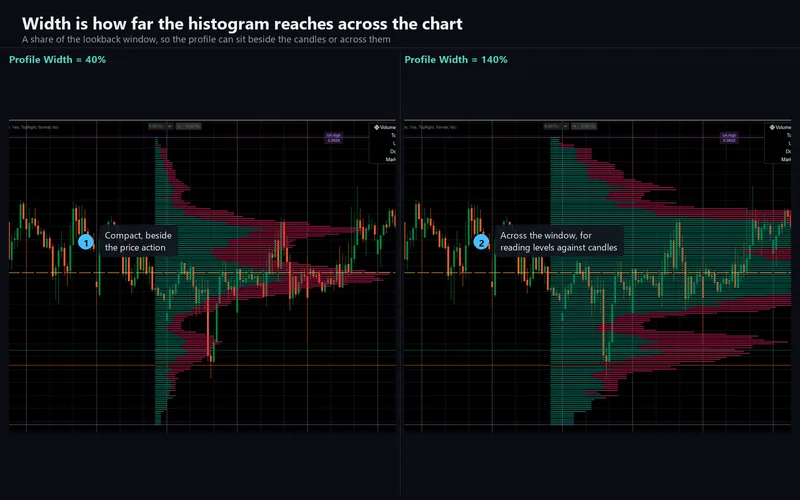
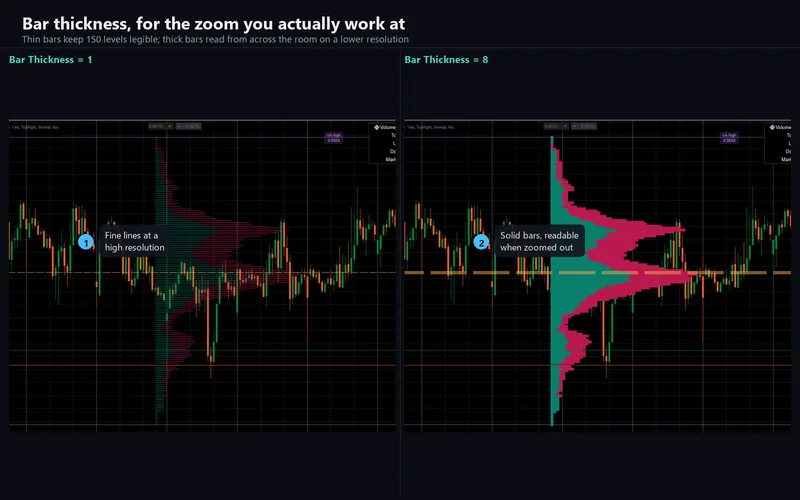
| Appearance | 3 | Profile width as a share of the window, bar thickness, and the mirror flip |
| Colors | 7 | Bullish, bearish and neutral volume, the Point of Control label, the value area, and the two dominance markers. Transparency is carried through as the source sets it |
| Table | 3 | Show it, put it in any of nine positions, and pick one of four sizes |
| cTrader | 1 | A diagnostic log, off by default and neutral when off |
Twenty-six in total: the twenty-five of the original, with its titles, order, defaults, ranges and groups preserved and checked against the source mechanically, plus one of the port’s own. The check is not a reading: it parses the input declarations out of the source and asserts them against the parameter list read back from the built binary, including the order they appear in the settings dialog.
What it will not do
It has no alerts, because the original declares none and an alert family that fires where the original is silent would not be a port. It declares no access rights at all: it cannot place, modify or close an order, cannot read or write a file, and opens no network connection.
One honest limitation, and it is the one that generates the most questions about any volume tool. On a forex symbol, volume is the number of price updates your broker reported, not contracts traded. Two brokers do not count the same updates, so the same two hundred bars genuinely contain different volume on different feeds and any volume profile will draw a different shape from them. No indicator can reconcile that. On instruments carrying real exchange volume, indices and metals among them, the feeds agree far more closely.
Support
Questions about the product go through the Discussion tab of the Store listing or the contact page. Refunds are the Store’s 14-day money-back. Updates are free for buyers and are announced in the listing’s version history.
Chart captures are from the cTrader build on a demo account. This is analytical software, not investment advice; it never places, modifies or closes an order, and it is built with no trading permissions at all. The profile rebuilds on every tick of the newest bar and its drawings move until that bar closes. On a forex symbol, volume is the tick count your broker reports, so your profile is your feed's. Trading involves risk. Past performance does not guarantee future results.