Smart Liquidity Matrix for cTrader: the original, ported and verified bar by bar
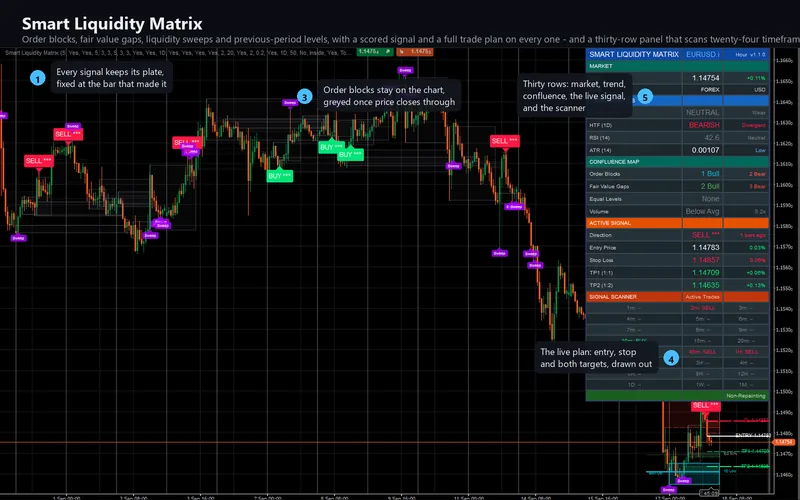
Institutional order flow leaves marks on a chart: the candle a move began from, the gap it left behind, the pair of highs that stopped it twice, the wick that took those highs and closed back under them. This indicator draws all four, keeps them until price invalidates them, and then greys them out rather than deleting them, so you can still see where they were. On that picture it raises buy and sell signals with an entry, a stop and two targets drawn out and labelled, and it runs the same signal engine independently on twenty-four other timeframes - every period cTrader offers - in a thirty-row panel. The cTrader edition is a C# transcription checked against the original, bar by bar and object by object, on the same bars.
cTrader 5.x · C# on the cAlgo API · 70 parameters: the 44 of the original plus 26 cTrader-only · AccessRights = None, webhook included · sold on the cTrader Store, EURUSD trial
ICMARKETS EURUSD H1, 23,103 bars. Forty-two columns - every internal series that produces a drawn object, a signal or an alert - compared bar by bar against the original, and every one of them at zero. The four cross-timeframe series the original requests are at zero too. Beyond the value comparison, the drawn objects were read out of the original's own chart model and compared field by field, and the whole thing was then attached to a live cTrader chart, which is where four defects turned up that no value comparison can see. Zero was the acceptance bar, set before any C# was written.
The Smart Liquidity Matrix gallery, picture by picture
The 11 pictures of the cTrader Store gallery. Select any picture to open it full size.



What it does
Four kinds of mark, all drawn from the same idea: that a move which ran somewhere leaves evidence of where it came from.
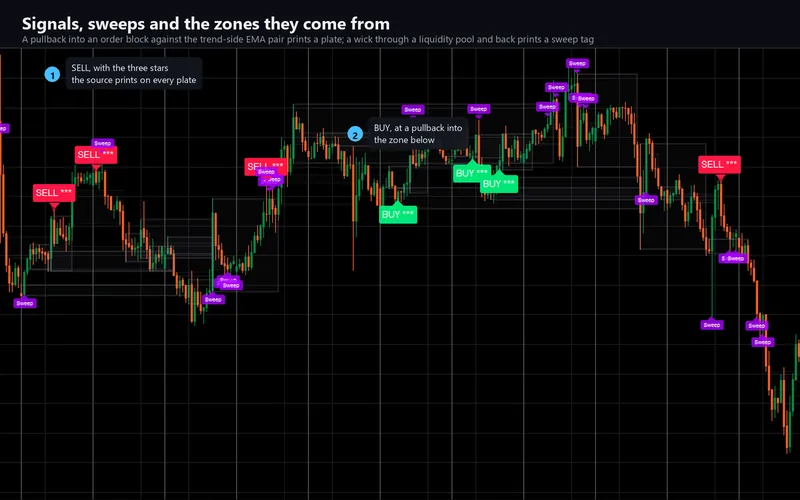
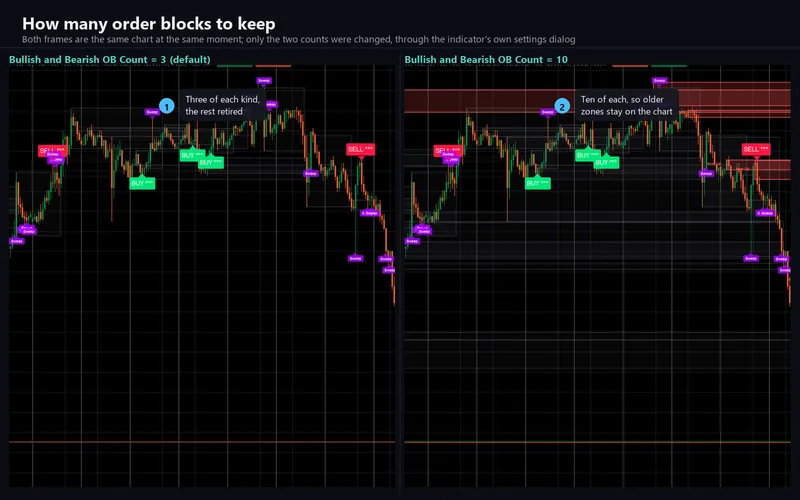
Order blocks. At every confirmed swing, the last opposite-coloured candle before the move away is boxed. That candle is where the position was built. The zone stays live on the chart until price closes through it, and then it is recoloured grey rather than removed - so the chart keeps a record of a level that failed, which is often more useful than a chart that pretends it never existed.
Fair value gaps. Three-bar imbalances, where the middle bar ran far enough that the first and third do not overlap. Drawn the moment they complete, greyed the moment price closes back through them.
Equal highs and lows. Two swings that match within a tenth of the current ATR are joined with a dotted level and tagged EQH or EQL. These are the pools that stops sit behind.
Liquidity sweeps. When price wicks through one of those levels, or through the previous day's high or low, and then closes back inside, the bar is marked. That is the pattern the other three marks exist to give context to.
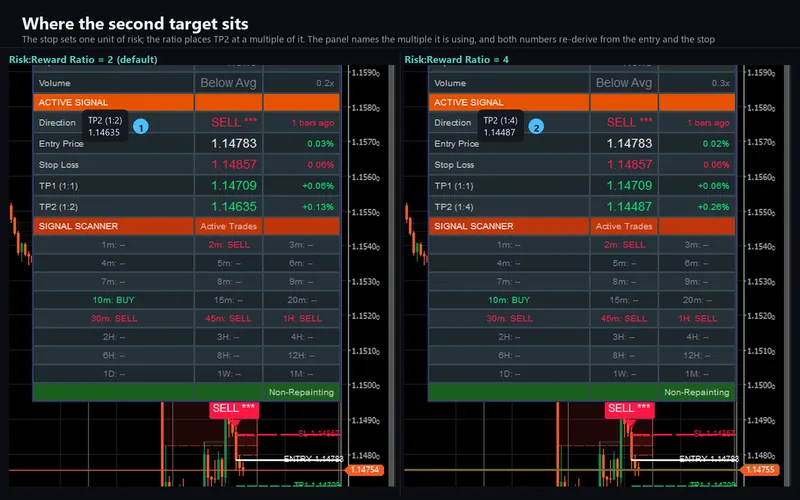
On top of them sit the previous period's high and low with their own glow, the fifty per cent line between the current swing high and low, and the signals themselves: a pullback into a zone on the trend side of an EMA pair prints a plate, and with it an entry at that bar's close, a stop padded off the swing by a fraction of ATR, and two targets at multiples of that risk - five lines, each tagged with its own price, none of which ever moves afterwards.
The panel, and the scanner in it
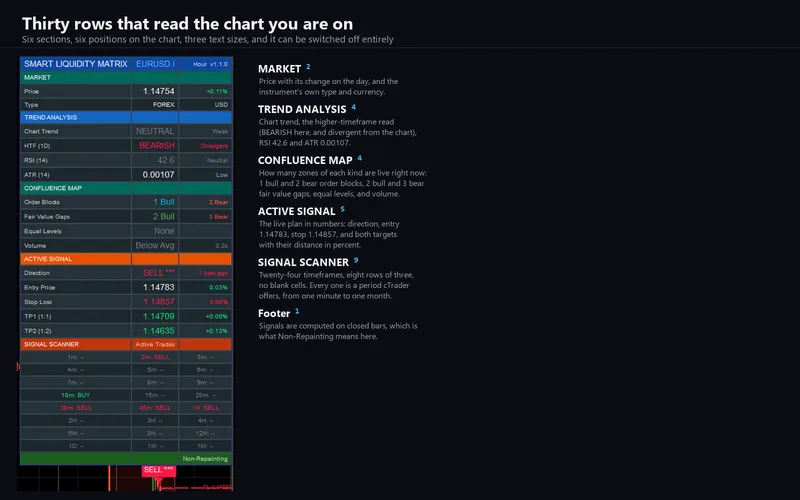
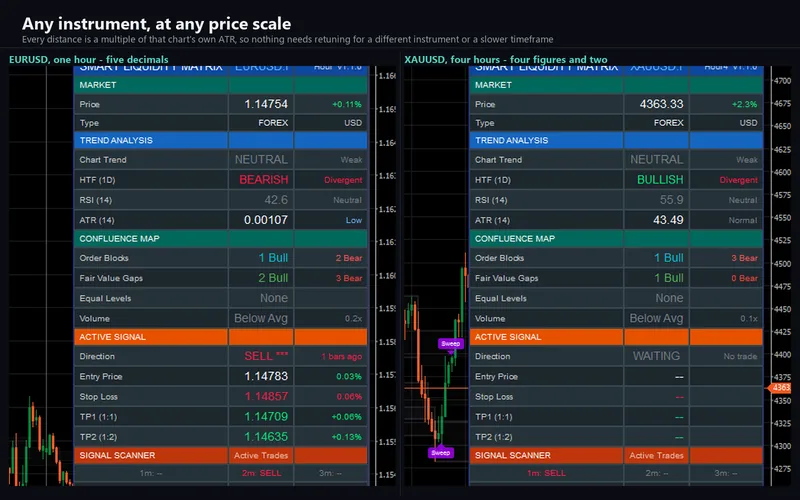
Thirty rows in six sections down one side of the chart: the market, the trend read including a higher-timeframe one, a confluence map counting how many zones of each kind are live right now, the active signal as numbers, and then the scanner.
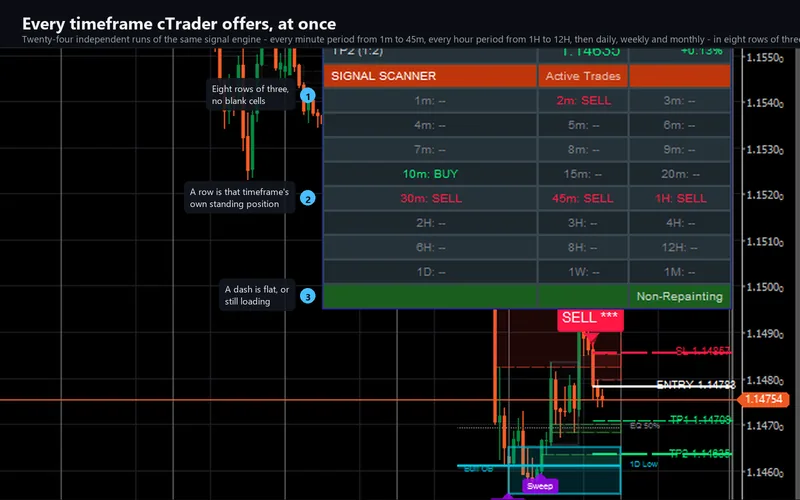
The scanner is the part worth explaining, because it is not a summary of the chart you are on. It is twenty-four independent runs of the same signal engine, each on its own bars, each with its own EMAs, RSI, ATR and pivots. It prints what each of them currently holds: a long, a short, or nothing. Agreement across neighbouring rows is the point - a sell showing on thirty minutes, forty-five minutes and one hour together reads very differently from a lone signal on a single row.
Twenty-four is every standard time period cTrader offers: 1m, 2m, 3m, 4m, 5m, 6m, 7m, 8m, 9m, 10m, 15m, 20m, 30m and 45m; 1H, 2H, 3H, 4H, 6H, 8H and 12H; then daily, weekly and monthly. They fill eight rows of three with no blank cells. The original runs twenty-one timeframes and leaves three cells empty; six of its rows are second-based, and cTrader has no second-based timeframe at all - below one minute it offers only tick, range and renko bars, which count events rather than time. So the ladder here is cTrader's own rather than the original's, and it is the wider of the two.
What repaints, and what does not
Nothing. Every signal is evaluated when a bar closes, so a plate that prints never moves and never disappears, and its alert arrives once. The levels a signal drew are fixed at its bar and never move, which is why they sit back in history rather than tracking the right edge.
The zones do change state - that is what invalidation is - but they change in one direction only, from live to greyed, on a closed bar, and never back.
How the port was verified
The engine is platform-free C#: it references no cTrader type at all, so the same code that ships can be compiled outside the platform and replayed against a bar series. That is what makes the comparison evidence about the shipped indicator rather than about a second implementation written to agree with it. The drawing is in there too - the zones, the levels, the plates and all ninety panel cells are built by the engine, because anything the host alone could build would sit outside every gate the project has.
A probe was derived from the original mechanically, plotting every internal series to the data window, and TradingView's chart model was read directly over the debugging protocol. 970,326 cell comparisons over 23,103 identical bars, and zero mismatches in the product's own output - forty-two of forty-two columns, meaning every series that ends up as a drawn object, a signal or an alert. The four cross-timeframe series the original requests are at zero as well.
The scanner is reported separately, and with its limits stated. Fifteen of its twenty-four rows were compared against the alternate series a resolution-switch dump yields, and they differ on about 3.7 per cent of alternate bars - thirty-six of nine hundred and sixty-three daily bars, in thirty-one runs of one to three bars, in both directions. The identical machine running in the chart's own context is exact, which locates the difference in the reference series rather than in the port; the monthly row is at zero throughout and is the control.
The other nine rows - four, six, seven, eight, nine and twenty minutes, and six, eight and twelve hours - were added when the ladder was changed to cTrader's own period list, after the reference capture, and they have not been compared against anything. They run the same class through the same delivery rule as the fifteen that were, so the expectation is that they behave the same, but that is an expectation and not a measurement. Everything else in the package is backed by a diff; this is not, and it is written down in the parity report rather than folded into the percentage. The scanner feeds no signal, no drawn object and no alert.
What the comparison found
A feature of the original that cannot run. The structure-break detector compares a candidate level against a variable that is only ever assigned inside the branch that comparison gates. In Pine, a comparison against an undefined value is itself undefined, which is false - so the branch never executes and the variable stays undefined forever. The consequences are larger than they sound and all four were reproduced: no break-of-structure or change-of-character line is ever drawn, the chart's own trend direction is permanently neutral, no bar is ever tinted, and the panel's trend row reads NEUTRAL on every chart. C# takes the opposite view of that comparison, so a direct transcription fired five hundred bull and five hundred and eight bear breaks the original never draws. Confirmed twice over: a probe counted zero events across 23,104 bars, and a dump of the original's own chart model carries no such label and five lines in total.
An off-by-one worth two hundred and forty pips. The rule that decides which bar of a higher timeframe is available on a given chart bar already accounts for the original's own one-bar offset. Applying that offset again on top of it moved a level by up to 240 pips across 22,222 bars - a difference invisible on any single screen and obvious in a column diff.
The mapping keys on a bar's open, not its close. Keying on the close put every bar that straddles a daily boundary one alternate bar early: 958 mismatches, all at the same three times of day, exactly one per trading day.
A chart is not a spreadsheet. With nearly a million matching cells behind it, the first attach to a real chart found four things: the indicator threw out of its calculation on the very first tick and drew nothing at all; the panel stretched to fill the whole pane and rendered its text at two pixels, because a cTrader grid row defaults to proportional sizing; the chart layers were painted once and then never again, so on a still chart only the panel appeared; and the script that runs the offline test suite called a method that does not exist, so it died on a null reference that read like a broken test rather than a broken script. All four are fixed and re-checked on a chart.
The things that are deliberately different
The scanner ladder, described above: cTrader's twenty-four standard periods instead of the original's twenty-one, because six of those are second-based and have nothing to map to. Everything else about each row - the engine, the inputs, the arithmetic - is the same.
The panel keeps its thirty rows and all ninety cells, but the space between rows is tighter: twenty-four pixels against the original's thirty. The text itself is the same size; only the spacing changed, because a cTrader chart pane is typically far shorter than a browser chart and at the original's spacing the panel ran off the bottom.
The footer cell that carries a web address in the original ships empty. Store rules forbid a link inside a visual, and the cell stays so the footer keeps its geometry.
Four settings are declared in the original and never read by it - a minimum confluence score, a signal cooldown, and a higher-timeframe filter that colours one panel row without filtering anything. They ship exactly as written, so the settings list matches one for one, and the documentation says plainly that they do nothing. Working versions of all three live in a separate cTrader group, switched off by default, so the defaults still match the original exactly. In the same spirit: the original assigns a fixed score of three to every signal, which is why every plate reads three stars; that is reproduced rather than improved.
Finally, the drawn stop and targets are not derived the same way as the levels the original's own statistics are based on - different pivot length, different padding, different multiple - and the two coincide only at settings that are not the defaults. Both behaviours are reproduced faithfully and the difference is written down in the package's deviations document, because a reader who compares the drawn stop to the tracked one deserves to know why they differ.
Requirements
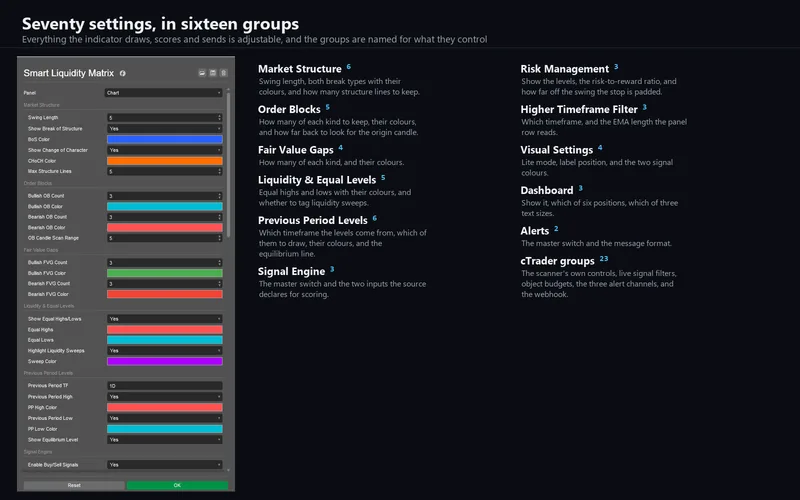
cTrader Desktop 5.x on Windows or Mac. Bars only - every scanner row is a real cTrader timeframe read from the same bar data as the chart, so nothing depends on how much tick history your broker serves. It declares no access rights at all, which you can check in the algorithm's own details; the webhook posts through cTrader's own networking service, which is why it needs none. Seventy parameters: the forty-four of the original, reproduced with the same titles, defaults, ranges and order, plus twenty-six cTrader-only ones for the scanner, the alert channels, the webhook, object budgets and a debug log.
Support
Through the Discussion tab of the Store listing, so the conversation stays next to the product. Please include your broker, symbol, timeframe, cTrader version and a screenshot of the whole chart including the panel.
This is analytical software, not investment advice. It never places, modifies or closes an order, and it is built with no trading permissions at all. Signals are computed on closed bars, which costs a one-bar delay and is why a plate never appears and then disappears. The drawn stop and targets are levels on a chart, not orders, and the figures in the panel carry no spread, commission or slippage. Trading involves risk. Past performance does not guarantee future results.