Sniper Ashfield Pro for cTrader: the original, ported and verified bar by bar
A moving-average cross is the most common signal there is, and on its own one of the least reliable. This indicator treats the cross as a question rather than an answer: on the bar the fast EMA crosses the slow one, it checks VWAP, RSI, MACD, ADX and volume, scores the agreement, and only draws a signal when the score reaches the minimum you set. Every signal arrives with an entry, a stop and three targets drawn out and labelled. The cTrader edition is a C# transcription checked against the original, bar by bar, colour by colour and object by object, on the same bars.
cTrader 5.x · C# on the cAlgo API · 67 parameters: the 34 of the original plus 33 cTrader-only · AccessRights = None, webhook included · sold on the cTrader Store, EURUSD trial
ICMARKETS EURUSD M5, 21,360 bars, four probe generations and eighteen input sweeps, with XAUUSD M5 as a second symbol. Every internal series, every per-bar colour and alert condition, and every drawn object - plates with their tooltips, lines, tags and all fifty-seven panel cells - compared against the original, all at zero apart from one declared cell. Then the whole thing was attached to a live cTrader chart, which is where the faults no comparison can see turned up. Zero was the acceptance bar, set before any C# was written.
The Sniper Ashfield Pro gallery, picture by picture
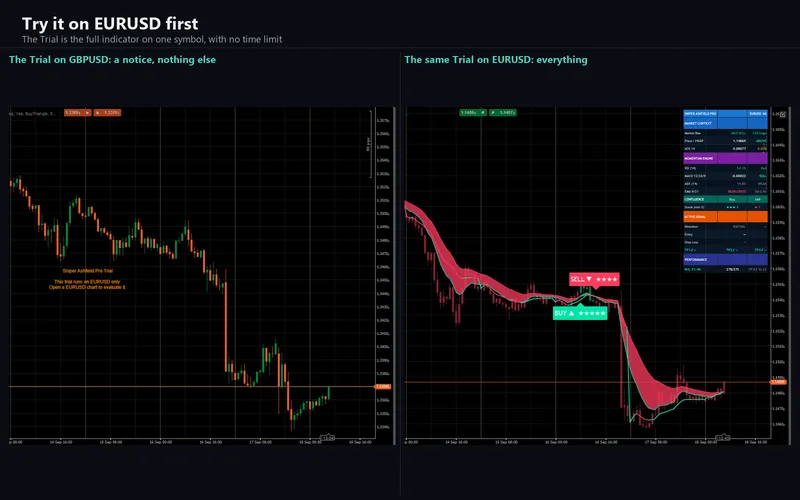
The 11 pictures of the cTrader Store gallery. Select any picture to open it full size.





What it does
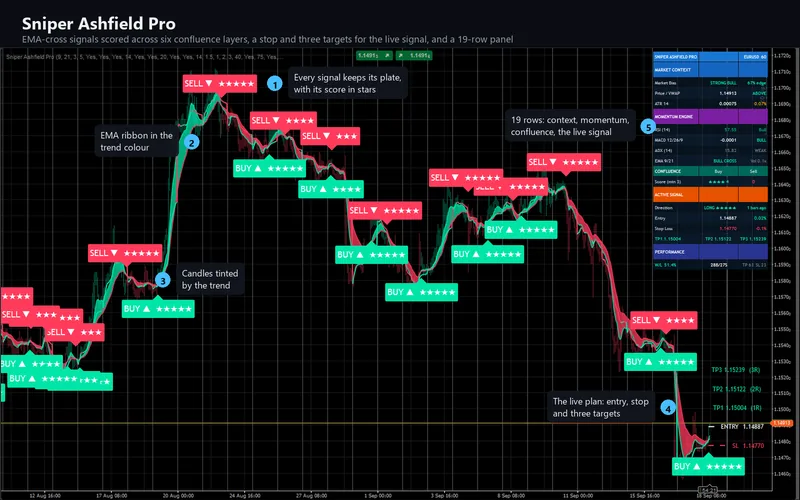
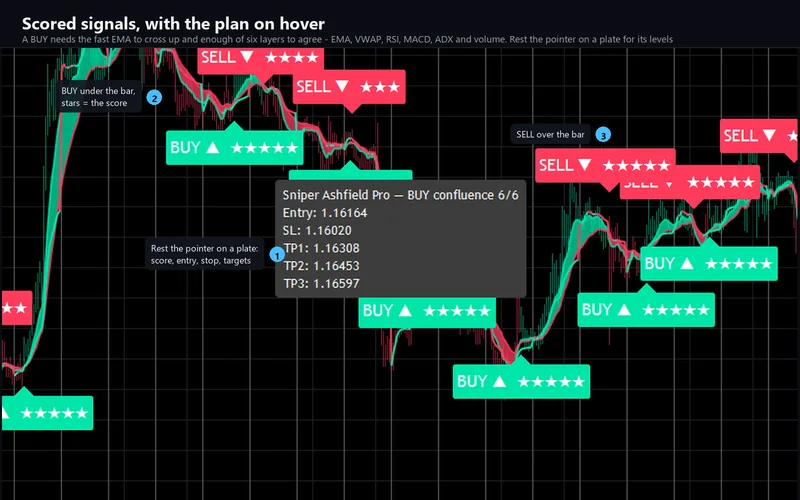
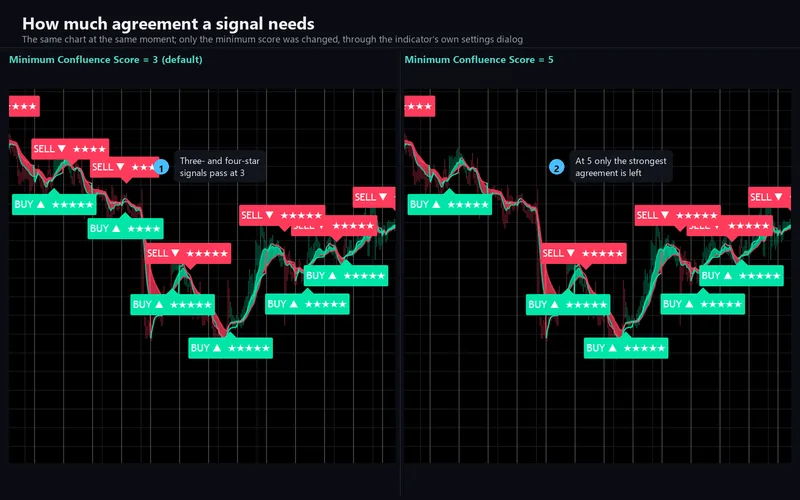
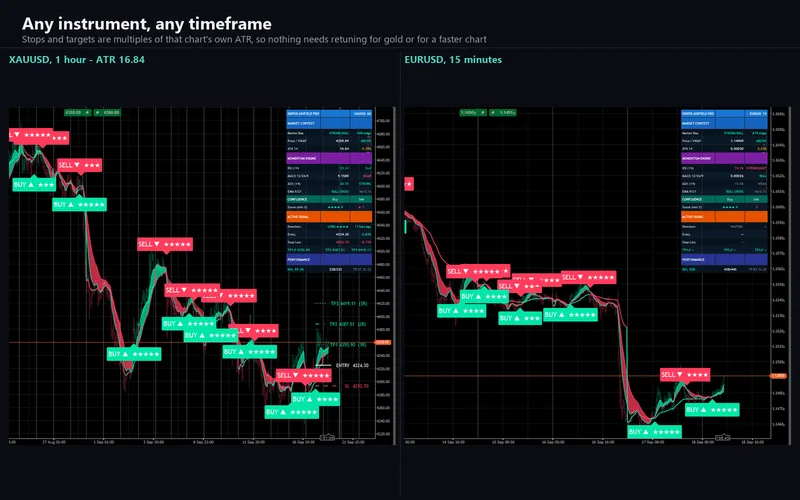
One event starts everything: the fast EMA crossing the slow one. On that bar the indicator asks six questions - is the fast EMA on the right side, is price on the right side of the session VWAP, is RSI past 50, is MACD on the right side of its signal line, is ADX strong with price on the right side of the fast EMA, is volume above its average on a candle closing the right way - and scores a point for every yes. When the score reaches the minimum you set, and no signal in the same direction fired within the cooldown, a plate is drawn with the score as stars.
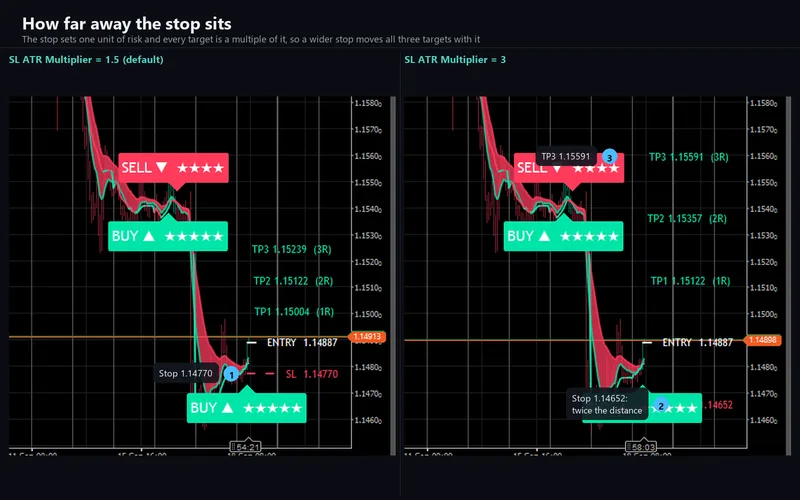
Every signal comes with a plan: an entry at the signal bar's close, a stop one and a half ATR away, and three targets at one, two and three times that risk, drawn as lines with price tags. A target that is reached is restyled; when the trade reaches its third target or its stop, its lines are removed. Around that sit the EMA ribbon in the trend colour, the session VWAP, trend-tinted candles, and a nineteen-row panel with the market bias, the momentum readings, both standing scores, the live signal and a running tally.
Two things the score does not tell you
The first layer always scores on a signal bar - a bullish cross means the fast EMA is above the slow one. And each of the other five filters, when switched off, awards its point automatically. Switching filters off therefore makes signals more frequent, not less; with every filter off, every cross outside the cooldown is a six-point signal. Both behaviours are the original's and are reproduced as written, and both are stated in the Store listing and the documentation rather than left for a buyer to discover.
The panel's win/loss tally is equally literal: a stop reached after the first target counts as a win, and a trade replaced by a newer signal is not counted at all. It is a tally of what the drawn levels met on loaded history, not a backtest.
What repaints, and what does not
With Non-Repaint Mode on, which is the default, a signal is decided when its bar closes and never moves afterwards. With it off, the cross and the score are judged on the forming bar, and a plate can appear and then disappear before the bar closes. Target and stop checks run on the forming bar in both modes, as in the original, and the forming bar is rolled back before every tick, so a touch that is undone leaves no trace.
How the port was verified
The engine is platform-free C#: it references no cTrader type, so the code that ships can be compiled outside the platform and replayed against a bar series. The drawing is built by the engine too - every plate, line, tag and all fifty-seven panel cells - so the comparison covers what is drawn, not only what is computed.
Probes were derived from the original mechanically, plotting every internal series to the data window, and TradingView's own daily bars were used as the VWAP session anchor. 10,467,676 cell comparisons over 21,360 identical ICMARKETS EURUSD M5 bars, across four probe generations and eighteen input sweeps: zero mismatches. The same generations on XAUUSD M5 add 1,322,626 comparisons at zero, and XAUUSD's two-decimal tick is what exercises the ten-tick risk floor and every price string on the chart.
Beyond values: 11,151,546 per-bar comparisons of colours, plotted values and all thirteen alert conditions, read from TradingView's own colorer slots, at zero. And the drawn objects were read out of TradingView's chart model and compared field by field - every plate with its tooltip text, the five lines, the five tags and the fifty-seven panel cells - over three dumps and 9,919 fields, with one declared difference and nothing else. EMA, ATR, RSI and VWAP turned out to be bit-exact, not merely within tolerance.
What the comparison found
A label budget with slack. The original keeps at most five hundred labels. The first rule fitted to two snapshots - five hundred plates, price tags exempt - matched both and failed on a third, from a different symbol. A probe that plots the platform's own label count at the end of every bar then showed the real behaviour: the count runs up to 505 and a collection brings it back to 500, oldest first. The engine now matches it on every bar of both symbols, and the per-bar count is a permanent part of the comparison.
A chart that drew nothing. cTrader compiles indicators with overflow checking on. One narrowing cast of a packed colour threw inside the drawing code, and the chart showed the panel and nothing else. The offline build now uses the same checking, so that class of fault fails in the test suite rather than on a buyer's chart.
Layers in the wrong order. cTrader paints every chart control above every chart object and every plotted line. Drawing the ribbon, the lines and the plates the usual way would have put the entry line under a seventy-five per cent opaque ribbon at exactly the bar it starts on. Everything is drawn instead on one canvas, in the original's order, with the colours taken from the inputs - so changing a colour in the settings changes the ribbon, the lines, the VWAP and the candles together.
The small things a chart shows. The panel's row height, column widths and typeface were measured off the original and reproduced; the dash patterns of the stop and target lines were measured in stroke widths; the hover tooltip on a plate is drawn to the original's measured size, colour and position. A settings title containing ≥ and × shows exactly in the dialog, and the original's tooltips appear on the parameters that carry them.
The things that are deliberately different
The panel's header carries a byline in the original; the cell ships empty here, keeping its colour and its place in the header. The webhook's JSON leaves out the matching field for the same reason.
The green and red circle options for the plate text are emoji, which cTrader draws in one colour. By default the indicator paints the disc itself in the emoji's measured colours; a setting leaves it to the font instead. Price tags that would fall past the chart's right edge are pulled inside it, because a cTrader chart does not keep empty space to the right of the last bar the way the original's does; that too is a setting.
Volume on cTrader is the broker's tick volume, so on a live chart the VWAP and the volume layer follow your broker's ticks rather than the volume TradingView shows. The VWAP resets on the first bar of your broker's daily candle, the same rule the original applies to its own. The parity above was run on TradingView's own bars and volume, because two different feeds cannot otherwise be compared at all.
One setting, the panel background colour, is declared in the original and never read by it. It ships exactly as written, so the settings match one for one; a separate cTrader-only switch, off by default, makes it paint the rows.
Requirements
cTrader Desktop 5.x. Volume is required, for the VWAP and one confluence layer. It declares no access rights at all; the webhook posts through cTrader's own networking service, which is why it needs none. Sixty-seven parameters: the thirty-four of the original with the same titles, defaults, ranges, groups and order, plus thirty-three cTrader-only ones for display, the VWAP day, the alert channels and the webhook.
Support
Through the Discussion tab of the Store listing, so the conversation stays next to the product. Please include your broker, symbol, timeframe, cTrader version and a screenshot of the whole chart including the panel.
This is analytical software, not investment advice. It never places, modifies or closes an order, and it is built with no trading permissions at all. The drawn stop and targets are levels on a chart, not orders, and the panel's tally carries no spread, commission or slippage. Trading involves risk. Past performance does not guarantee future results.