Supply Demand Quadra Zones for cTrader: the original, ported and verified bar by bar
An eight-line EMA ribbon prints a BUY or a SELL on the bar it crosses, and every signal arrives with its whole trade plan already drawn: an entry, an ATR stop and up to four targets spaced in multiples of that risk, each with its price. Beside the chart, a screener reads nine symbols of your choosing and a dashboard reads five timeframes, so the wider market is on the same screen as the signal. The cTrader edition is a C# transcription checked against the original, bar by bar and object by object, on the same bars.
cTrader 5.x · C# on the cAlgo API · 50 parameters: the 33 of the original plus 17 cTrader-only · AccessRights = None, webhook included · sold on the cTrader Store, EURUSD trial
ICMARKETS EURUSD M5, 20,989 bars, the account’s full history. Seven probe generations compared the ribbon, the signals, the whole ATR trade state machine, all nine screener symbols and all five dashboard timeframes, with every higher-timeframe and foreign-symbol input dumped as real bars. Zero in everything the indicator draws; the two diagnostic columns that differ are named and explained below. No input sweep was captured, so the default configuration is what is proven against the original.
The Supply Demand Quadra Zones gallery, picture by picture
The 10 pictures of the cTrader Store gallery. Select any picture to open it full size.

What it does
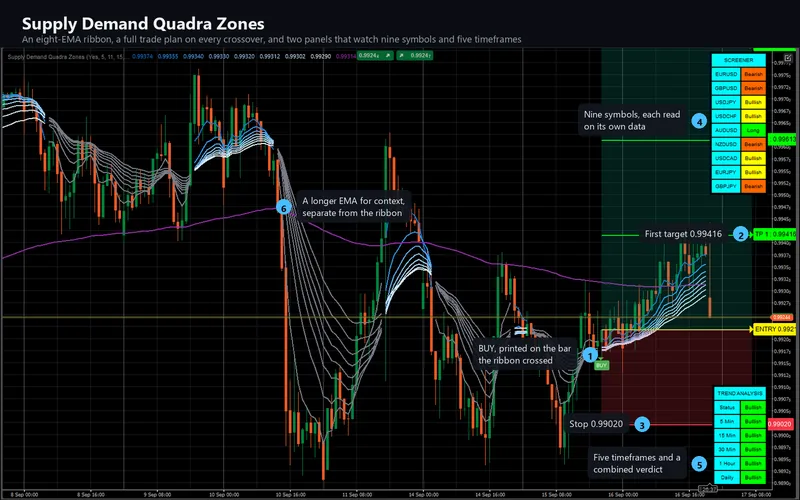
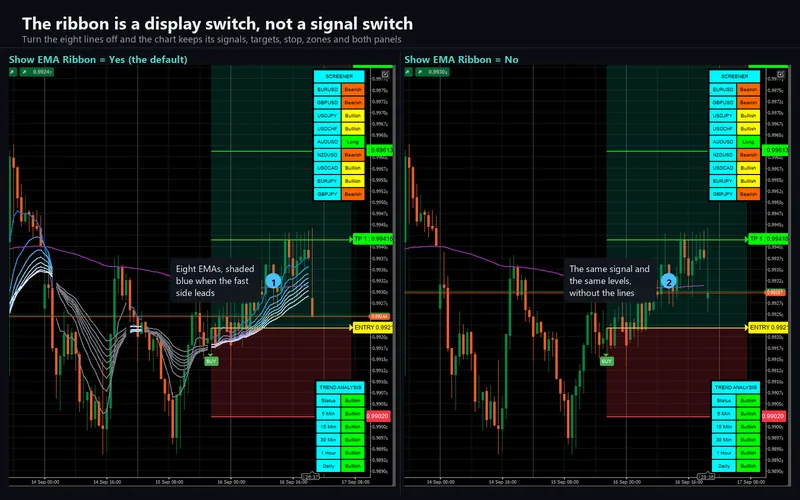
Supply Demand Quadra Zones puts an entry signal, a drawn risk plan and your wider market context on one chart. An eight-line EMA ribbon (5, 11, 15, 18, 21, 24, 28 and 34) turns blue while its fast leg leads and grey when it does not, with a 200-period reference line drawn separately for context. When the second ribbon line crosses above the eighth a BUY plate is printed on that bar; when it crosses back, a SELL plate.
A full trade plan on every signal
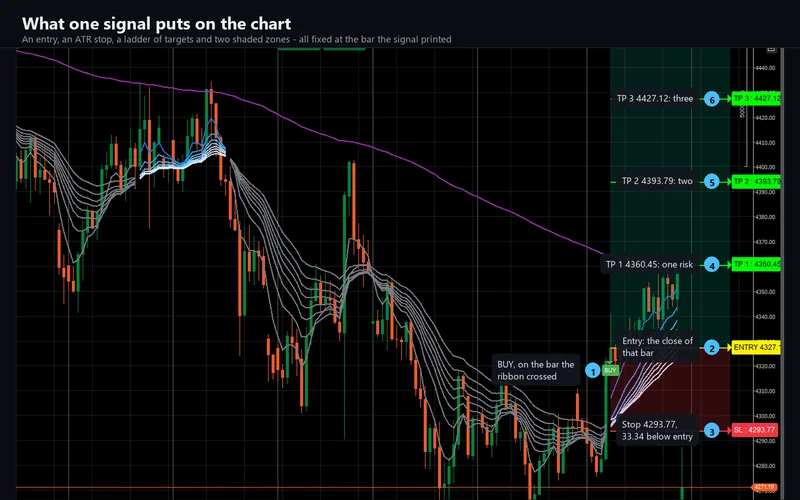
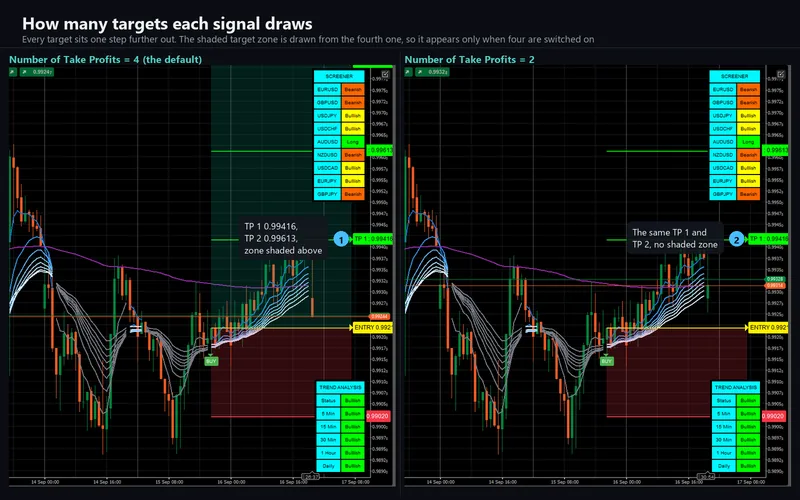
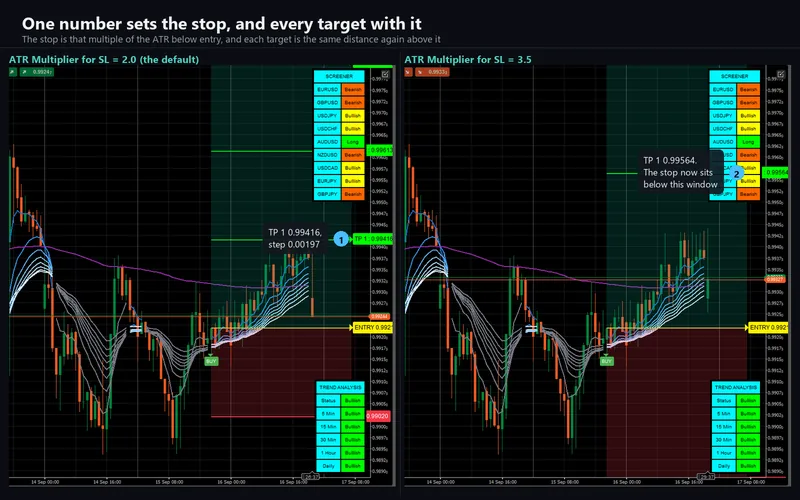
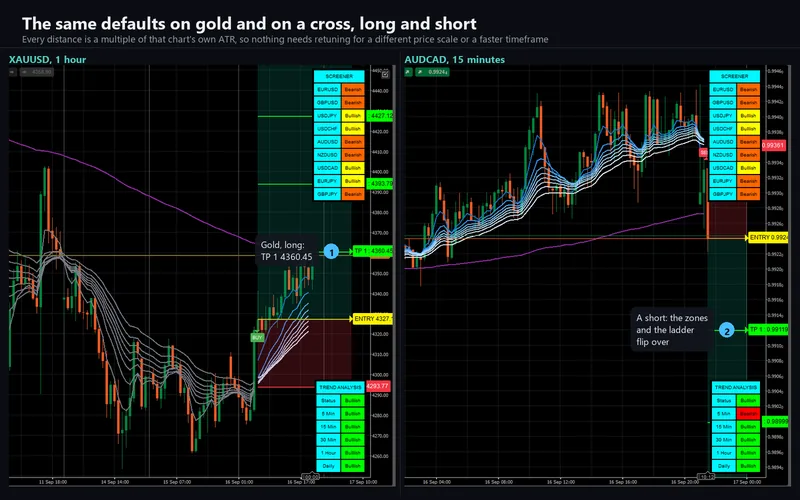
Every signal arrives with its risk plan already drawn: an entry line at the close of the signal bar, a stop placed at a multiple of ATR, and up to four take-profit levels spaced as multiples of that stop distance. On the defaults the ladder is 1R, 2R, 3R and 4R. Each level carries its own price tag at the right edge, and the space between entry and target and between entry and stop is shaded, so the shape of the trade reads at a glance. The plan tracks forward with price and freezes when the trade resolves: either the stop is touched or every enabled target has been reached.
You decide how many targets are drawn, one to four, and how far the stop sits from the entry. Because the targets are multiples of the stop distance, widening the stop widens the whole ladder with it.
The two panels
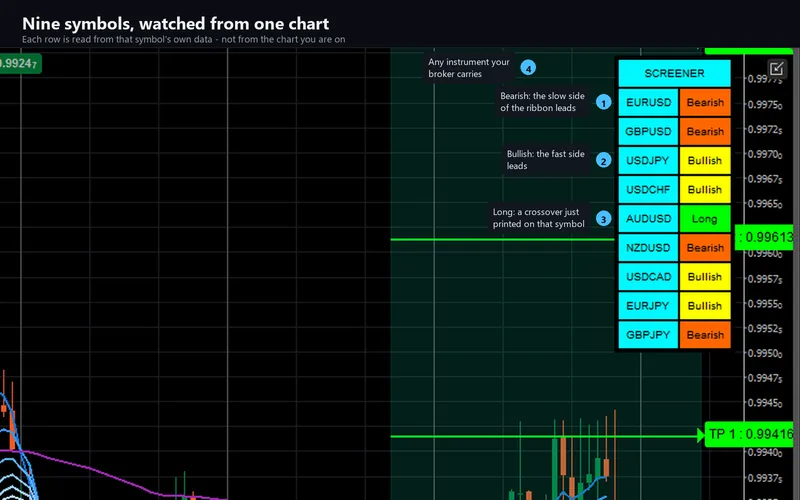
A screener classifies up to nine symbols of your choosing as Long, Short, Bullish or Bearish, each computed on that symbol's own data at the chart's timeframe, so you can see which other markets are lining up the same way without opening nine charts.
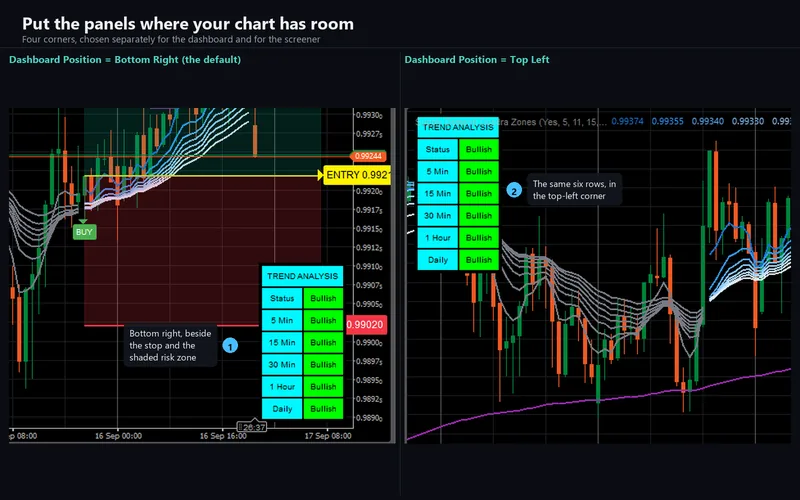
A trend dashboard reports the chart symbol's direction on 5-minute, 15-minute, 30-minute, 1-hour and daily bars, plus a combined Status row decided by a majority vote of three timeframes you pick.
What repaints, and what does not
The BUY and SELL signals do not repaint. They are decided on closed bars and never move once drawn, and neither do the entry, stop and targets that come with them.
The two panels do repaint, and that is stated rather than hidden. Both are drawn on the live bar and read developing higher-timeframe data, so their cells can change until those bars close. Treat them as a live picture of where things stand, not as a record of what happened.
Alerts and the webhook
Alerts deliver through the cTrader log, a sound and e-mail. Every signal, and every step of the trade that follows it, can also be posted as JSON to an address you choose, so an external bot, journal or notification service can act on it without anyone watching the chart. It sends the side, the entry, the stop and the full target ladder, then a message for each target reached, for the stop, and for the trade closing. It is off until you fill in the address, it never fires while history is loading or in a backtest, and it runs with no elevated permissions: the indicator declares AccessRights = None.
Parameters
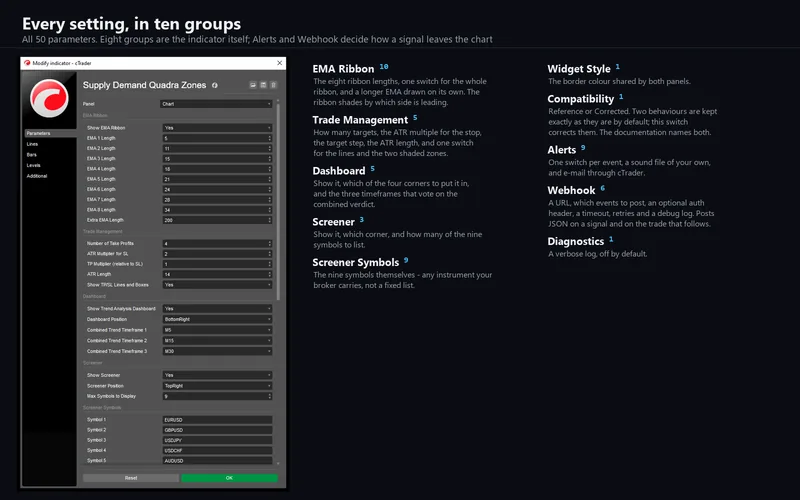
Fifty in total: the 33 inputs of the original with their titles, order, groups, defaults and ranges preserved, followed by 17 cTrader-only settings. Sixteen of those seventeen choose delivery (alerts, the webhook, diagnostics) and change no calculation.
The exception is Compatibility. On Reference, the default, the engine reproduces the original exactly, including two defects in it, one in the 4-hour dashboard option and one in the shaded target zone. On Corrected it fixes both. The default is Reference because a port should behave like the thing it is a port of until you choose otherwise; the full table ships with the product and describes both behaviours.
How the port was verified
The bars were read straight out of the TradingView chart model: 20,989 ICMARKETS EURUSD five-minute candles, the account's full history. Seven probe copies of the original exposed its internals to the data window at ten decimals, each generated from the shipped script by a tool that adds data-window plots and changes no shipped line. Between them they covered the ribbon and its crossovers, the whole ATR trade state machine read back through the original's own drawing accessors, all nine screener symbols, the five dashboard timeframes, and a history check. The higher-timeframe and foreign-symbol inputs were dumped as real bars rather than rebuilt, so every EMA was computed in its own context.
The result is zero in everything the indicator draws: 3,047,203 cell comparisons, 0 mismatches in product output. The comparison also carries diagnostic columns that exist only to make a failure name its own cause, and two of them differ, both explained: a delivery timestamp every generation carries, and a residue in the daily EMA's seed that never reaches a verdict. The drawn objects were compared as well, on EURUSD M5 and on AUDCAD H1.
One limit is stated plainly: no input sweep was captured, so what is proven against the original is the default configuration. The Corrected branch, target counts other than four and the stop and target hit tests in both directions are covered instead by 72 engine self-tests, and a mutation test shows all 10 of 10 deliberately planted defects are caught.
The things that are deliberately different
The screener ships forex symbols instead of the original's exchange tickers, since those are what a cTrader account trades; all nine are yours to change. The target and stop zones are outlined in their fill colour, because cTrader draws a rectangle's border and fill separately. And the original's promotional banner is not reproduced. Everything else is the original's behaviour, including the two defects the Compatibility setting exists for.
Signals on a live chart can still differ from the same indicator on another broker's feed, because the candles differ. That is a data difference, not a difference in the calculation, and it is why the comparison above is a same-bar replay rather than two screenshots.
Requirements and installation
cTrader 5.0 or newer, desktop. Buy or try on the Store listing, press Install, then add Supply Demand Quadra Zones from the indicator list. The ribbon needs 34 bars before it is fully formed and the reference line 200, so a very short history shows fewer lines than a long one. It runs on any instrument and any timeframe the platform offers.
The trial
The trial edition is the same build with one restriction: it runs on EURUSD only, and every other symbol shows a notice instead of drawing. The signals, trade zones, screener, dashboard, alerts and webhook are identical to the full version, with no time limit and no reduced history.
Support
Questions about the product go through the Discussion tab of the Store listing or the contact page. Refunds are the Store’s 14-day money-back. Updates are free for buyers and are announced in the listing’s version history.
This is analytical software, not investment advice. It never places, modifies or closes an order, and it is built with no trading permissions at all. The drawn stop and targets are levels on a chart, not orders, and a target marked as reached records only that price touched it on loaded history, with no spread, commission or slippage. Trading involves risk. Past performance does not guarantee future results.