Voidbreak Buy Sell Pro for cTrader: the original, ported and verified bar by bar
A range filter is a line that refuses to move until price makes it. This indicator draws one, stays quiet while price moves inside its range, and signals the moment price breaks out and the line flips direction - every flip a BUY or a SELL, each with an entry, a stop and three targets drawn out and labelled. The cTrader edition is a C# transcription checked against the original, bar by bar, colour by colour and object by object, on the same bars - including the default stop, which the original computes in a way its own compiler warns about.
cTrader 5.x · C# on the cAlgo API · 60 parameters: the 36 of the original plus 24 cTrader-only · AccessRights = None, webhook included · sold on the cTrader Store, EURUSD trial
ICMARKETS EURUSD M5, 21,411 bars, four probe generations and twenty-three input sweeps, with XAUUSD M5 as a second symbol and M15, M30 and H1 for the timeframe-scaled stop. Every internal series, every per-bar colour and alert condition, and every drawn object - plates with their tooltips, lines, tags and all forty-eight panel cells - compared against the original, all at zero apart from one declared cell and an eight-cell CCI tie the engine flags itself. Then the whole thing was attached to a live cTrader chart, which is where the fault no comparison can see turned up. Zero was the acceptance bar, set before any C# was written.
The Voidbreak Buy Sell Pro gallery, picture by picture
The 11 pictures of the cTrader Store gallery. Select any picture to open it full size.



What it does
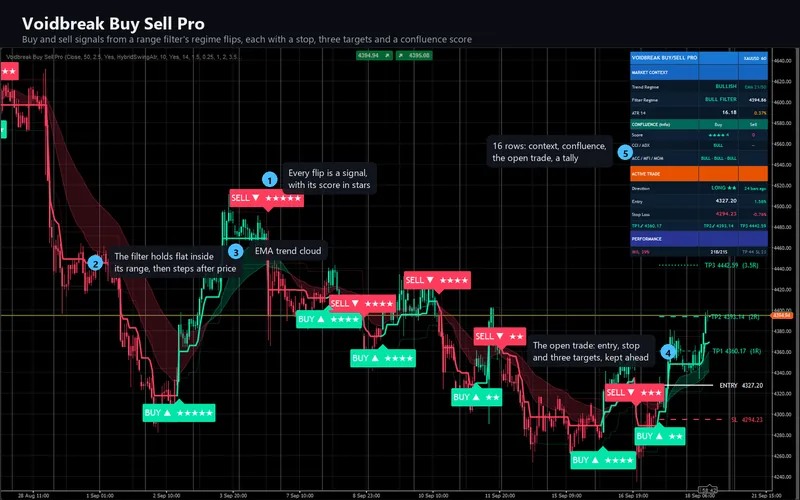
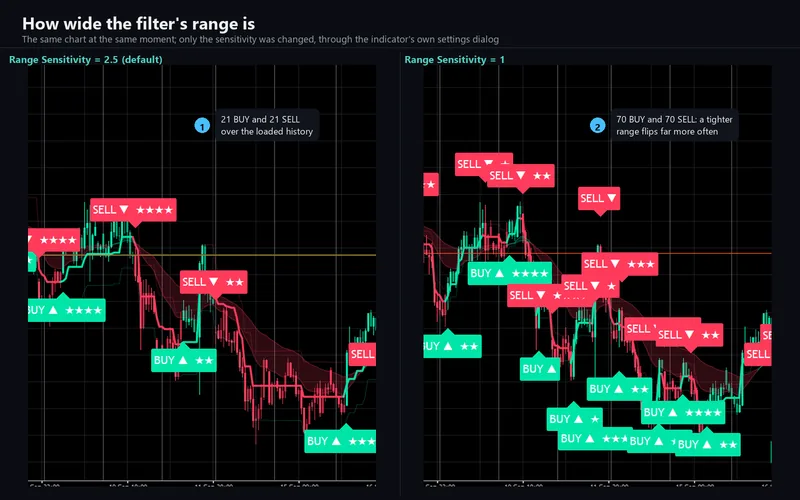
The indicator draws a range filter: a line that holds still while price moves inside a smoothed range of it, and steps after price only when price leaves that range. The range is a double-smoothed average of how far the source moves from bar to bar, times a sensitivity you set. While the line is flat nothing happens. When price breaks out and the line starts stepping in the new direction, the regime flips - and every confirmed flip is a signal: BUY when it turns bullish, SELL when it turns bearish.
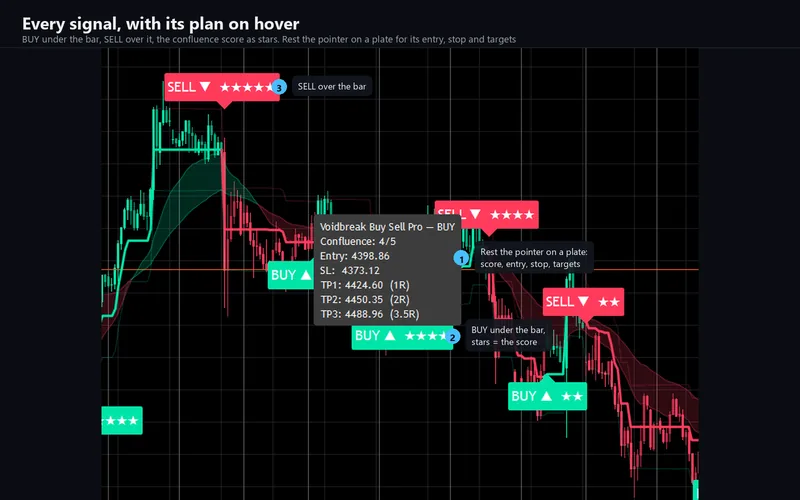
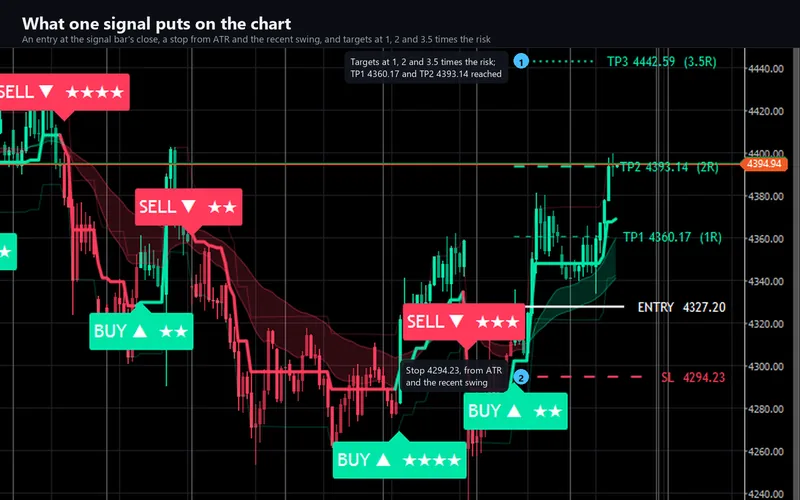
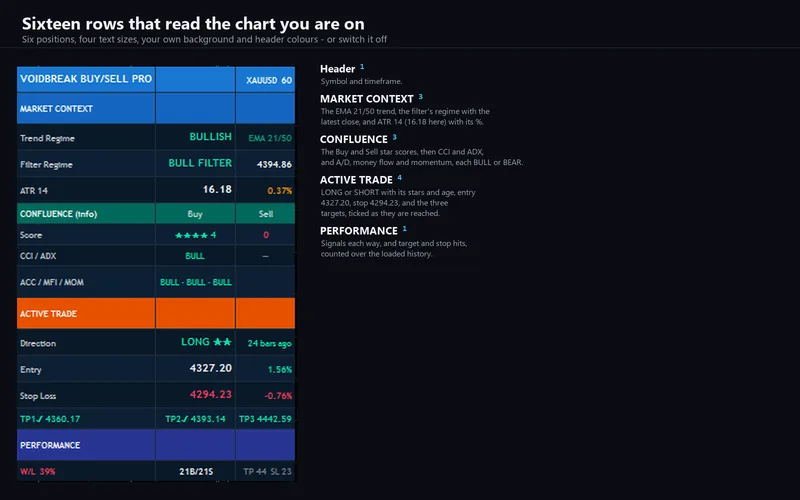
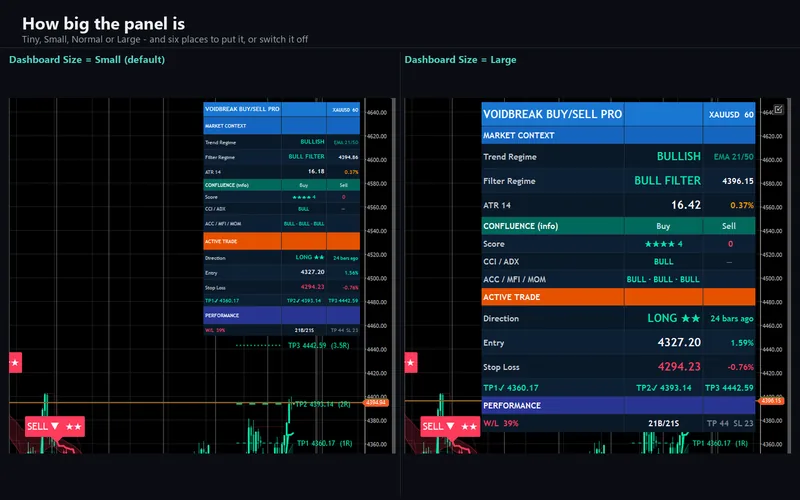
Each signal comes with a plan: an entry at the signal bar's close, a stop, and three targets at one, two and three and a half times the risk, drawn as lines with price tags that are carried forward on every closed bar so they always run ahead of price. Around that sit the filter line and its bands, candles coloured by the filter's direction, an EMA trend cloud, and a sixteen-row panel with the market context, the confluence reading, the open trade and a running tally.
Five stars that never hold a signal back
Every plate carries a score out of five - CCI, ADX with the directional lines, accumulation/distribution, money flow, and a regression of momentum. The score is information only. It decides nothing: a flip with none of the five agreeing still prints its plate, without stars. A factor switched off simply stops scoring. That is the original's design, reproduced as written and stated plainly in the listing, because "confluence" usually means a filter and here it does not.
The panel's win/loss tally is equally literal: a stop reached after the first target counts as a win, and a trade closed by the next flip counts as a win when it closed at or beyond its entry. It is a tally of what the drawn levels met on loaded history, not a backtest.
What repaints, and what does not
A signal is decided when its bar closes and never moves afterwards. Target and stop checks run on the forming bar, as in the original, and the forming bar is rolled back before every tick, so a touch that is undone leaves no trace. Alerts are delivered once per bar, and never for the history loaded when the indicator attaches.
How the port was verified
The engine is platform-free C#: it references no cTrader type, so the code that ships can be compiled outside the platform and replayed against a bar series. The drawing is built by the engine too - every plate with its tooltip, the five lines, the five tags and all forty-eight panel cells - so the comparison covers what is drawn, not only what is computed.
Probes were derived from the original mechanically, plotting every internal series to the data window. 14,475,827 cell comparisons over 21,411 identical ICMARKETS EURUSD M5 bars, across four probe generations and twenty-three input sweeps: zero mismatches. The same generations on XAUUSD M5 add 1,651,893 comparisons, and the trade generation on M15, M30 and H1 another 1,921,830 - the swing lookback scales with the timeframe, so the timeframe had to be varied too. All at zero.
Beyond values: 13,794,380 per-bar comparisons of colours, plotted values and all seven alert conditions, read from TradingView's own colorer slots, at zero. And the drawn objects were read out of TradingView's chart model and compared field by field over thirteen dumps - both symbols, every panel size and position, both label wordings, levels on and off - 42,828 fields with one declared difference and nothing else.
One residue is declared rather than hidden: eight cells in which the CCI factor sits exactly on its ±50 threshold, where the last bit of a mean deviation decides the comparison. The engine flags those bars itself, and every one of the eight is on a flagged bar. No signal, stop or target reads the CCI.
What the comparison found
A stop the previous attempt called irreproducible. The default stop reads the lowest low or highest high of the last few bars - but the original computes it inside the signal block, so it only runs on signal bars, and TradingView's compiler warns that such a call should be made on every bar for consistency. An earlier port measured the same construction and found no model that matched more than about a third of its stops. Here a separate micro-script called it under five execution patterns and five lengths, 160,865 times, and the exact behaviour turned out to be a small ring of bar-indexed slots, written only when the call runs, with an unwritten slot reading zero and a cached extreme rescanned only when it leaves the window. That model matches all 160,865 executions and every default stop on both symbols. It ships, so the product computes what TradingView computes.
What that model means in practice. Because a buy's swing low can read zero, the Recent Swing mode puts about 28 % of its stops more than ten ATR away on EURUSD M5 history. The default Hybrid mode takes the tighter of that and an ATR stop, and on the same histories it never placed a stop on the wrong side of the entry or beyond ten ATR - 4,277 signals on five charts. The listing and the troubleshooting page say so in those words, instead of calling it rare.
One unit in the last place. The two EMAs of the trend cloud started a few cells off, by the smallest possible amount. TradingView seeds an EMA with the correctly rounded sum of its first values, not a running one; with that change the drift disappeared across every run.
Plates stacked the wrong way round. cTrader paints later chart controls over earlier ones. The label layer filled its slots oldest first, so where two plates overlapped, the older covered the newer - the opposite of TradingView. No value or object comparison can see paint order; the live chart did, and the layer now fills top-down.
The things that are deliberately different
The panel's header carries a byline in the original; the cell ships empty here, keeping its colour and its place in the header. The webhook's JSON leaves out the matching field for the same reason.
The source setting offers the original's eight price series - open, high, low, close and the four averages. The original also accepts another indicator's plot there; a cTrader indicator cannot take that input and still be replayed offline, so that one case is not available.
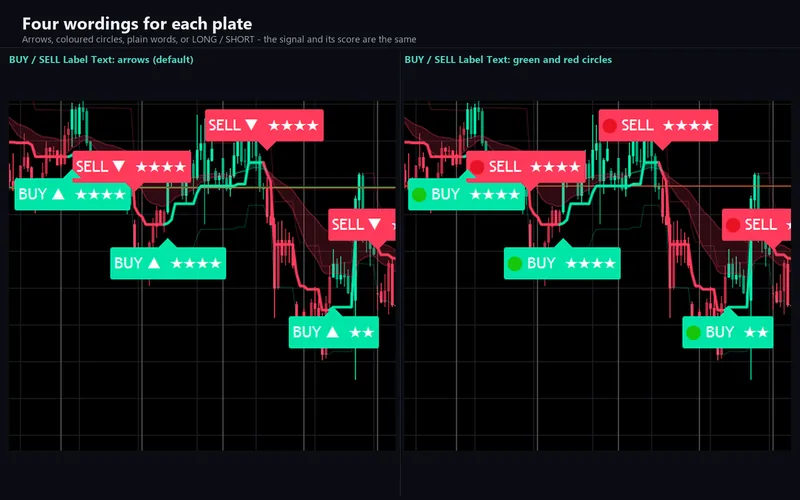
The green and red circle options for the plate text are emoji, which cTrader draws in one colour; by default the indicator paints the disc itself. Price tags that would fall past the chart's right edge are pulled inside it, because a cTrader chart does not keep empty space to the right of the last bar the way the original's does; that too is a setting. The original's alert dialog becomes a cTrader group with one switch per event and log, sound and e-mail delivery.
Volume on cTrader is the broker's tick volume, so on a live chart the accumulation and money-flow stars follow your broker's ticks. No signal or level reads volume. The parity above was run on TradingView's own bars and volume, because two different feeds cannot otherwise be compared at all.
Requirements
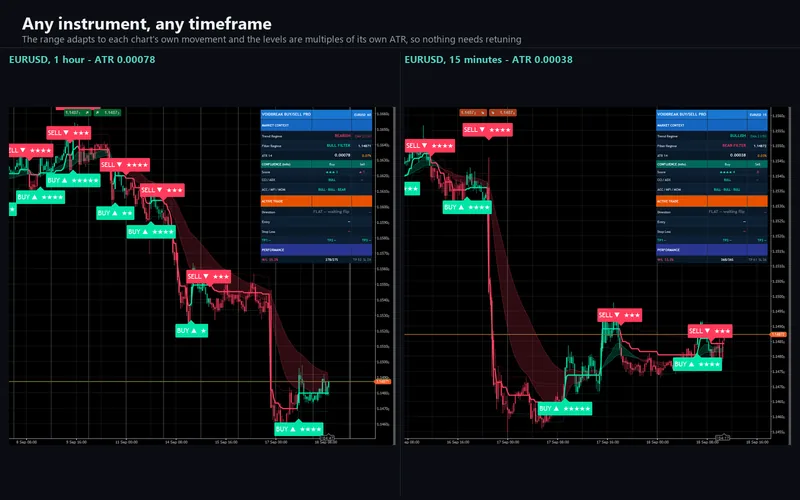
cTrader Desktop 5.x. It declares no access rights at all; the webhook posts through cTrader's own networking service, which is why it needs none. Sixty parameters: the thirty-six of the original with the same titles, defaults, ranges, groups, order and tooltips, plus twenty-four cTrader-only ones for display, the alert channels, the webhook and diagnostics.
Support
Through the Discussion tab of the Store listing, so the conversation stays next to the product. Please include your broker, symbol, timeframe, cTrader version and a screenshot of the whole chart including the panel.
This is analytical software, not investment advice. It never places, modifies or closes an order, and it is built with no trading permissions at all. The drawn stop and targets are levels on a chart, not orders, and the panel's tally carries no spread, commission or slippage. Trading involves risk. Past performance does not guarantee future results.