Wolf Blackout Trader for cTrader: the original, ported and verified bar by bar
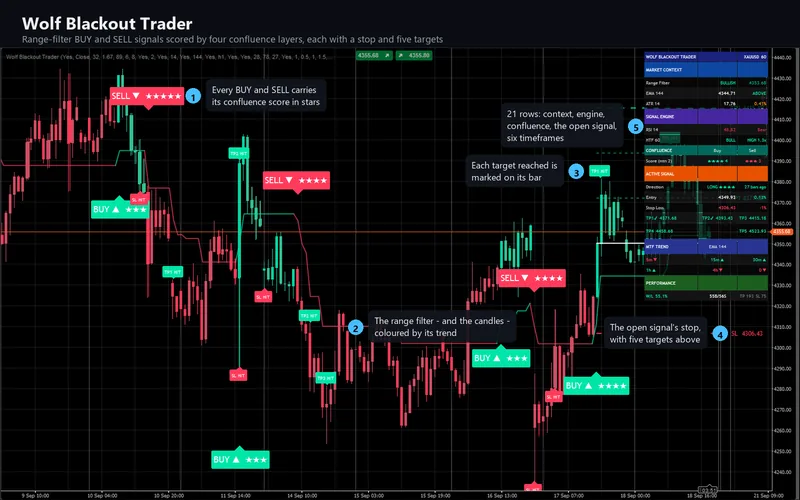
A range filter decides the trend, every candle takes its colour, and a turn only becomes a BUY or a SELL when enough independent readings agree - RSI, a long EMA, the same EMA on a higher timeframe, and a burst of volume. Each signal arrives with a stop and five targets drawn out and labelled. The cTrader edition is a C# transcription checked against the original, bar by bar, colour by colour and object by object, on the same bars - including two calls the original's own compiler warns about, and seven series it reads from other timeframes.
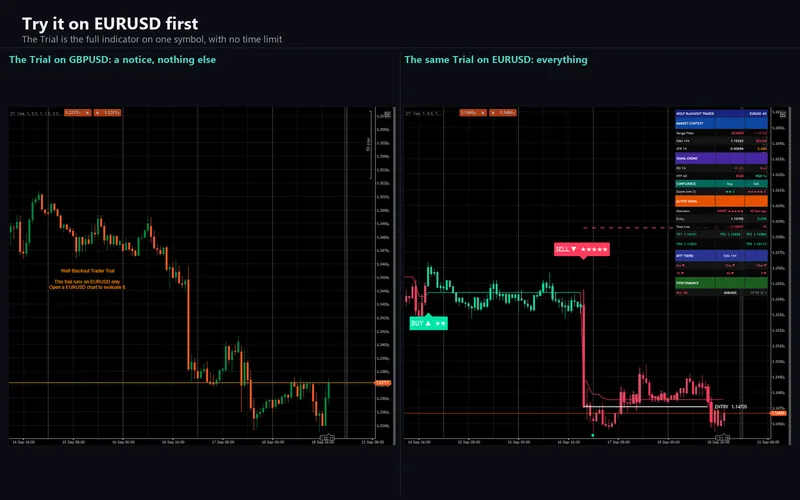
cTrader 5.x · C# on the cAlgo API · 73 parameters: the 43 of the original plus 30 cTrader-only · AccessRights = None, webhook included · sold on the cTrader Store, EURUSD trial
ICMARKETS EURUSD M5, 20,067 bars, five probe generations and twenty-seven input sweeps, with XAUUSD M5 as a second symbol and M15, M30 and H1, where the trend rows read lower timeframes. Every internal series, every per-bar colour and all thirteen alert conditions, and every drawn object - plates with their tooltips, hit labels, lines, tags and all sixty-three panel cells - compared against the original, all at zero apart from one declared empty cell, with no residue declared anywhere. Then the whole thing was attached to a live cTrader chart, which is where the fault no comparison can see turned up. Zero was the acceptance bar, set before any C# was written.
The Wolf Blackout Trader gallery, picture by picture
The 11 pictures of the cTrader Store gallery. Select any picture to open it full size.



What it does
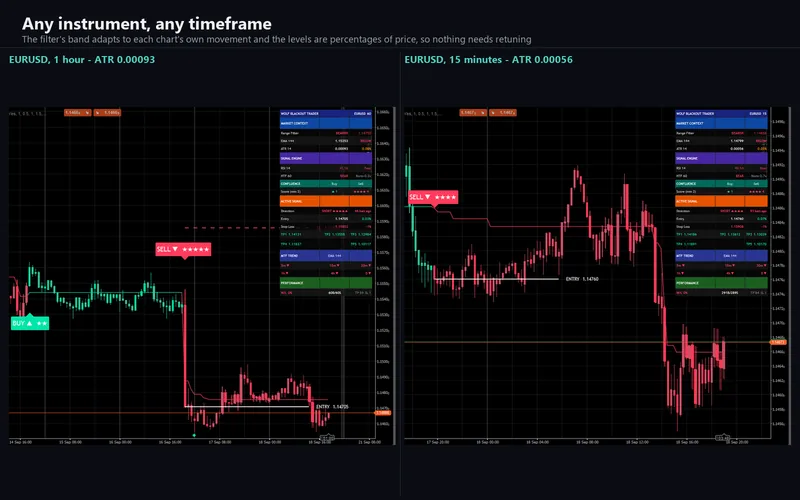
The indicator follows one range filter: a line that holds still while price moves inside a band around it, and steps after price only when price leaves that band. The band is the average of a fast and a slow smoothed range, so small noise does not move it and real moves do. Every candle is repainted in the filter's colour - bullish, bearish or neutral - which is where the "blackout" in the name comes from: the chart reads as a trend at a glance.
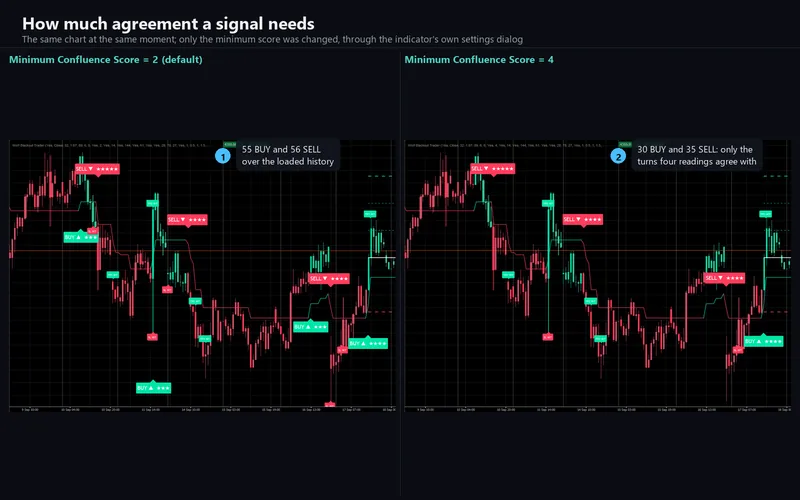
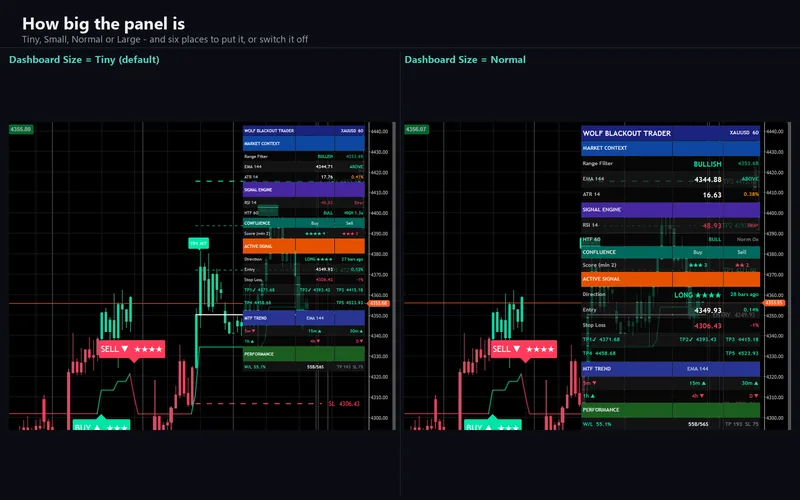
When the filter turns, the turn is scored. It gets one point for itself and one for each of four confluence layers that agrees: RSI on the right side of 50, close on the right side of a 144 EMA, the same EMA test on a higher timeframe you choose, and a volume burst above its 20-bar average. A turn with at least the minimum score (two by default), far enough from the last signal in that direction, becomes a BUY or a SELL. Each signal comes with a stop and five targets at fixed percentages of the entry, drawn as lines with price tags, and a plate with the score as stars. Around that sit momentum markers at RSI extremes and a twenty-one-row panel that includes a six-timeframe trend block.
Read literally, the way it was written
Three things in the original design surprise people, and the port keeps all three rather than tidying them. A confluence layer that is switched off adds its point, so turning layers off can only let more turns through. A new signal replaces an open trade without scoring it, so the panel's win/loss tally counts only trades that ended at the fifth target or at the stop - and a stop reached after the first target counts as a win. And the plate's height above or below the candle is an ATR the original measures only on its own signals, so the first thirteen plates of each side have no position and are not drawn. The listing states each of these in plain words.
What repaints, and what does not
By default a signal is decided when its bar closes. Target and stop checks and the momentum markers run on the forming bar, as in the original, and the forming bar is rolled back before every tick. The higher-timeframe layer reads the developing higher-timeframe bar while the chart runs and completed bars after a reload - which is what the original does too - so a signal that depended on that layer can move when the chart is reopened. Alerts fire once per bar and never for the history loaded when the indicator attaches.
How the port was verified
The engine is platform-free C#: it references no cTrader type, so the code that ships can be compiled outside the platform and replayed against a bar series. The drawing is built by the engine too - every plate with its tooltip, every hit label, the seven lines, the seven tags and all sixty-three panel cells - so the comparison covers what is drawn, not only what is computed.
Probes were derived from the original mechanically, plotting every internal series to the data window. 19,260,960 cell comparisons over 20,067 identical ICMARKETS EURUSD M5 bars, across five probe generations and twenty-seven input sweeps: zero mismatches. The same generations on XAUUSD M5 add 2,425,844 comparisons, and M15, M30 and H1 another 4,180,995 - on those charts up to three of the six trend rows read a lower timeframe, and at H1 the higher-timeframe request is the chart itself, so the timeframe had to be varied. The seven other-timeframe series were fed TradingView's own bars of each timeframe, aligned to the exact bar each context started from.
Beyond values: 22,833,382 per-bar comparisons of colours, plotted values and all thirteen alert conditions, read from TradingView's own colorer slots, at zero. And the drawn objects were read out of TradingView's chart model and compared field by field over fourteen dumps - both symbols, every panel size and position, the panel with and without its trend block, three plate wordings, levels on and off - 38,407 fields with one declared difference each and nothing else.
Nothing is declared as residue. On a live market the study and the bars it is compared with can be read on two different ticks, so the one forming bar disagrees in every column that reads it; every final capture was therefore re-taken after the market had closed for the weekend, when nothing moves.
What the comparison found
An ATR that only runs when there is a signal. The plate's height reads ta.atr(14) inside the signal block, so it executes only on signal bars, and TradingView's compiler warns about exactly that. A separate micro-script measured it: each call site keeps its own history of executions, the true range still reads the previous bar's close, not the previous execution's, and the first thirteen executions return nothing. That model reproduces every in-block execution on both symbols and every plate's height, so it ships.
An average that is skipped. The overbought marker tests rsi > level and rsi > ta.ema(rsi, 10). Pine stops evaluating at the first false, so that EMA only advances on bars where the first test passed - the second compiler warning in the script. The port evaluates it the same way; evaluating it on every bar changed the markers.
A higher-timeframe bar that closes early. On gold, the hourly bar before the daily break was delivered one chart bar later than TradingView delivers it. TradingView treats a higher-timeframe bar as complete when its session ends, not only when its hour is up. The engine now takes the earlier of the two, from the broker's own trading sessions on cTrader and from the symbol's session definition in the replay.
A fresh chart with no plates at all. Attached to a new cTrader H1 chart, the indicator drew candles, lines and the panel - and not one BUY or SELL plate. The chart had loaded too little history for thirteen signals of either side, so by the original's own rule no plate had a position yet. No comparison could see it, because on the same bars TradingView draws nothing either; its charts simply carry far more history. The indicator now loads at least 5,000 bars of the chart's history before it computes, which is where a TradingView chart starts.
A daily series that is not the daily chart. On M15, M30 and H1 the daily trend row's EMA was off on every bar, by up to three hundred-thousandths - while the arrow it drives never differed. Rebuilding TradingView's own daily closes from the EMA values it reported showed why: on those charts its daily series is assembled from the hourly bars, and on twenty-three days that is not what its daily chart shows. Fed the hourly-built closes, all three timeframes match.
One digit in one tooltip. A target of 1.118325 printed 1.11832 on TradingView and 1.11833 here. The number sits exactly between two ticks, and TradingView rounds the count of ticks, not the decimal digits - after the division the value is a hair below the tie. The formatter now does the same.
The things that are deliberately different
The panel's header carries a byline in the original; the cell ships empty here, keeping its colour and its place. The webhook's JSON leaves out the matching field for the same reason.
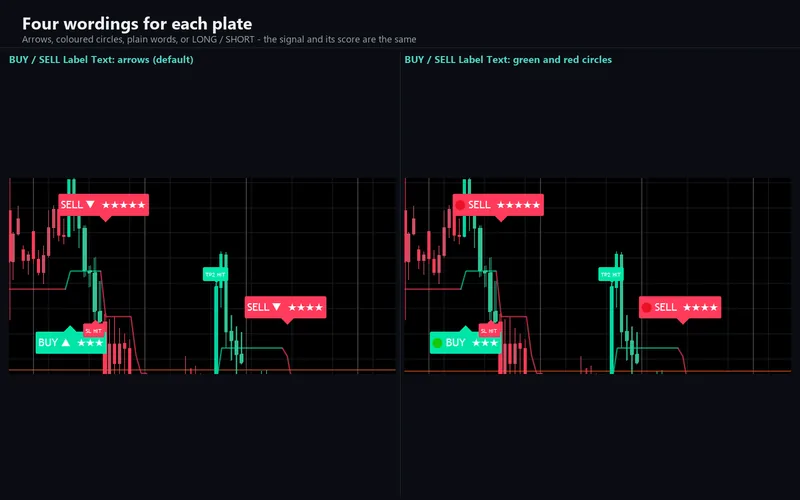
The Blackout Candles are a translucent candle painted over the chart's own in the original. cTrader can recolour a bar but not draw a second one over it, so each bar is painted in the colour that composite produces on TradingView's default candles - measured pixel by pixel, and identical in the side-by-side captures. The higher timeframe is chosen from cTrader's own timeframe list; the panel still prints the original's spelling of it. The green and red circle options for the plate text are emoji, which cTrader draws in one colour, so by default the indicator paints the disc itself, and price tags that would fall past the right edge are pulled inside the chart. The original's alert dialog becomes a cTrader group with a switch for each of the thirteen events and log, sound and e-mail delivery.
Volume on cTrader is the broker's tick volume, and here that matters more than usual: the volume burst is one of the four layers the minimum score counts, so on a live chart a turn can pass or miss the score on your broker's tick count. The parity above was run on TradingView's own bars and volume, because two different feeds cannot otherwise be compared at all.
Requirements
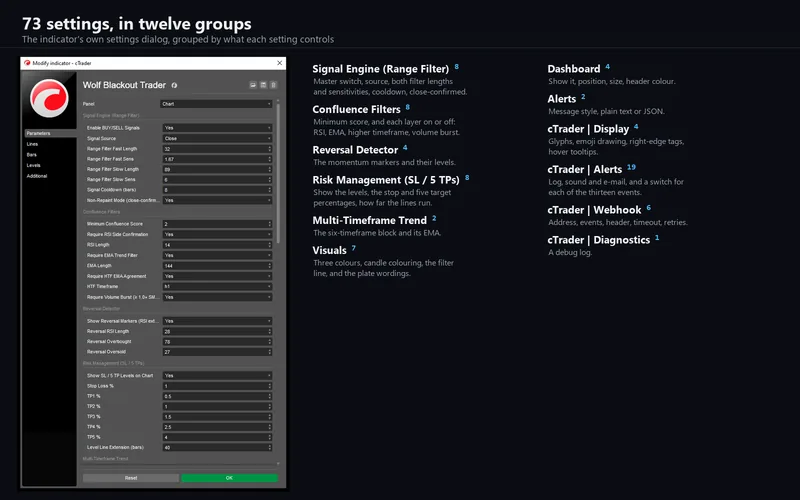
cTrader Desktop 5.x. It declares no access rights at all; the webhook posts through cTrader's own networking service, which is why it needs none. Seventy-three parameters: the forty-three of the original with the same titles, defaults, ranges, groups, order and tooltips, plus thirty cTrader-only ones for display, the alert channels, the webhook and diagnostics.
Support
Through the Discussion tab of the Store listing, so the conversation stays next to the product. Please include your broker, symbol, timeframe, cTrader version and a screenshot of the whole chart including the panel.
This is analytical software, not investment advice. It never places, modifies or closes an order, and it is built with no trading permissions at all. The drawn stop and targets are levels on a chart, not orders, and the panel's tally carries no spread, commission or slippage. Trading involves risk. Past performance does not guarantee future results.