SMC Algo Warrior for cTrader: market structure, order blocks and retest entries with a drawn plan
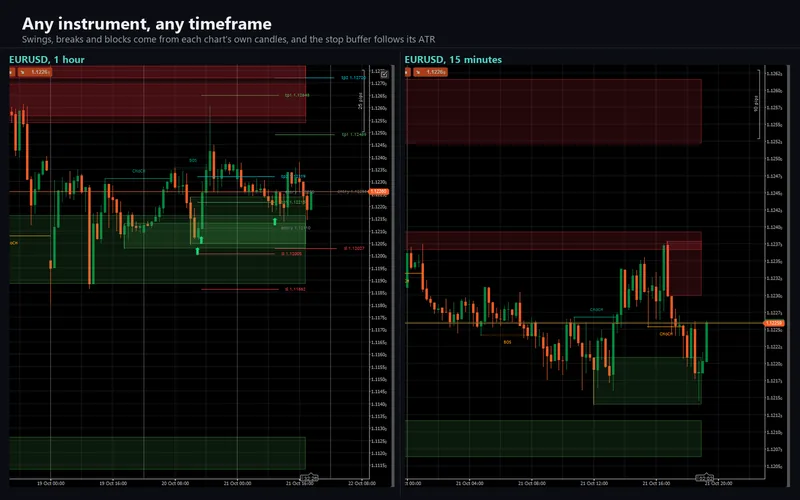
The indicator reads market structure from confirmed swings: every close beyond the last swing high or low is a break of structure (BOS) when it continues the trend and a change of character (CHoCH) when it reverses it, each drawn as a line with its label. An order block is drawn from the candle behind each break, and when price returns to a block and rejects it, a buy or sell arrow prints. Every arrow comes with an entry, an ATR-buffered stop and two risk-reward targets, drawn as lines with price tags. The cTrader edition is a C# transcription checked against the original bar by bar, cell by cell and object by object on the same bars, including the object collector, the paint order and the arrow geometry, which had to be measured before they could be reproduced.
cTrader 5.x · C# on the cAlgo API · 61 parameters in nine groups · AccessRights = None · sold on the cTrader Store, no trial
EURUSD on M5, M15 and H1 and XAUUSD on M5, replayed on the original's own bars: four reference charts, 22 input sweeps on EURUSD M5 and 19 drawn-object cases. Every swing, break, order block, mitigation, retest, trade level, arrow, alert condition, plot colour and drawn object compared against the original - values bit for bit, drawn objects field by field after the object collector - all at zero with one declared difference and nothing else: the source's two watermark tables, which carried a social handle, are not drawn.
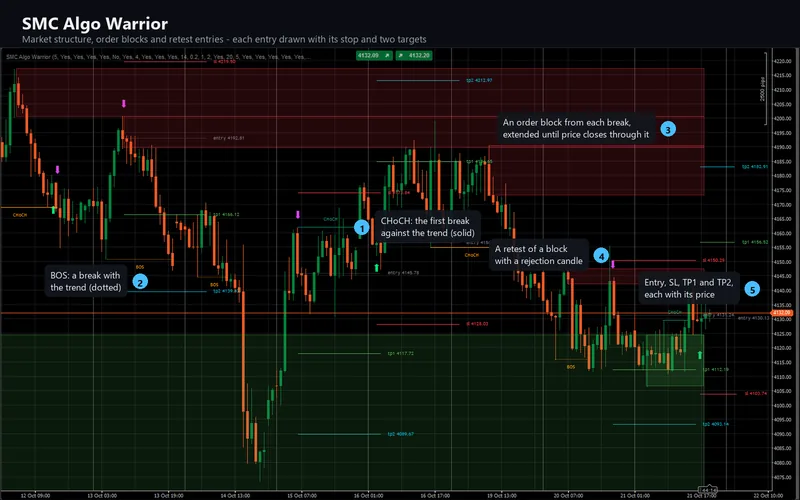
What it looks like on the chart
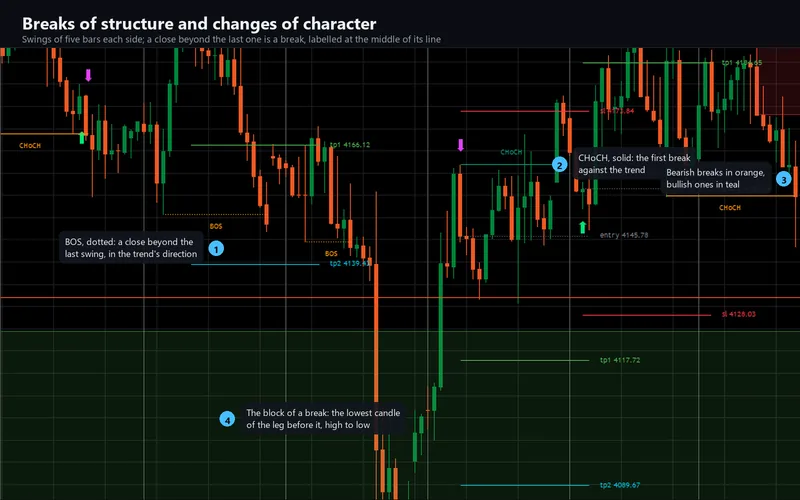
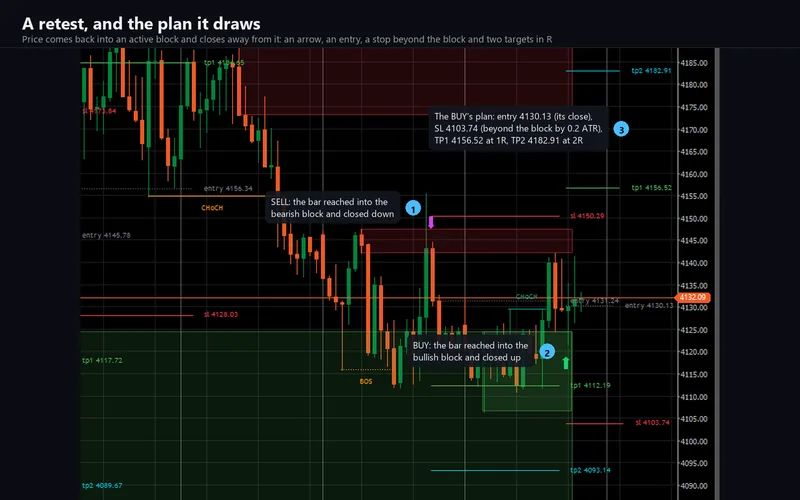
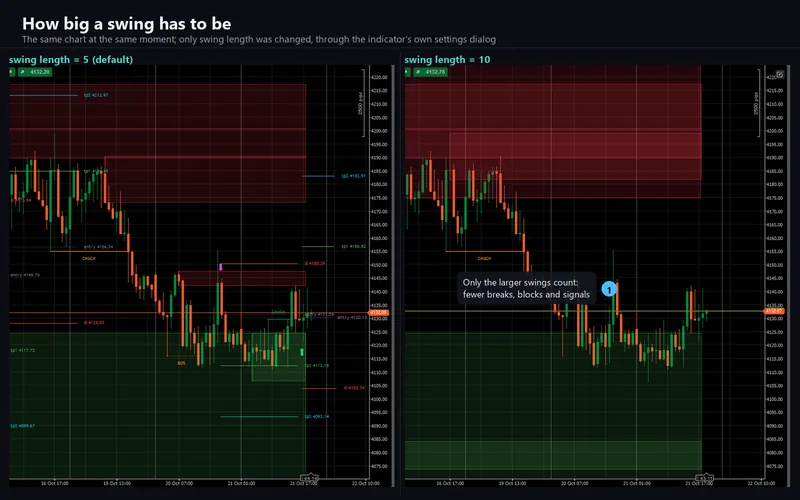
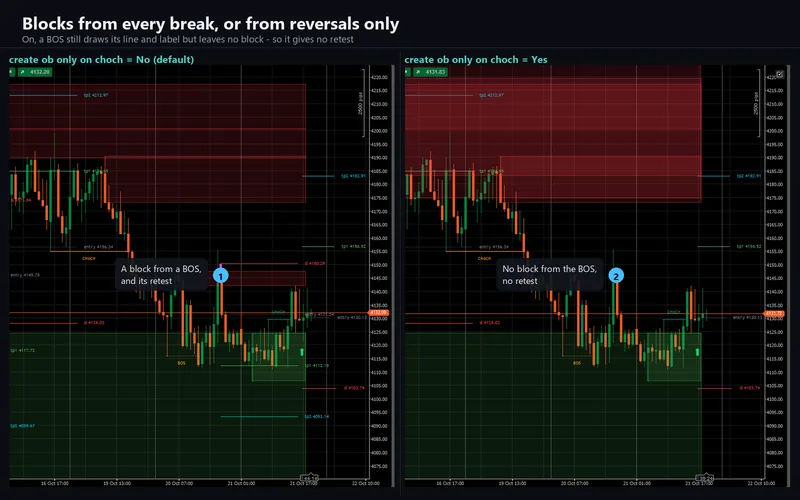
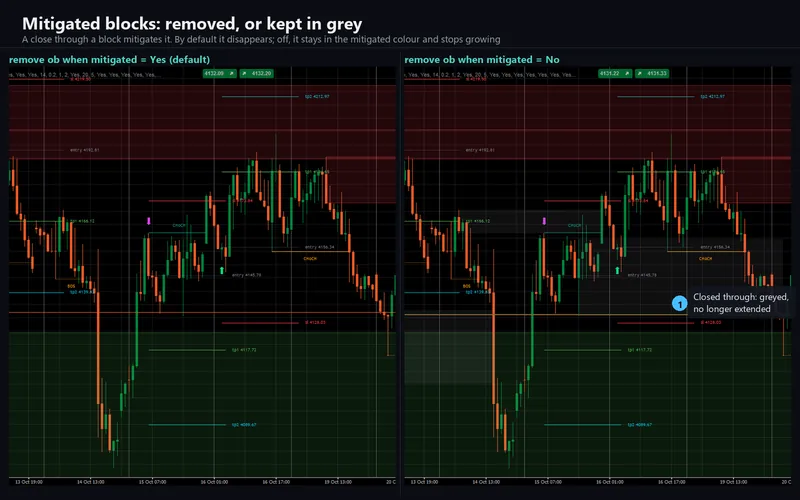
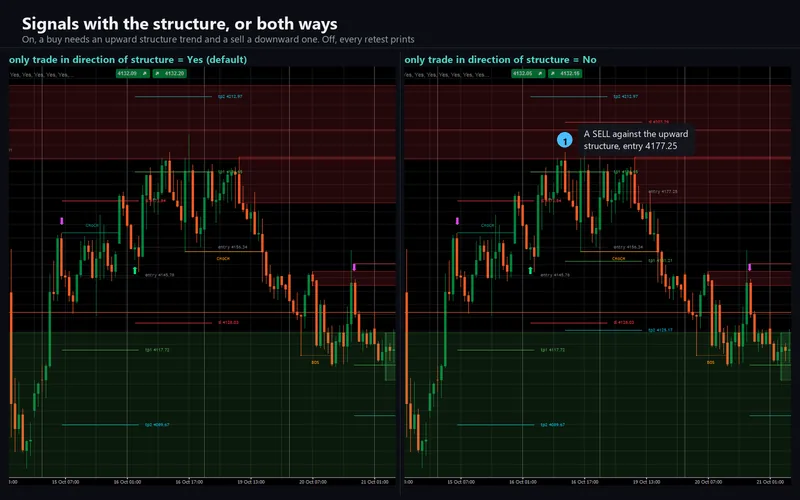
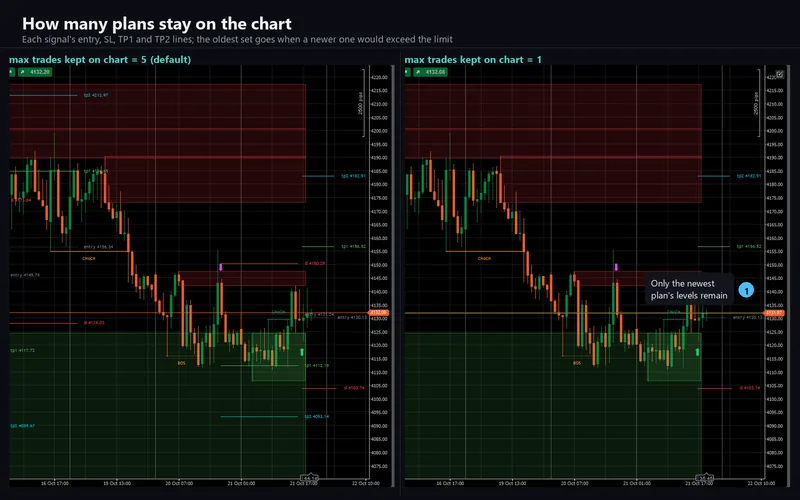
The 10 pictures of the cTrader Store gallery. Select any picture to open it full size.
What it does
The indicator reads market structure from swings. A swing high is a bar whose high is not exceeded by the five bars before it and is higher than each of the five after it; a swing low is the mirror image. The first close beyond the last unbroken swing is a break: in the direction of the current structure it is a break of structure (BOS), drawn dotted; against it, a change of character (CHoCH), drawn solid, which turns the structure trend. Each line carries its label, teal for upward breaks and orange for downward ones by default.
Each break leaves an order block: for an upward break, the candle with the lowest low since the last swing low, at most 100 bars back; for a downward break, the candle with the highest high since the last swing high. Up to four blocks of each side stay active, and a close through a block mitigates it - removed by default, or kept in grey and no longer extended.
A buy prints when a later bar reaches down into a bullish block, closes as a bullish candle and does not close below the block; a sell is the mirror image. With the structure filter on, the default, a buy needs a bullish structure and a sell a bearish one. Every arrow arrives with a plan: an entry at the close, a stop beyond the block's far edge or the signal bar's extreme by a 0.2 ATR buffer, and TP1 and TP2 at one and two times that risk, each a line running twenty bars to the right with a price tag. The five most recent plans stay on the chart.
What repaints, and what does not
Everything is decided when a bar closes, as in the original: when the next bar opens, or once the bar's own duration has elapsed with no new tick. Nothing is drawn on the forming bar, and an arrow, a break or a block never changes once drawn.
A swing is confirmed five bars after its own bar, so the break it allows can only be recognised after that; a delay, not a repaint. And the levels are a plan, not a tracker: drawn when the arrow prints, they then stay as they are. The indicator does not follow them or report whether they were reached.
On attach it loads at least 5,000 bars of the chart's history before it draws. A fresh cTrader chart can carry fewer bars than the original's platform, which leaves the swing state and the object pools younger; the calculation is unchanged.
How the port was verified
The engine is platform-free C#, compiled outside the platform and replayed against a bar series. The drawing model - lines, labels, boxes, arrows and the trade lines with their tags - is built by the engine as well, so the comparison covers what is drawn, not only what is computed.
Probes were derived from the original mechanically, plotting every internal series out to be read back, and the engine was replayed on the original's own bars. 18,010,146 value cells, 4,366,096 plot, colour and alert-condition cells and 165,410 drawn-object fields, over 26 value runs and 19 drawn-object cases: zero mismatches. Values were compared bit for bit, drawn objects field by field after the object collector had run. The runs cover EURUSD on M5, M15 and H1 and XAUUSD on M5, plus 22 input sweeps on EURUSD M5 across every drawing switch, the swing length, the ATR length, the stop buffer, the risk-reward multiples, the block cap and the plans kept.
One difference is declared, and nothing else is: the source's two watermark tables, which carried a social handle, are not drawn, and nothing replaces them.
Beyond the replay, 114 self-tests pin the engine's rules and the alert package, a mutation test plants 33 faults and requires every one to be caught, and each parameter is checked against the shipped build's own metadata. The release edition was then measured on a real EURUSD H1 chart beside the original.
What the comparison found
The object collector runs at creation, with slack. The original keeps the newest 500 lines, 500 labels and 200 boxes. Seven candidate rules were replayed against 20,892 bars of the source's own allocation pattern; one reproduced both the live count and the oldest survivor on every bar: a pool retires down to its cap when a creation takes it to the cap plus six.
Drawings paint by type, not by age. The original paints a study's plots, then lines, then boxes, then labels, whatever order they were created in: a box created after a line still covers it, and a label's text lies over every box. The renderer stacks its canvases the same way.
Arrows and labels have measured geometry. The small arrow is 15.5 px tall - a 4.5 px head, 10 px wide up and 9 px down, on a 5 px stem - with its tip 16 px from the bar's extreme, measured over 25 arrows. A tag's first ink starts 13 px right of its line's end. On the real chart the edition's labels landed within a quarter of a pixel of the original's.
What differs because the platform differs
Your candles are not the same candles. This is not a defect. Your broker's cTrader candles are not the feed the original was drawn on, and a different high or low moves a swing, a break or an order block, so a live cTrader chart can show other structure than a chart of the same symbol elsewhere. On identical bars the output is identical - that is what the figures above measure.
Trade tags are pulled inside the chart. The original runs its level lines and tags into the empty space right of the last bar; cTrader has no such space by default. With Clamp Right-Edge Labels on, a tag whose bar lies past the right edge is kept inside the chart and its line ends where the tag starts. Off, the lines run off-screen as on the original.
Alerts are the platform's. One switch per condition - buy, sell, bullish CHoCH and bearish CHoCH - then a log line, a sound (cTrader's own or a .wav of yours) and e-mail, each with its own switch, plus a test on start. There is no bar-close or intrabar choice: every condition is set on a confirmed bar in the original too. Nothing fires for the history loaded on attach or in a backtest, and each event is delivered once per bar.
The webhook is this edition's own; the original has none. It posts the same four events, each with its own switch, to an address you enter - a JSON body, the plain alert sentence, or your own template with seventeen placeholders - with an authorisation header and one extra header, a timeout, retries on anything but a success answer, and a test on start. It stays off until you enter an address, sends once per event per bar, is capped at twenty posts a minute, and goes through cTrader's own networking service, which is why the indicator needs no access rights.
Object limits are kept, and can be lifted. With Keep Chart Object Limits on, the oldest lines, labels and boxes retire past 500, 500 and 200 exactly as on the original; off keeps every structure line and label since the first bar, a cTrader-only choice.
Requirements
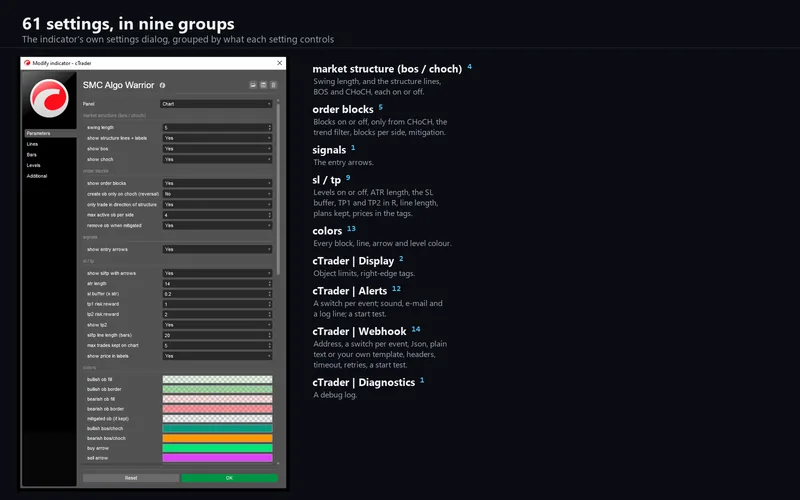
cTrader Desktop 5.0 or later; built and verified on 5.10.20. It declares no access rights at all - AccessRights = None - and reads the chart's own open, high, low and close only: no volume, no tick data, no other timeframe. Any instrument, any timeframe. 61 parameters in nine groups: the original's 32 inputs with the same titles, defaults, ranges, groups and order, plus 29 cTrader-only settings for display, alerts, the webhook and diagnostics.
Support
Through the Discussion tab of the Store listing, so the conversation stays next to the product. Please include your broker, symbol, timeframe, cTrader version and a screenshot of the whole chart with the legend row visible, since it prints every setting in order.
This is analytical software, not investment advice. It never places, modifies or closes an order, and it is built with no trading permissions at all. The drawn levels and zones are levels on a chart, not orders. Trading involves risk. Past performance does not guarantee future results.