Supreme Dynamic Profile for cTrader: a volume profile that becomes key levels
A volume profile is built from the most recent bars - or, in dynamic mode, from the bars since the latest confirmed pivot - and read for its point of control, its value area and its volume peaks and troughs. Those stay on the chart as zones and lines, green above price and red below, and every bar that breaks one, rejects one or returns to retest one is marked. A metrics table sums up where price stands against the profile. The cTrader edition is a C# transcription checked against the original bar by bar, cell by cell and object by object on the same bars, including three platform behaviours that had to be measured before they could be reproduced.
cTrader 5.x · C# on the cAlgo API · 116 parameters in fifteen groups · AccessRights = None · sold on the cTrader Store, no trial
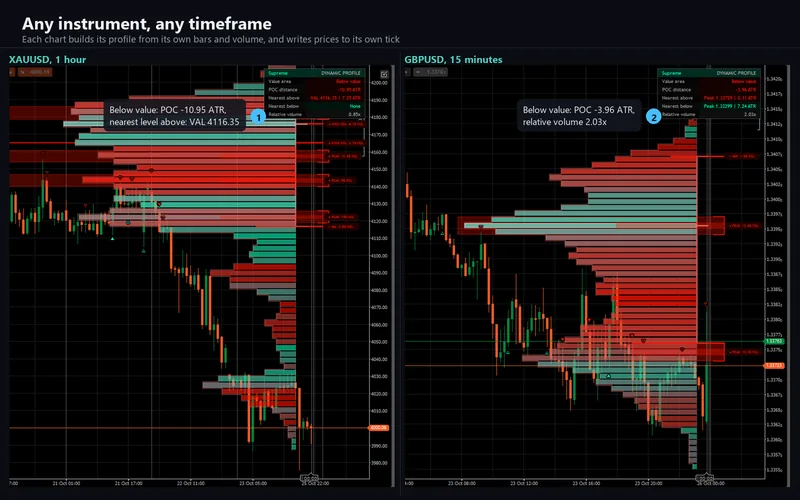
EURUSD on M15, M5 and H1 and XAUUSD on M5, across six probe generations and the input sweeps, because a profile's behaviour depends on how much history and volume a timeframe carries. Every profile, row, value area, node, level, touch, break, rejection, retest, alert condition, plot, colour and drawn object compared against the original, all at zero with two declared differences and nothing else: the original's watermark table is not drawn, and the metrics header's left cell carries this product's name. Zero was the acceptance bar, set before any C# was written.
What it looks like on the chart
The 11 pictures of the cTrader Store gallery. Select any picture to open it full size.
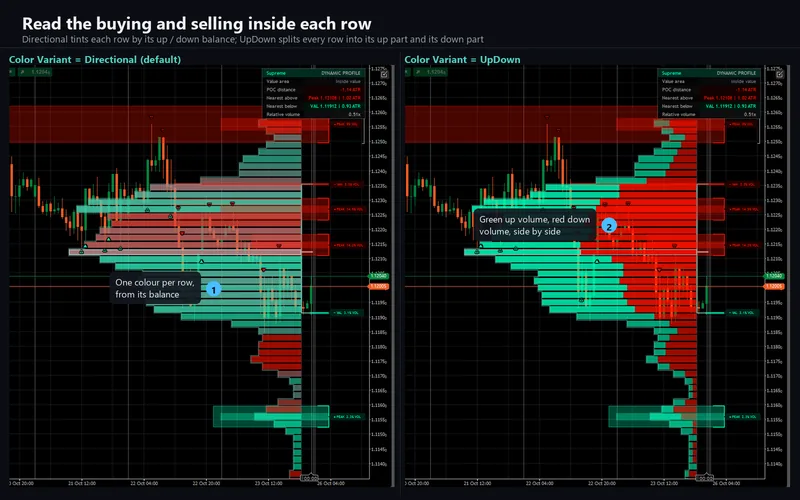
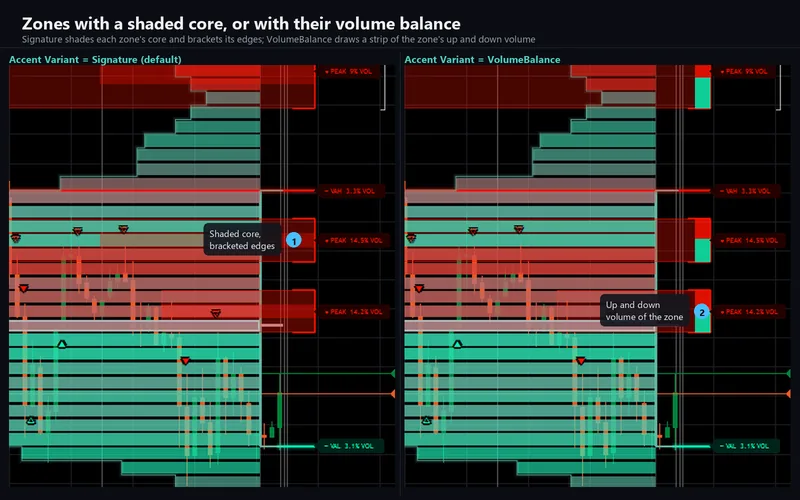
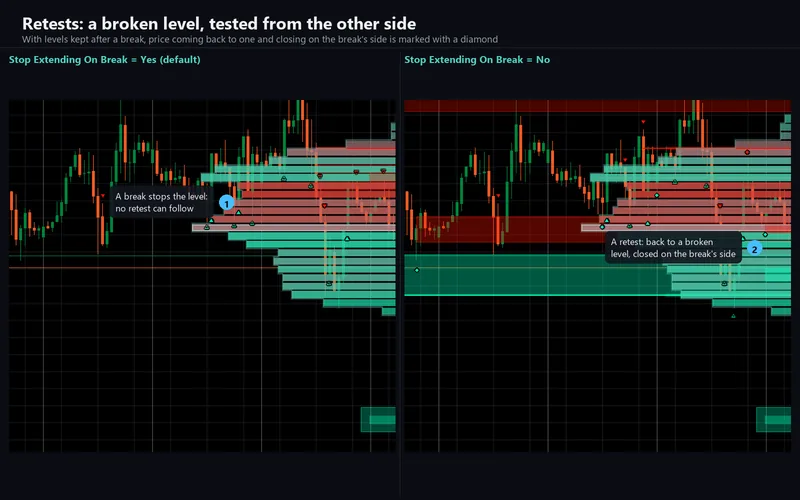
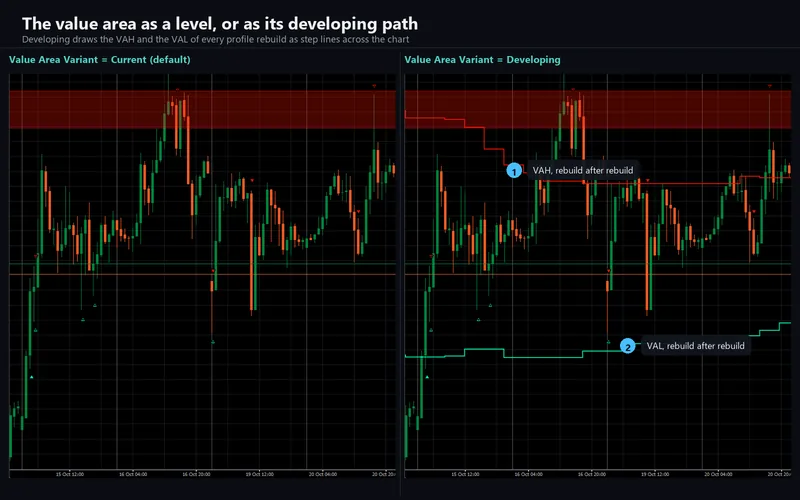
What it does
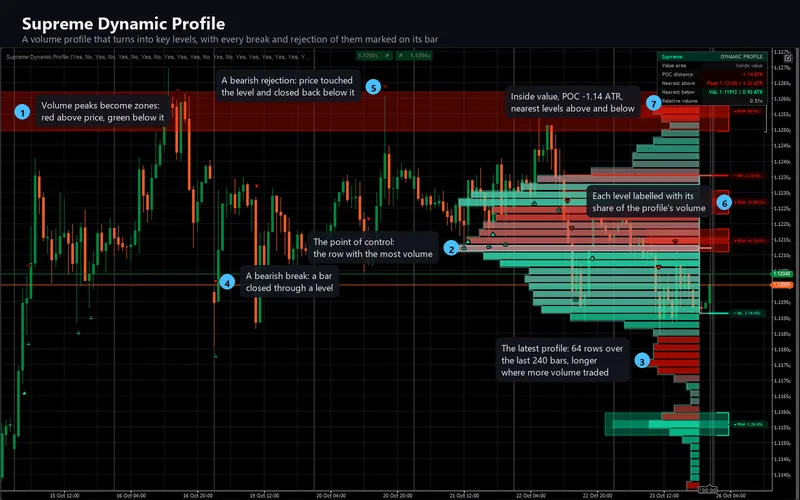
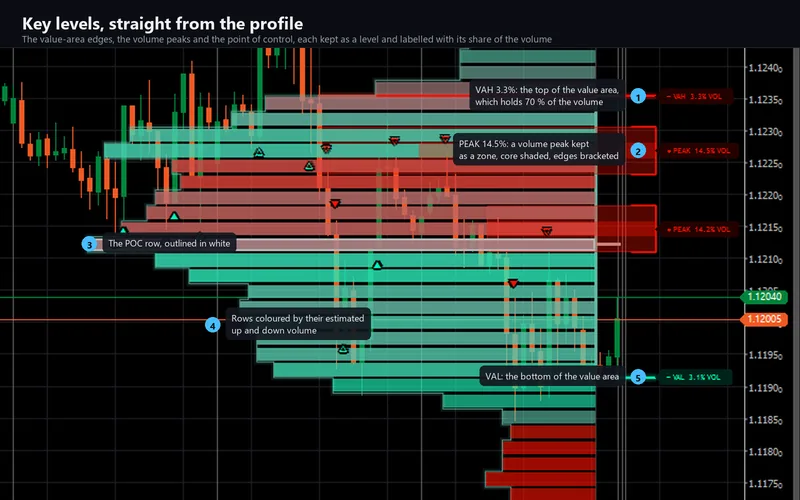
The indicator builds a volume profile from the most recent bars and turns it into a set of levels you can trade against. It splits the profile's price range into bands, measures how much volume traded in each, and from that reads the point of control, the value area and the volume peaks and troughs. Those become zones and lines that stay on the chart, and every bar where price breaks one, rejects one or comes back to retest one is marked.
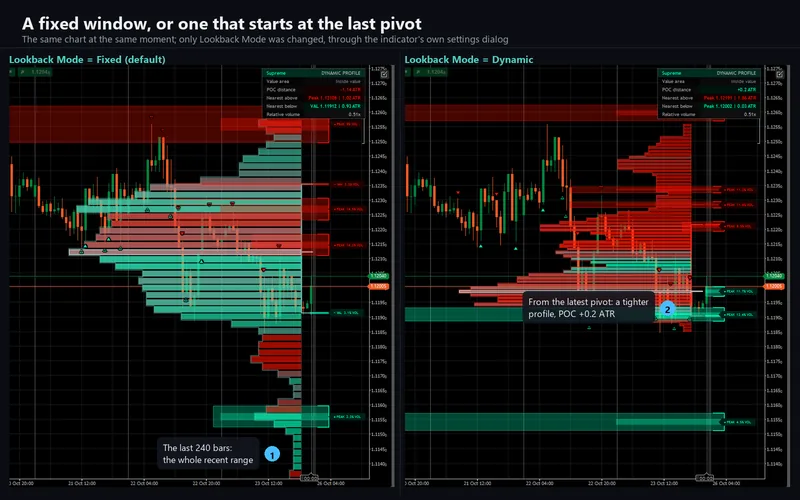
The window is the last 240 bars by default. In dynamic mode it instead starts at the latest confirmed pivot high or low, so the profile re-anchors itself to the swing the market is actually trading inside rather than a fixed count of bars.
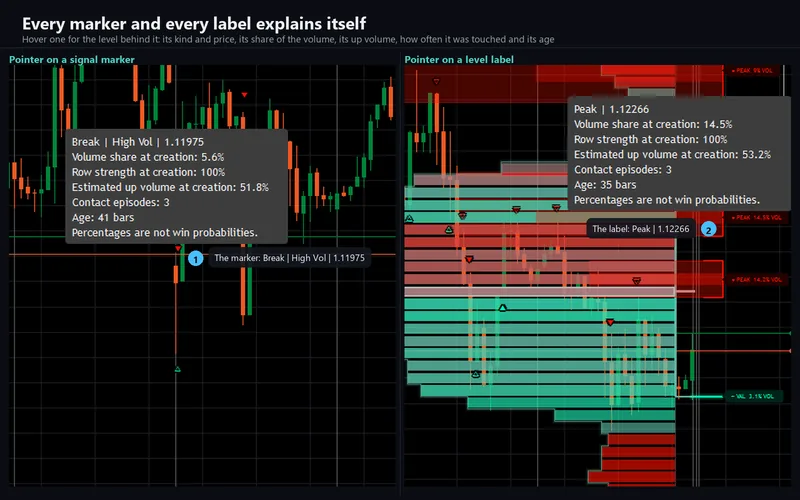
Each level is green while price is above it and red while price is below it, so support and resistance read at a glance without working out which side you are on. A filled triangle marks a break, a hollow triangle a rejection and a diamond a retest - under the bar for bullish, over it for bearish. Rest the pointer on any marker or label and it explains itself: the level's kind and price, its share of the profile's volume, the row's strength, the up volume inside it, how often it has been touched and how old it is.
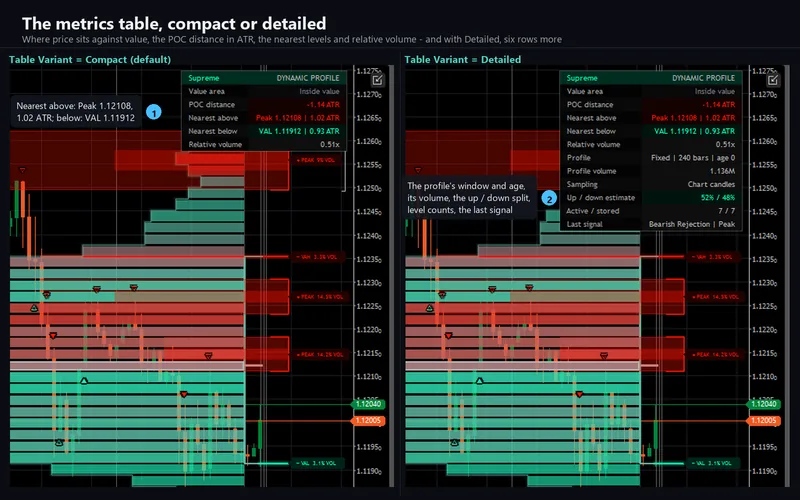
Above that sits a metrics table: whether price is inside, above or below value, the distance to the point of control measured in ATR, the nearest level above and below, and relative volume. A detailed variant adds the profile's window, its volume and up/down split, the level counts and the last signal.
What repaints, and what does not
Level events and profile rebuilds run on confirmed bars, as in the original. A bar is committed once it has closed - when the next bar opens, or once its own duration has elapsed with no new tick. The level visuals, the latest profile and the table follow the forming bar, previewed and rolled back on every tick, which is what the original does too.
One thing is worth knowing before you judge a level: a profile builds only inside the last Calculation History bars, and whether a given rebuild happens at all depends on how many bars the platform has loaded. The original's own tooltip warns that a moving start window can change the initial level state after a reload. This edition loads at least 5,000 bars when it attaches - more if your settings need more - and recomputes from the first bar whenever cTrader loads further history, so the state settles rather than drifting.
How the port was verified
The engine is platform-free C#: it references no cTrader type, so the code that ships can be compiled outside the platform and replayed against a bar series. The drawing is built by the engine as well - the profile's rows, the zones, the lines, the label column, the markers and the table - so the comparison covers what is drawn, not only what is computed.
Probes were derived from the original mechanically, plotting every internal series out to be read back. 179,335,885 value-cell comparisons across six probe generations, 10,223,865 step-plot colour cells and 155,487 drawn-object fields, over 233 runs: zero mismatches. The runs cover EURUSD on M15, M5 and H1 and XAUUSD on M5, because the profile's behaviour depends on how much history and volume a timeframe carries. Every profile, row, value area, node, level, touch, break, rejection, retest, alert condition, plot, colour and drawn object matches bar by bar on identical bars.
Two differences are declared, and nothing else is: the original's bottom-right watermark table is not drawn, and the metrics header's left cell carries this product's name instead of the source's. Both are deliberate - a chart visual on the cTrader Store carries no social handle.
What the comparison found
Reproducing the original to the cell meant measuring how its platform actually behaves rather than how the documentation reads, and three of those measurements corrected rules carried in from earlier ports.
Colour gradients are not interpolated the obvious way. A gradient between two colours premultiplies each endpoint by its own unit alpha, interpolates, then divides by the interpolated alpha. Measured across 622 cases - opaque and translucent alike - that model reproduces every output colour exactly, in the float order the script writes them. The intuitive straight interpolation does not.
Sorting is stable, and by exact value. The row ranking uses a sort that orders values 5×10-11 apart rather than treating them as tied, even though the platform's equality comparison elsewhere carries a 10-10 tolerance. Levels are ranked by volume, so two rows that are almost equal must come out in the same order as the original or the level column differs.
The drawn objects can lag the series by one tick while the market is open. On a live market the study and the bars it is compared with can be read on two different ticks, so the forming bar disagrees in every column that reads it. Every final capture was therefore fed from the study's own bars, which removes the race rather than waiting for the market to close.
The platform's object ceilings are mirrored too: with Keep Chart Object Limits on, the oldest boxes, lines and labels retire at 500 each and polylines at four, exactly as they do on the original. Switching it off keeps every object, which is a cTrader-only choice.
What differs because the platform differs
Your candles are not the same candles. This is the one difference that matters most and it is not a defect. A volume profile is built from volume, and your broker's cTrader candles and tick volume are not the original platform's feed. So a live cTrader chart's profiles, nodes and levels will differ from a chart of the same symbol elsewhere. On identical bars the output is identical - that is what the figures above measure, and a same-data replay on a real chart shows it side by side.
The profile is pinned inside the chart. The original leaves empty space to the right of the last bar, and draws its histogram and label column out into it. cTrader has no such space by default, so while the last bar is on screen the whole group shifts left just enough to fit inside the plot, with the original's internal spacing kept - it can overlap the newest candles. Switch the pin off and the original's exact anchors are used instead, reachable with cTrader's chart shift.
Tooltips and alerts are the platform's. cTrader has no label tooltip, so the hover text is drawn by the indicator itself in a measured box. The alert dialog is replaced by a group of nine switches - the source's own condition titles, verbatim - each with pop-up, log line, sound and e-mail, plus a test on start. Every condition is set on a confirmed bar in the original as well, so there is no earlier moment to fire at.
Lower-timeframe data has a shorter tail. Where the original asks for intrabars, this edition builds them from cTrader's minute bars, or from ticks for sub-minute requests. cTrader's tick history is shorter, so on the oldest bars it falls back to the chart candle - which is what the original itself does wherever intrabars are missing, and the table reports how many bars fell back.
Requirements
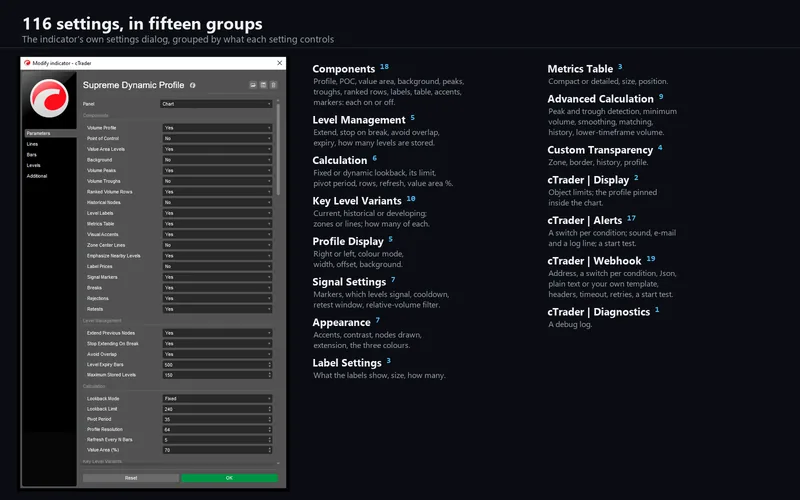
cTrader Desktop 5.x. It declares no access rights at all - AccessRights = None - and the webhook posts through cTrader's own networking service, which is why it needs none. 116 parameters in fifteen groups: the original's own settings with the same titles, defaults, ranges, groups and order, plus the cTrader-only ones for the pin, the alert channels, the webhook and diagnostics.
Support
Through the Discussion tab of the Store listing, so the conversation stays next to the product. Please include your broker, symbol, timeframe, cTrader version and a screenshot of the whole chart including the metrics table.
This is analytical software, not investment advice. It never places, modifies or closes an order, and it is built with no trading permissions at all. The drawn levels and zones are levels on a chart, not orders. Trading involves risk. Past performance does not guarantee future results.