Supreme Momentum Confluence for cTrader: six oscillators, one score, filtered signals
Six momentum and money-flow readings - RSI, the smoothed stochastic, CCI, the MACD histogram, rate of change and the Money Flow Index - are rescaled to one -100 to +100 range and averaged by weight into a single score, with a signal line beside it. A cross of the score over that line becomes a BULL or BEAR signal only when at least 60 % of the component weight agrees and the score is moving the same way, with an optional higher-timeframe filter and an optional ADX filter. Each signal maps an ATR stop and three targets, the candles take the score's colour, and a dashboard of up to 30 rows shows every component and filter. The cTrader edition is a C# transcription checked against the original bar by bar, value by value and object by object on the same bars, with no tolerance anywhere.
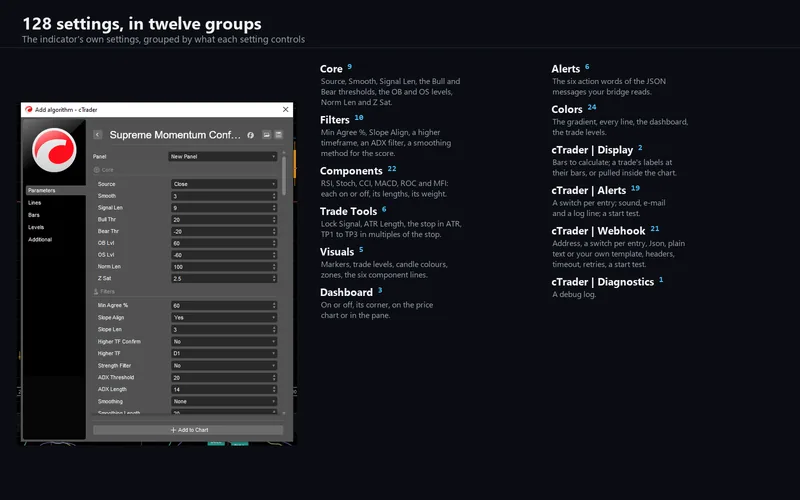
cTrader 5.x · C# on the cAlgo API · 128 parameters in twelve groups · AccessRights = None · sold on the cTrader Store, no trial
Ten charts: EURUSD on M1, M5, M15 and H1, EURUSD on a Heikin Ashi M5 chart, XAUUSD on M5, BTCUSDT and SHIBUSDT on M15, ES1! on M5 and DXY on H1, across the eight probe generations and 111 input sweeps on EURUSD M5. Every raw component, score, flag, weight, blend, signal, filter state, trade state, hit flag, label change, alert payload, drawn object, table cell, tooltip, plot and colour compared against the original. No tolerance is used anywhere: floats compare bit for bit, booleans, integers and strings exactly. All at zero, with two declared differences and nothing else: the source's watermark table is not drawn, and the ten alert messages carry this product's name as their prefix.
What it looks like on the chart
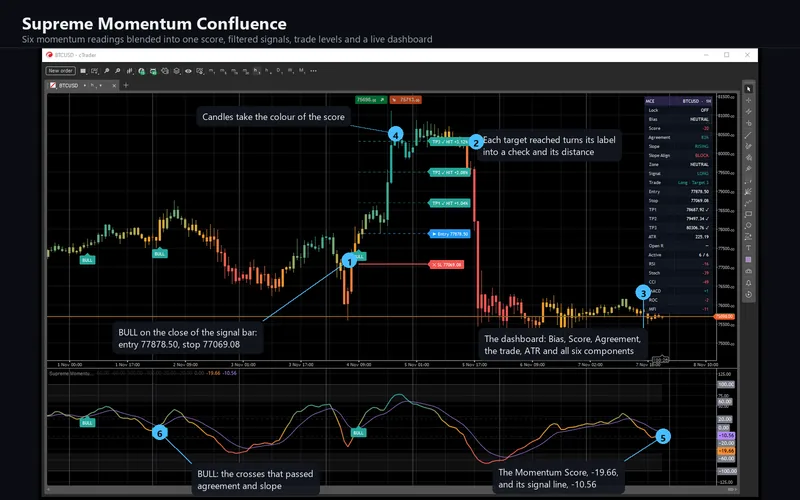
The 13 pictures of the cTrader Store gallery. Select any picture to open it full size.
What it does
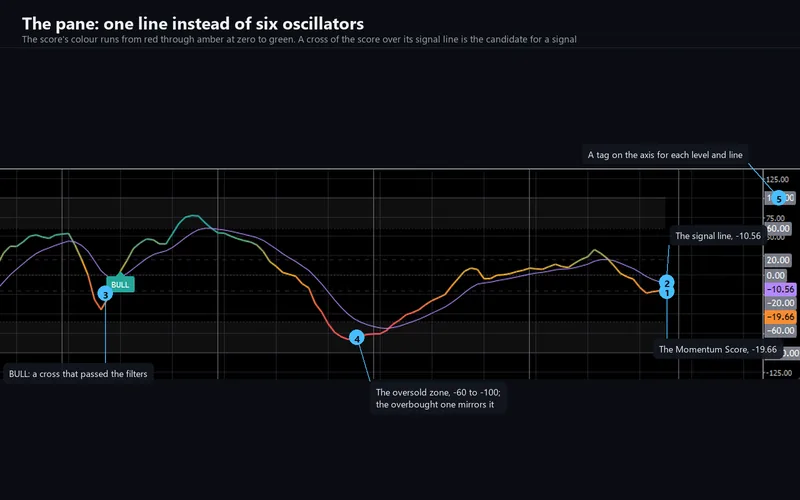
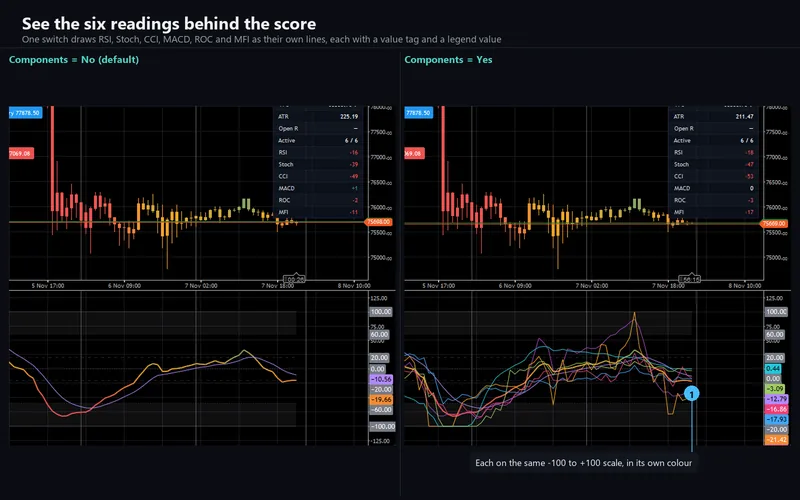
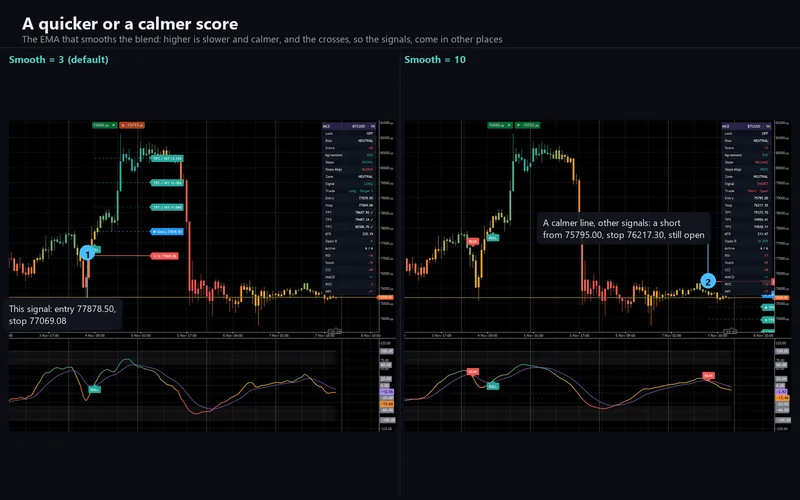
The indicator takes six momentum and money-flow readings - RSI, the smoothed stochastic, CCI, the MACD histogram, rate of change and the Money Flow Index - and rescales each to -100 to +100, the MACD histogram and rate of change as z-scores over 100 bars. The six are averaged by weight, each weight 1 by default and adjustable from 0 to 10, smoothed by a 3-bar EMA and followed by a 9-bar signal line. That is the Momentum Score: one line in its own pane in place of six oscillator panes.
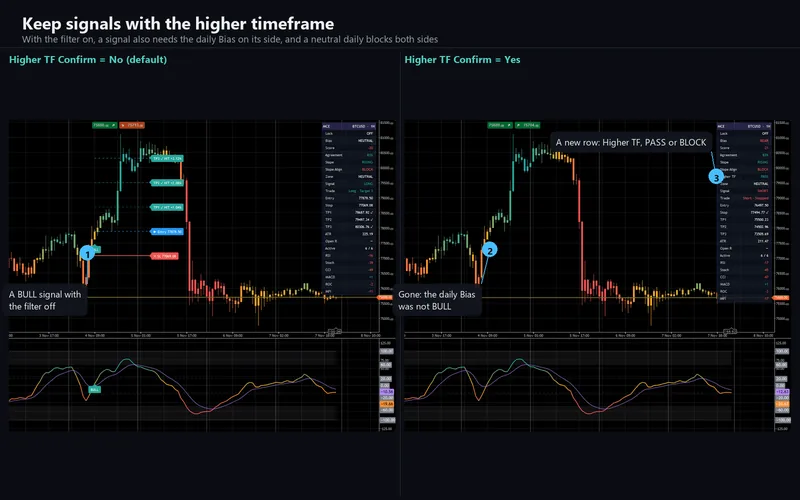
The score crossing its signal line is only a candidate. It becomes a BULL or BEAR marker when at least 60 % of the component weight points the same way and the score has been rising, or falling, over the last three bars. Two more filters are off by default: the Bias state of a higher timeframe, daily by default, and a minimum ADX of 20.
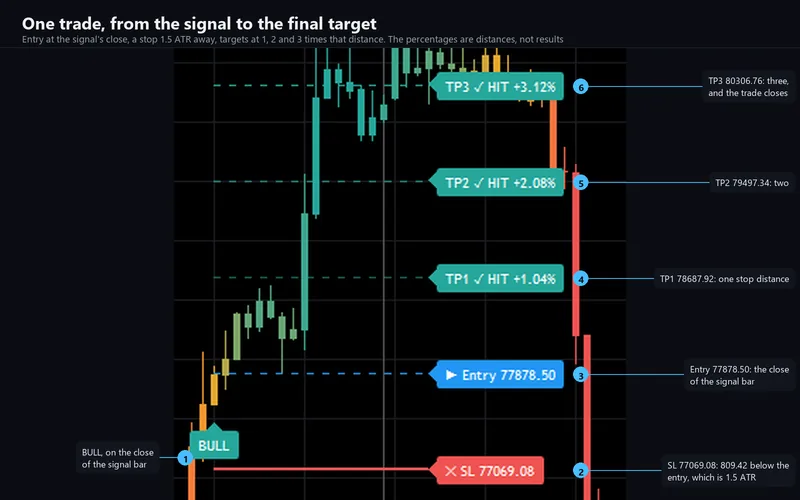
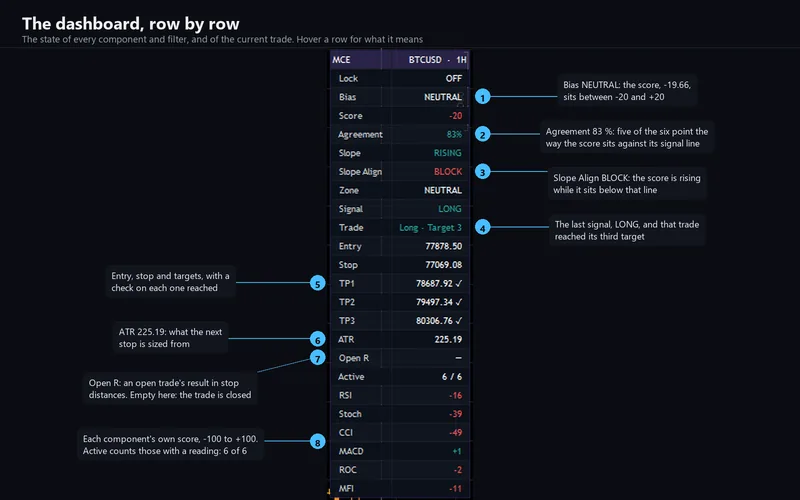
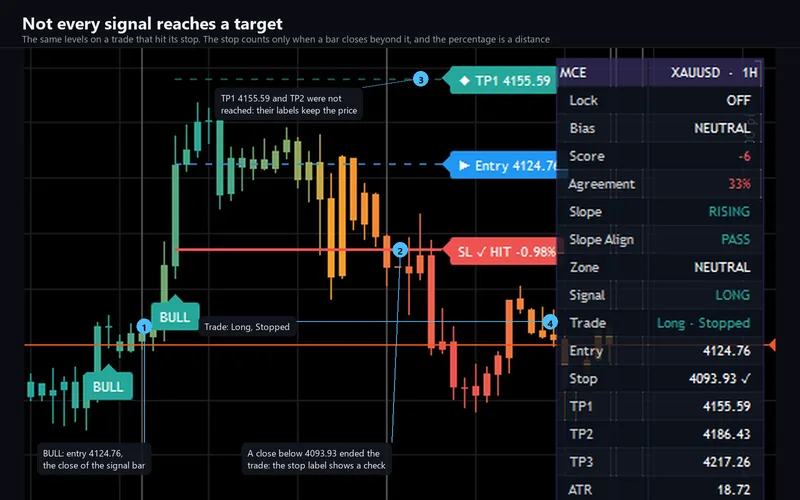
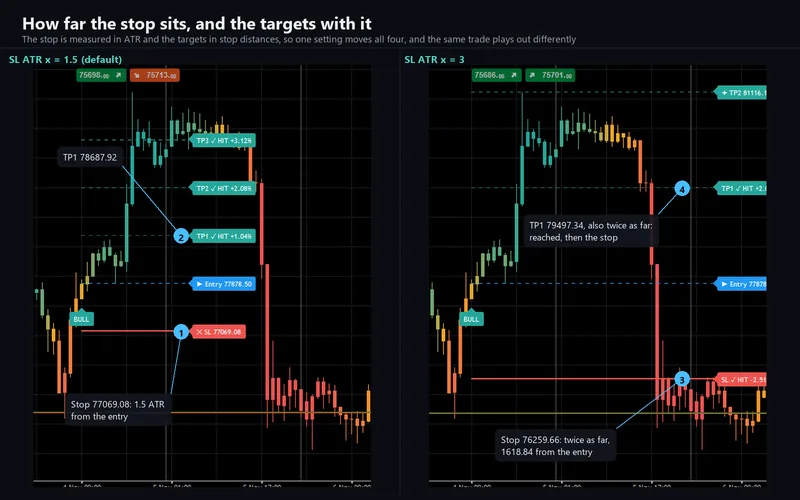
Each accepted signal arms a trade on the chart: the entry at the signal bar's close, a stop 1.5 ATR away over a 14-bar ATR, and targets at 1, 2 and 3 times that distance. A target counts on the touch, the stop only on a close beyond it, and the third target or the stop ends the trade; a new signal replaces the trade that is open. A reached level's label shows the distance from the entry in percent - a distance, not a result. The candles take the score's colour, red through amber at zero to green, and a dashboard of up to 30 rows shows every component and filter, the trade with its levels and the open result in R.
What repaints, and what does not
A BULL or BEAR marker, the trade it arms and the stop being hit are decided on the closed bar and never change afterwards. A bar counts as closed when the next bar's first tick arrives. The three targets are decided on the touch, while the bar is forming. The score, the signal line, the candle colour and the dashboard move with every tick on the forming bar, at most four times a second, and are calculated once more, for good, when it closes.
The indicator calculates the newest Bars To Calculate bars, 20,000 by default and settable from 500 to 200,000. The score settles within a few hundred bars whatever the depth, but the trade state depends on where the calculation starts, so another depth can change the earliest signals. With the higher-timeframe filter on, the state is read from that timeframe's last closed bar, so it never looks ahead.
How the port was verified
The engine is platform-free C#: it references no cTrader type, so the code that ships is compiled outside the platform and replayed against captured bars by a harness. The drawing is built by the engine as well, so the comparison covers what is drawn and sent, not only what is computed.
Probes derived from the original plot every internal series out to be read back, in eight generations from the raw components to every alert payload and every drawn object, table cell, tooltip, plot and colour. 185,506,091 values and fields compared over 285 runs on ten charts, with no tolerance anywhere - floats bit for bit, booleans, integers and strings exactly: zero mismatches. 111 of the runs are input sweeps on EURUSD M5; no sweep may leave a branch unexercised, and a mutation test requires every deliberate alteration of the engine to be caught.
Two differences are declared, and nothing else is excluded: the source's watermark table, which carried a social handle, is not drawn, and the ten alert messages start with this product's name instead of the source's, everything after that prefix verbatim.
What the comparison found
This is the first indicator of this workspace that draws in its own pane, so the pane had to be measured first. The platform's value-to-pixel call for a pane answers in the price chart's scale and its range setter does not move the display, so the engine maps values to rows itself, one row below the platform's gridlines, with the constant 14 px the autoscale adds at each end. Two outputs that never paint, at +123 and -119, put +100 and -100 within a pixel of the original's rows over pane heights from 150 to 400 px.
The standard deviation is exact, and summation order shows. Earlier ports called the original's standard deviation irreproducible; it is the square root of the exact mean of squares minus the squared exact mean. CCI's mean deviation is a plain sum, newest first: an exact sum reads the same at the default length of 20 but is off on 62 bars at length 500, and summing oldest first is off on 86. A zero deviation holds the last value, and zero means 10-10 on 0.015 × the deviation: on SHIBUSDT, with a tick of 10-8, 6.6 × 10⁻⁹ holds and 6.8 × 10⁻⁹ divides.
One source name is two numbers. The hlcc4 source, read through a source input as this indicator reads it, is (h + l + c + c) / 4. The built-in plotted directly is (h + l + 2c) / 4, and used here it is off on every bar from the fourteenth on.
What differs because the platform differs
Your candles are not the same candles. A live chart uses your broker's candles and tick volume, and volume feeds MFI, so a live cTrader chart's score can differ slightly from a chart of the same symbol elsewhere. A symbol with no volume runs on the other five components. On identical bars the output is identical, and a same-data replay on a real EURUSD M5 chart shows it side by side.
The axis and the grid are cTrader's. The pane's tick labels read 125, 75 and 50 where the original prints 120, 80 and 40, because there is no way to hide a tick label; the levels and their value tags still land on the original's rows within a pixel.
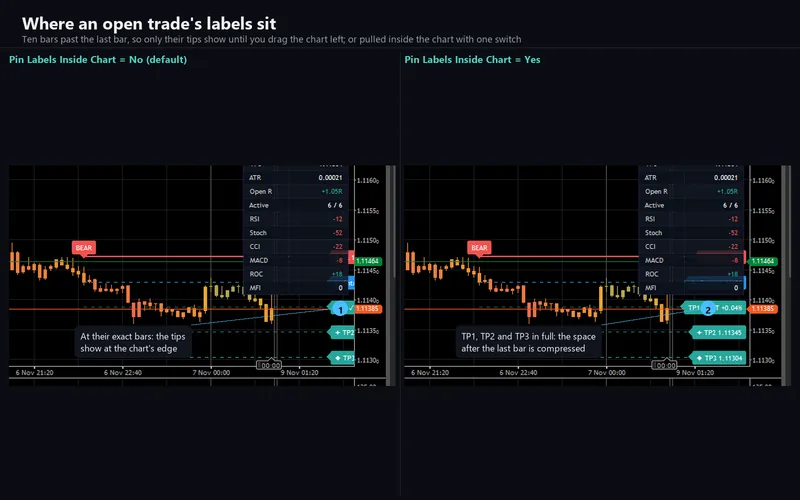
An open trade's labels sit past the right edge. They anchor ten bars past the last bar, as the original's do, and cTrader leaves little room there, so only their tips show until you drag the chart left. Pin Labels Inside Chart, off by default, compresses the space after the last bar while it is on screen so they stay inside the plot.
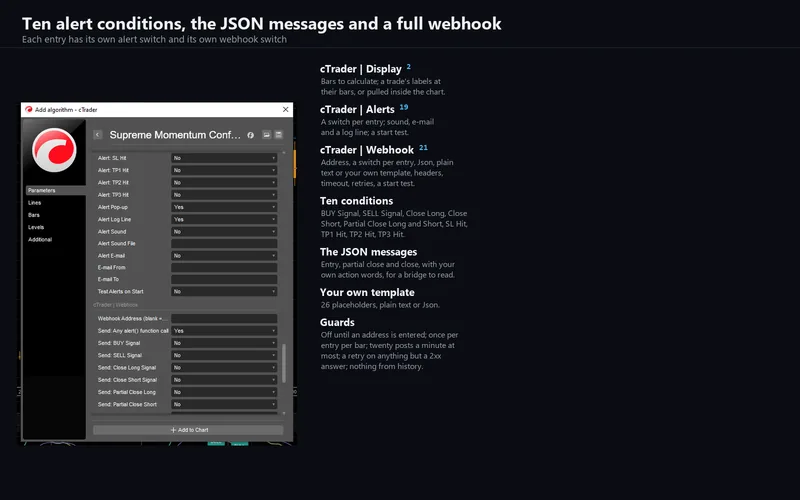
Alerts and the webhook are the platform's. The original's alert dialog becomes eleven switches - the message of each alert() call and the ten conditions - delivered as a log line, a sound and an e-mail, with a test on start. A webhook posts the same eleven to an address you enter as JSON, plain text or your own template with 26 placeholders, retries on anything but a 2xx answer and is capped at twenty posts a minute. Two targets crossed on one tick send two payloads, so a bridge does not miss a partial close. Nothing fires during the history pass or in a backtest.
The settings dialog is one row per setting. The original lays several settings on one row; cTrader cannot, so each takes its row's name - RSI, RSI Len, RSI W - with the original's tooltips verbatim. On Heikin Ashi, Renko and Range charts the indicator shows a note instead, as the original does, because those charts show synthetic prices.
Requirements
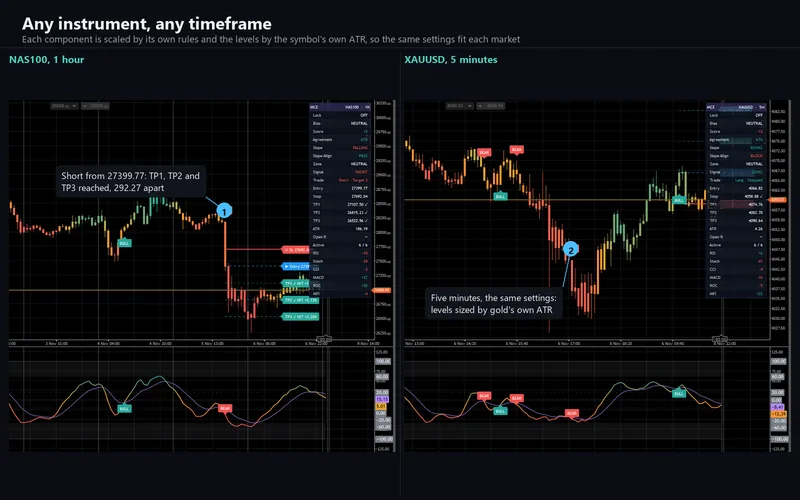
cTrader Desktop 5.x; the port was verified on cTrader 5.10.22. It declares no access rights at all - AccessRights = None - and the webhook posts through cTrader's own networking service. 128 parameters in twelve groups: the original's 85 settings, tooltips verbatim, plus 43 cTrader-only settings in four groups for display, alerts, the webhook and diagnostics. It runs on standard candle charts, on any instrument and any timeframe from one minute to daily; it was checked live on EURUSD, GBPUSD, USDJPY, XAUUSD, NAS100 and BTCUSD from 5 minutes to 1 hour.
Support
Through the Discussion tab of the Store listing, so the conversation stays next to the product. Please include your broker, symbol, timeframe, cTrader version and a screenshot of the whole chart including the pane and the dashboard.
This is analytical software, not investment advice. It never places, modifies or closes an order, and it is built with no trading permissions at all. The drawn levels and zones are levels on a chart, not orders. Trading involves risk. Past performance does not guarantee future results.