Supreme Power House for cTrader: market-structure signals, graded and planned
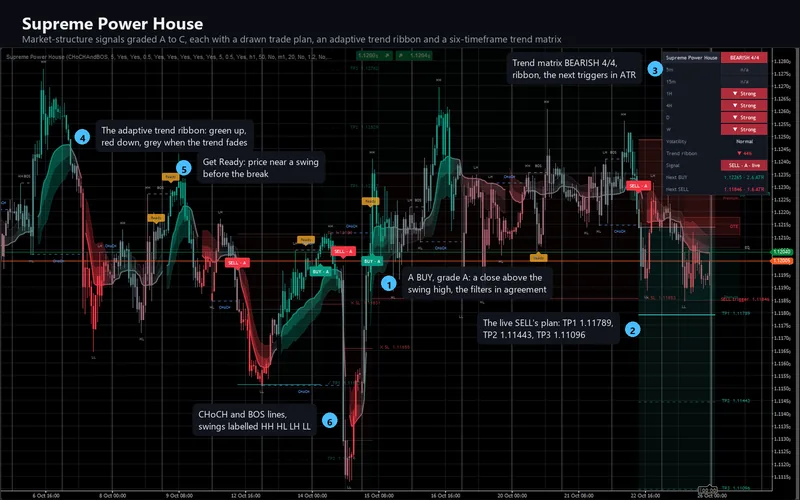
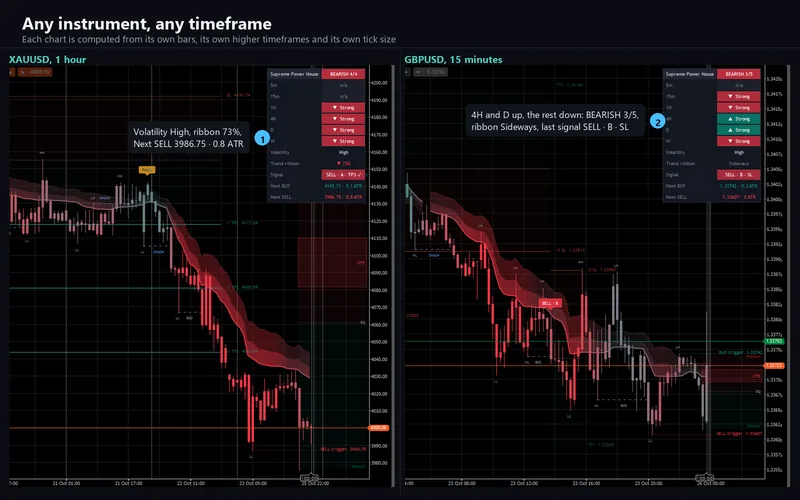
Supreme Power House finds the swings on the chart, marks every change of character and break of structure, and turns a break into a BUY or a SELL when the enabled filters agree. Each signal is graded A to C on seven checks and drawn with its entry, its stop and three targets, ticked as they are reached. Get Ready plates warn before a break, trigger lines show the next one, the OTE, equilibrium and premium / discount zones frame the current leg, an adaptive trend ribbon colours the candles, and a dashboard sums up six timeframes. The cTrader edition is a C# transcription checked against the original bar by bar, cell by cell and object by object on the same bars, then replayed on a real chart beside the original's own screenshot.
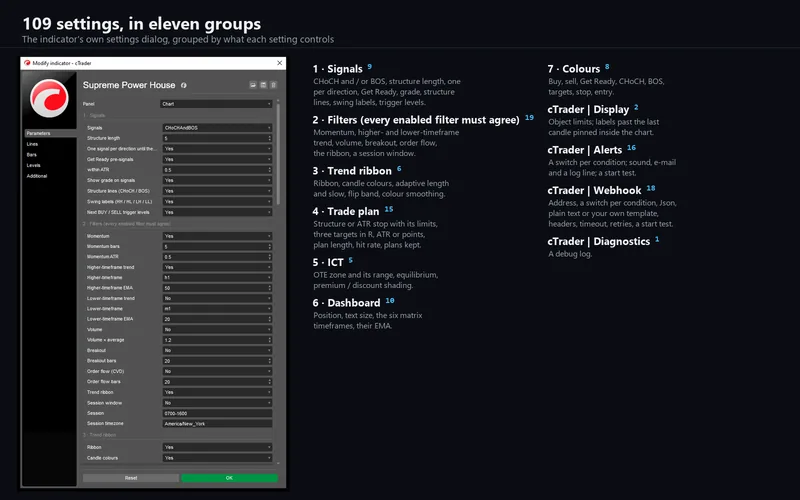
cTrader 5.x · C# on the cAlgo API · 109 parameters in eleven groups · AccessRights = None · sold on the cTrader Store, no trial
EURUSD on M5, M15 and H1 and XAUUSD on M5, with 45 input sweeps on EURUSD M5, each run replaying a capture of the original through the shipped engine. Every value series, plot, colour, drawn object and alert condition compared against the original, all at zero with two declared differences and nothing else: the source's watermark table is not drawn, and the dashboard header and the alert messages carry this product's name. Zero was the acceptance bar.
What it looks like on the chart
The 10 pictures of the cTrader Store gallery. Select any picture to open it full size.
What it does
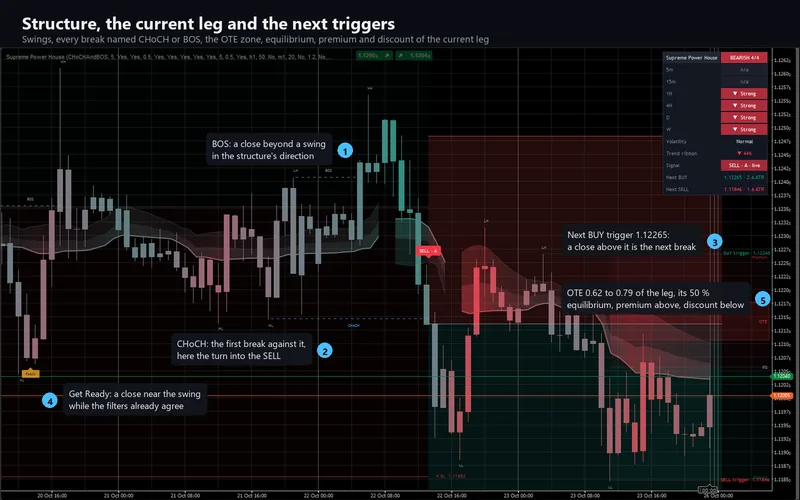
The indicator reads market structure and turns each break of it into a graded signal with a drawn trade plan. A swing is a high or low that no bar within five bars on either side exceeds, confirmed five bars later and labelled HH, HL, LH or LL. A close beyond the newest unbroken swing is a break: a change of character (CHoCH) against the structure's direction, a break of structure (BOS) with it.
A break becomes a BUY or a SELL only when every enabled filter agrees at that close. Three are on by default: momentum (at least half an ATR over five bars), the higher-timeframe trend (the last closed one-hour bar against its 50-period EMA) and the trend ribbon. Four more can be switched on: the lower-timeframe trend, relative volume, a close beyond the previous 20 bars' range, and order flow, the cumulative volume delta read from lower-timeframe bars. One signal per direction prints until the opposite one.
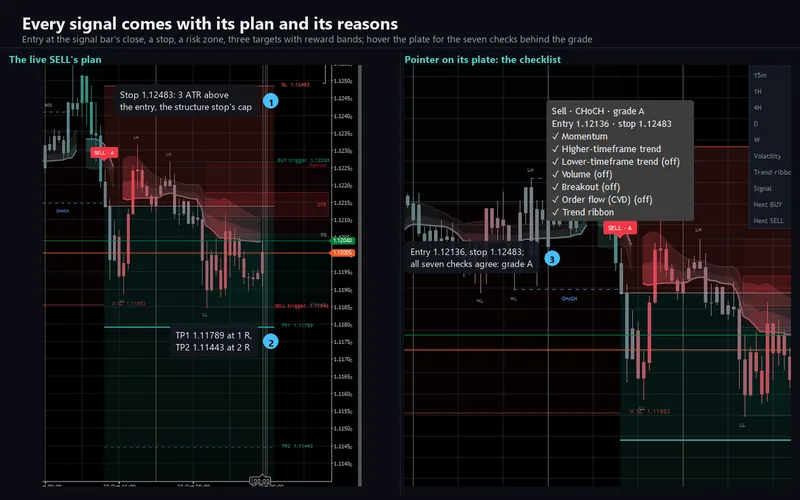
The grade is a count, not a forecast. All seven checks are counted at the signal's close, switched on or not: five or more in agreement is A, three or four is B, fewer is C.
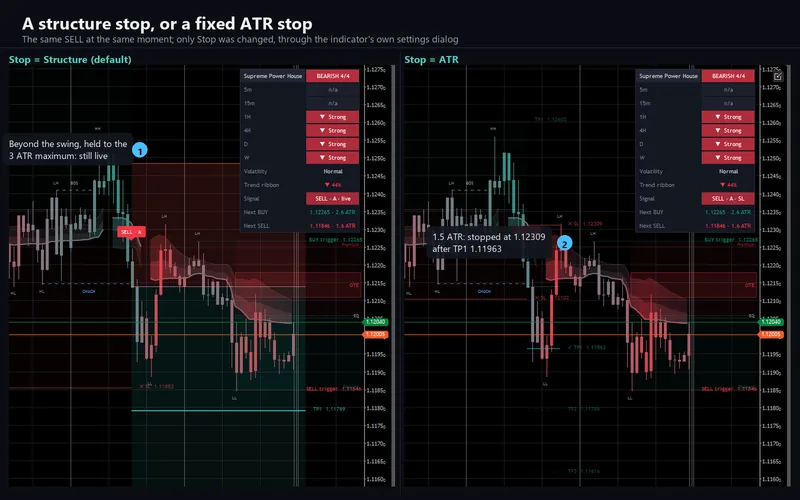
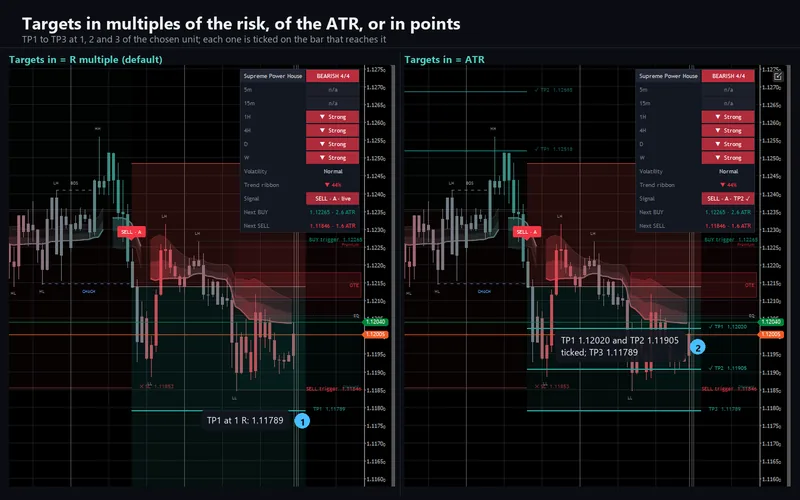
Each signal gets a plan: the entry at the signal bar's close, a stop beyond the swing the move started from plus a tenth of an ATR, kept between half an ATR and three ATR, and targets at one, two and three times the risk, or in ATR, or in price. From the next bar the plan checks the stop first, then each target, on every closed bar; a reached target gets a tick, a reached stop a cross, and the plan ends at the stop, at the last enabled target or at the next signal. The newest five plans stay drawn.
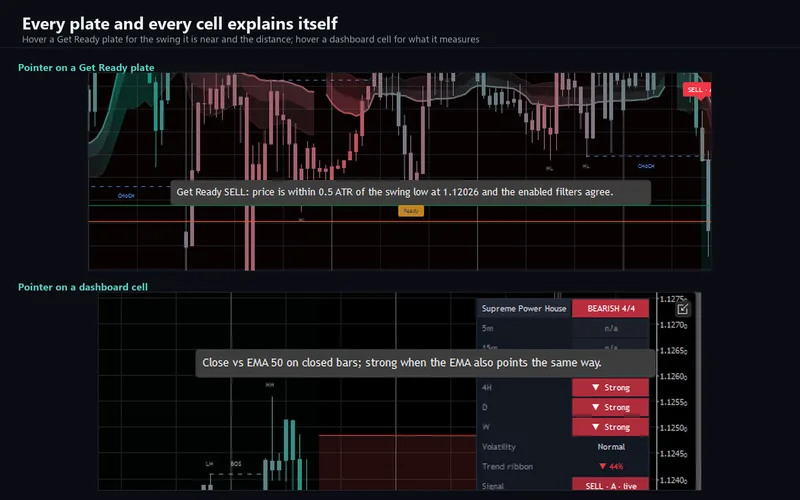
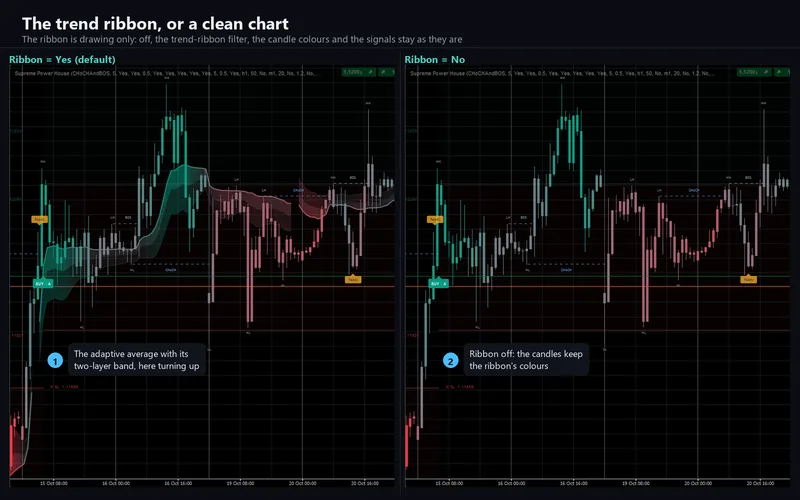
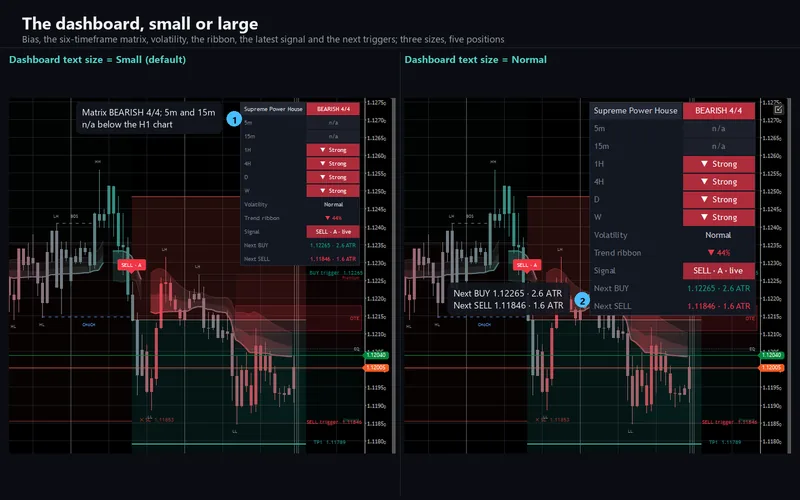
Around them: Get Ready plates when price closes within half an ATR of an unbroken swing while the filters other than momentum and breakout already agree; dotted trigger lines at the swing high and low the next signal needs a close beyond; the current leg's OTE zone (0.62 to 0.79), its 50 percent equilibrium and premium / discount shading; an adaptive Kaufman-style ribbon coloured red through grey to green by trend score, the candles with it; and a dashboard with six timeframes from 5 minutes to weekly against a 50-period EMA, the bias, volatility, the latest signal and the next trigger's distance in ATR. Since 1.1.0 the current plan is also published as eleven numeric outputs on every bar.
What repaints, and what does not
Swings, breaks, signals, grades, Get Ready plates and target or stop hits are decided when a bar closes and never change afterwards, as in the original. The ribbon, the candle colours, the zones of the current leg and the dashboard follow the forming bar.
This edition loads at least 5,000 bars when it attaches, where the original's platform loads about 20,000, so the first structure starts later in history here. The optional Hit rate on targets adds to each target label the share of this chart's closed plans that reached it, once 20 have closed; it describes the loaded past only.
How the port was verified
The engine is platform-free C# that references no cTrader type, replayed offline by a harness; it builds the drawing too, so the comparison covers what is drawn, not only what is computed.
Each run replays a capture of the original through the shipped engine, compared bit for bit and object by object. 73,115,364 value cells and 79,409 drawn-object fields over 152 runs: zero product mismatches. The runs cover EURUSD on M5 with 45 input sweeps, EURUSD on M15 and H1, and XAUUSD on M5. Beside them: 58 self-tests, 30 of 30 planted faults caught, 23 diff guards and 581 parameter checks. A private edition replaying the original's bars on a live cTrader chart matched 20,147 of 20,147 bars by open time and drew the same counts of labels, lines, boxes and cells as the harness.
Two differences are declared, and nothing else is: the source's watermark table, which carried a social handle, is not drawn, and the dashboard's header cell and the eight alert messages carry this product's name.
What the comparison found
Three measurements of how the original's platform computes changed the engine.
A cumulative sum snaps to exactly zero. The order-flow check is a running sum of volume delta. A plain running sum misses 19,711 of 20,147 bars: the original reads exactly 0.0 at four bars where plain arithmetic leaves about 2×10-15, and restarts from that zero. Adding and then snapping to zero below 10-10 is bit-exact on all 20,147 bars.
A percentile rank counts near-ties. The volatility row is an ATR percentile over 100 bars. An exact "less than or equal" missed 3 of 20,255 bars on EURUSD M15, where a window value sat above the current one by between 3.3×10⁻¹¹ and 8.4×10⁻¹¹.
Lower-timeframe data has a reach. On a 20,147-bar EURUSD M5 chart the original delivered 1-minute data only from bar 15,830, the last 4,317 bars. Before that the volume delta falls back to a split of the chart candle and the lower-timeframe check reads 0, and both feed the grade.
What differs because the platform differs
Your candles are not the same candles. Your broker's cTrader candles and tick volume are not the original platform's feed, so the volume filter, the order-flow delta and therefore the grade read your broker's volume. On identical bars the output is identical; that is what the figures above measure. On one weekend chart the edition replaying the original's bars read BEARISH 4/6 while the paid edition on the broker's feed read BEARISH 5/6.
Labels past the last bar are pinned inside the chart. The original anchors trigger labels, the EQ label, zone ends and a live plan's labels up to 20 bars past the last candle; cTrader will not pan past a margin of about 14 bars. With Pin Labels Inside Chart on, the default, the space after the last bar is compressed just enough for the widest label to fit. Off restores the original's anchors.
Alerts are switches, not a dialog. The eight conditions (BUY, SELL, Get Ready either way, TP1 to TP3 and the stop) each have an Alert: switch for the log line, a sound and e-mail, and a Send: switch for the webhook; BUY and SELL are on by default. Every channel fires once per condition on the closed bar, never during the history pass and never in a backtest. The webhook posts a JSON body, the plain alert sentence or your own template with 22 placeholders, retries anything but a 2xx and is capped at 20 posts a minute.
Timeframes and history follow cTrader. The eight timeframe inputs are cTrader timeframe parameters, and a matrix row below the chart's timeframe reads n/a. Higher-timeframe history loads with warm-up, so a live chart's higher-timeframe and matrix EMAs start warmer than the original's and converge to the same values; cTrader's 1-minute history usually reaches further back, so older grades can differ, while the newest five plans are on 1-minute data on both. With Keep Chart Object Limits on, the newest 500 boxes, 500 lines and 500 labels stay and older drawings retire; off keeps every drawing.
Requirements
cTrader 5.0 or later; built and verified on 5.10.20. It declares no access rights at all - AccessRights = None - and the webhook goes through cTrader's own networking service, which is why it needs none. 109 parameters in eleven groups: the original's 72 inputs, plus 37 cTrader-only settings in four groups for display, alerts, the webhook and diagnostics, none of which changes a calculated value. Any instrument, any timeframe from one minute to daily; on attach it loads at least 5,000 bars.
Support
Through the Discussion tab of the Store listing, so the conversation stays next to the product. Please include your broker, symbol, timeframe, cTrader version and a screenshot of the whole chart including the dashboard.
This is analytical software, not investment advice. It never places, modifies or closes an order, and it is built with no trading permissions at all. The drawn levels and zones are levels on a chart, not orders. Trading involves risk. Past performance does not guarantee future results.