Supreme Range Profile Structure for cTrader: ranges found from swings, with a volume profile inside each
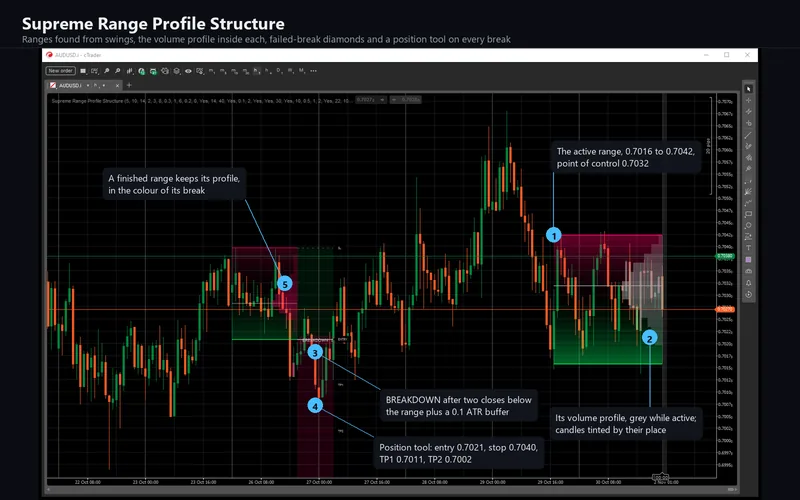
A range is drawn only when the recent alternating swing highs and lows cluster tightly enough, rotate often enough, span enough bars and fit an ATR width window, so it marks a balance the market built rather than any pause. While it is active, its edges adapt to the swings that touch them, a volume profile of up to 16 rows grows inside it with a point-of-control line, and the candles are tinted by where they close in it. A move that closes outside and back inside is marked with a diamond at its extreme; two closes beyond an edge plus a 0.1 ATR buffer confirm a breakout or breakdown and draw a position tool anchored to the range - entry at the broken edge, stop at the opposite edge, three targets in range heights. The cTrader edition is a C# transcription checked against the original bar by bar, value by value and object by object on the same bars, and then on a real chart, where eight rendering defects were found by pixel comparison and fixed in the shipped build.
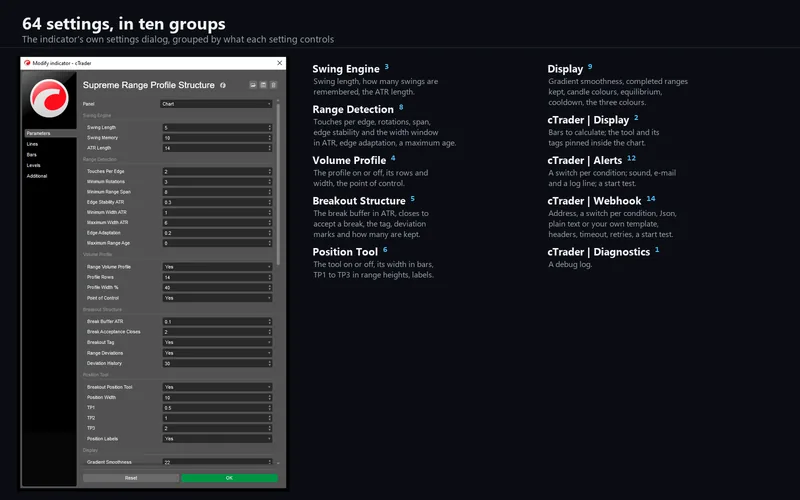
cTrader 5.x · C# on the cAlgo API · 64 parameters in ten groups · AccessRights = None · sold on the cTrader Store, no trial
Seven charts - EURUSD on M5, M15 and H1, XAUUSD on M5, the dollar index on H1 and two crypto pairs on M5 and M15 - across four probe generations: the range state, the profile rows and the find-range result, the swing memory, and the dump of every drawn object with the bar colours. 224 of the 254 runs are on the EURUSD M5 chart, where the inputs were swept. Values compare exactly, with no tolerance declared anywhere; drawn objects compare field by field in creation order. Every swing, range edge, touch, profile row, point of control, deviation, break, position level, alert condition, colour and drawn object is at zero, with two declared differences and nothing else: the source's watermark table is not drawn, and the four alert messages begin with this product's name.
What it looks like on the chart
The 10 pictures of the cTrader Store gallery. Select any picture to open it full size.
What it does
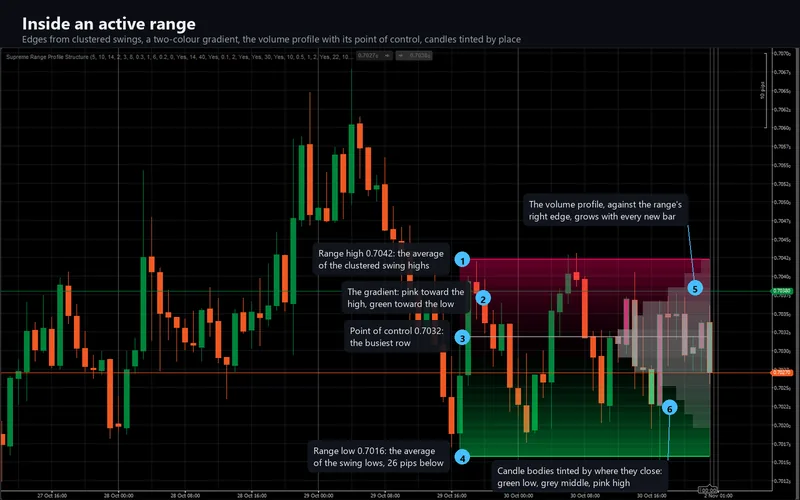
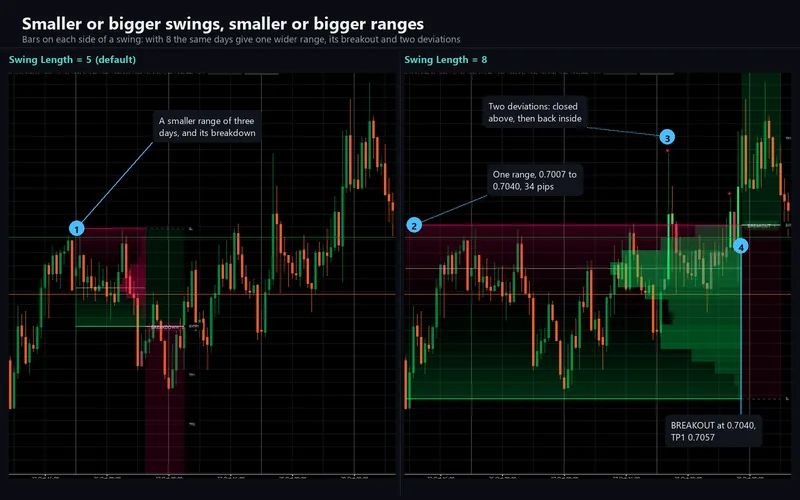
The indicator finds sideways ranges from the chart's own swing highs and lows. A swing is a bar whose high or low no bar within Swing Length bars (5 by default) on either side exceeds. The newest ten alternating swings are searched for the largest group whose highs spread no more than 0.6 ATR and whose lows do the same, with at least two touches on each edge, three rotations between them, at least eight bars of span, and a height between one and six ATR. The averages of those highs and lows become the edges.
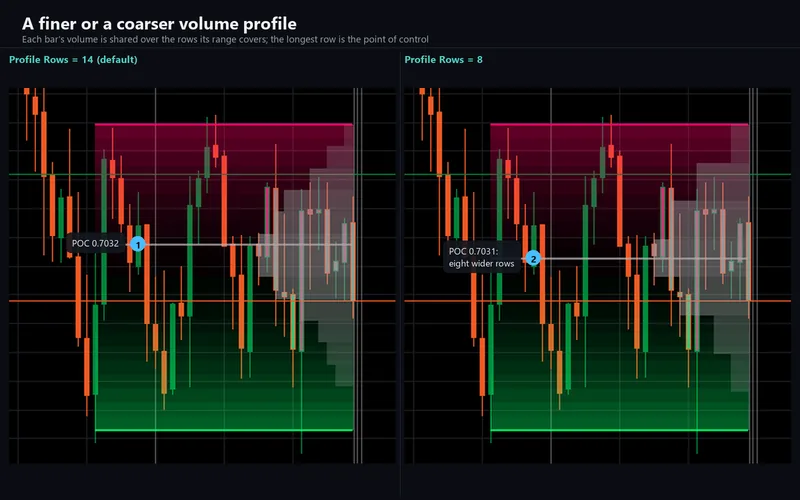
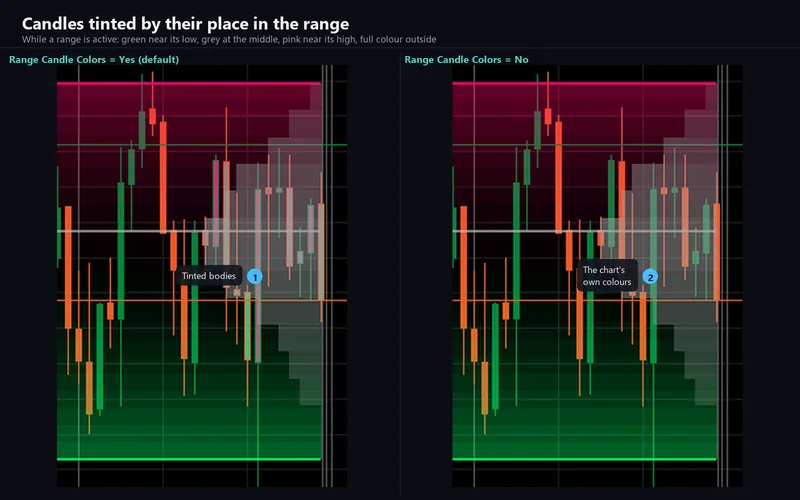
While a range is active, a swing that comes close to an edge moves it a fifth of the way toward the swing and counts as a touch. A volume profile grows inside the range: its height is split into up to 16 rows (14 by default), every bar shares its tick volume over the rows its span covers, and a point-of-control line runs through the busiest row. Candles are tinted by where they close: bullish near the range low, grey at the middle, bearish near the high, full colour once they close outside.
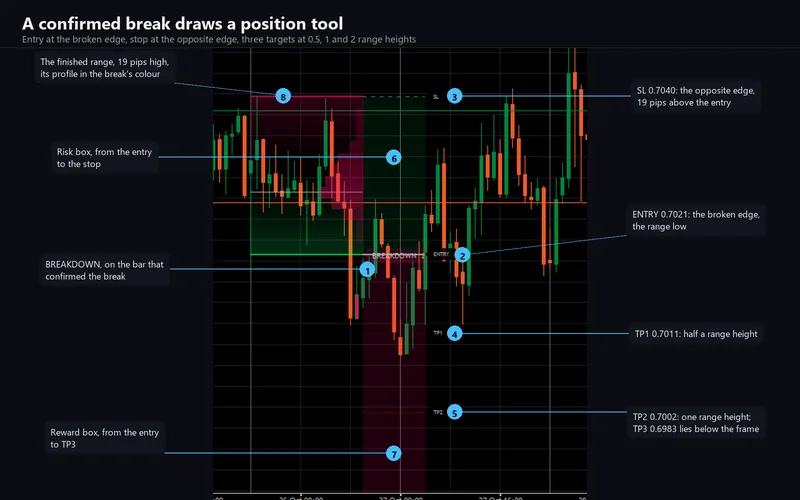
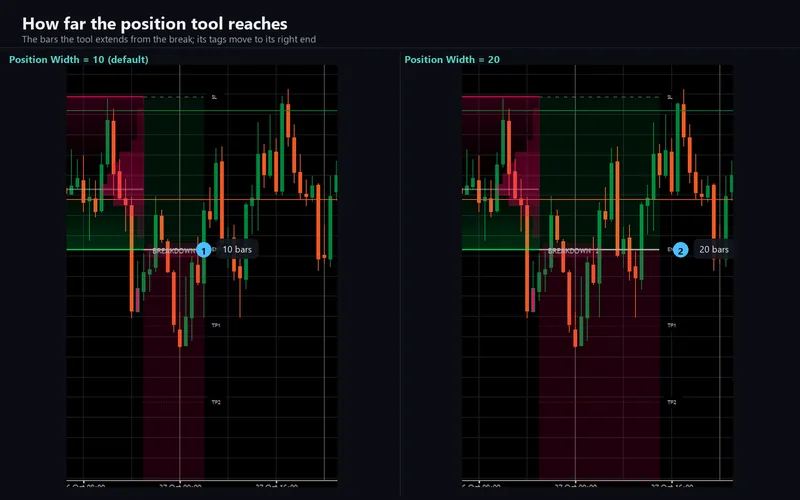
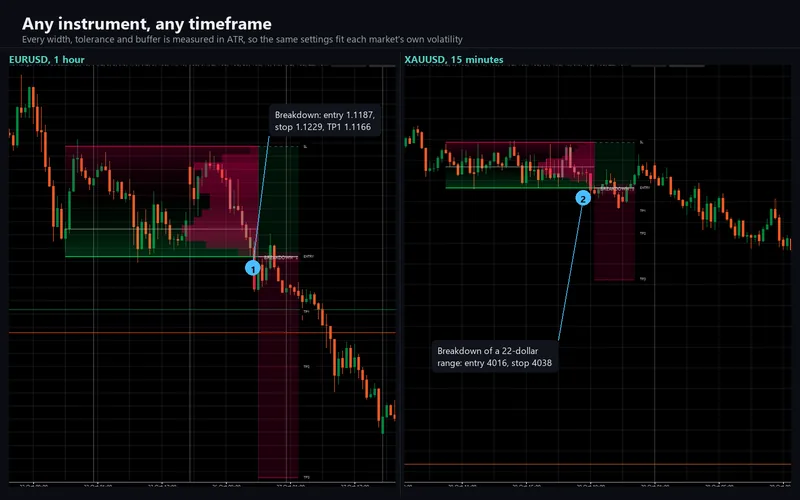
A move that closes beyond an edge by more than the break buffer (0.1 ATR) and then closes back inside is a deviation, marked with a diamond at its extreme. Two consecutive closes beyond an edge plus the buffer confirm a breakout or a breakdown instead: a tag on the confirming bar, and a position tool drawn ten bars forward - entry at the broken edge, stop at the opposite edge, TP1, TP2 and TP3 at 0.5, 1 and 2 range heights, a reward box, a risk box and five labels. The levels are measured from the range; nothing marks a target or the stop as reached. The last ten completed ranges stay on the chart, and four bars of cooldown pass before the next search.
What repaints, and what does not
Breaks, their tags and position tools, deviations and their diamonds, and every alert are decided when a bar closes and never change afterwards. A bar counts as closed when the next bar opens, or once its own time has run out with no new tick.
The search for a new range, the edge touches, the active profile and the newest candle's colour also run on the forming bar: worked out as if the bar closed now, drawn, and undone before the next update, at most four times a second, as the original does. So a range can appear or an edge can move before the bar closes.
Bars To Calculate, 20,000 by default and adjustable from 500 to 200,000, sets how far back the ranges are calculated. Where that history starts decides which range is found first, so another depth can show other ranges.
How the port was verified
The engine is platform-free C#: it references no cTrader type, so the shipped code is replayed offline, bar by bar, against the original's own captured output. Probes were derived from the original mechanically and read back as full doubles in four generations: the range state, the profile rows and the find-range result, the swing memory, and a dump of every drawn object with the bar colours. Values compare exactly, with no tolerance declared anywhere; drawn objects compare field by field in creation order.
117,463,806 value cells and 254,613 drawn-object fields over 254 runs: zero mismatches. The runs cover seven charts - EURUSD on M5, M15 and H1, XAUUSD on M5, the dollar index on H1 and two crypto pairs on M5 and M15 - each between 20,015 and 23,854 bars long. 224 of the runs are on the EURUSD M5 chart, where the inputs were swept.
Two differences are declared, and nothing else is: the source's bottom-right watermark table, which carried a social handle, is not drawn, and the four alert messages begin with this product's name. Self-tests pin all four messages, a mutation run caught 45 of 45 planted faults, and in a live round the webhook's first post was refused with a 500, retried once and answered 200. A private replay edition then fed the original's own 20,148 EURUSD M5 bars to a real cTrader chart, where the in-platform model - 390 boxes, 90 lines, 90 labels and 1,415 coloured bars - matched the offline harness.
What the comparison found
Values that match to the bit do not put the same pixels on the screen by themselves. Side-by-sides of the replay against the original's 1:1 snapshots found eight host rendering defects, all fixed in the shipped build.
The platform's bar coordinate is not the candle. An object placed at cTrader's BarIndexToX sits 1.5 px right of the candle's centre at every zoom; the original starts a line or box on the wick column. The mapper subtracts 2 px.
A candle tint colours the body only. The original tints the body's interior and leaves the 1 px border and the wick in the chart's own colours. cTrader's bar colour paints border and wick too, so the fill colour is set instead.
Smaller findings: every 1 px line sat one row high, because .NET rounds halves to even where the original rounds them up; a box covers both end bars' wick columns and a zero-width box is a 1 px column; Trebuchet MS has no diamond or arrow glyph, so Segoe UI Symbol is named after it. What remains is the rasteriser, not geometry: cTrader hints text to whole pixel sizes, so the BREAKDOWN word is about 2 px wider than the original's and the diamond about 1 px wider.
What differs because the platform differs
Your candles are not the same candles. This matters most, and it is not a defect. The swings are read from your broker's candles and the profile from your broker's tick volume, neither of which is the original platform's feed, so a live cTrader chart's ranges and point of control can differ from a chart of the same symbol elsewhere. On identical bars the output is identical - that is what the figures above measure. A symbol with no tick volume draws its ranges without a profile.
The position tool is pinned inside the chart. A fresh break's tool reaches up to 40 bars past the break, beyond the room cTrader leaves after the last bar - about 14 bars. Pin Labels Inside Chart, on by default, compresses the space after the last bar just enough for the tool and its five tags to stay in the plot. Off draws the original's exact anchors.
One title had to change. The original titles its maximum width only "Maximum", inline after the minimum; cTrader has one parameter per row, so it is Maximum Width ATR.
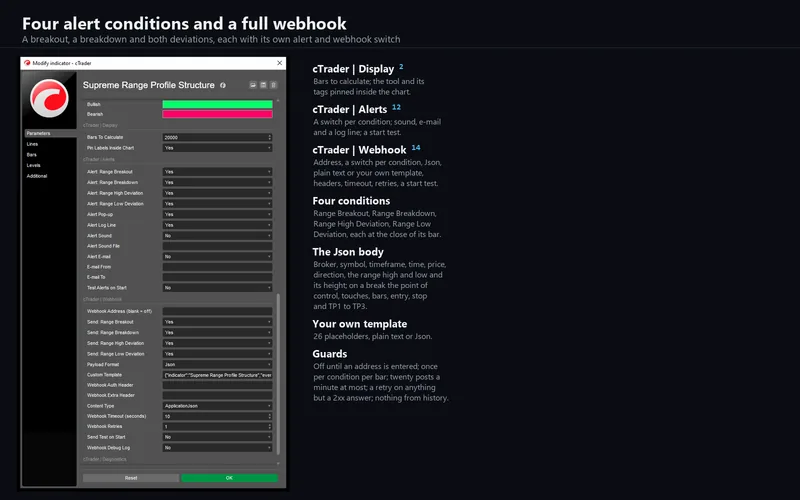
Alerts are the platform's, and on by default. In the original every condition is off until you create an alert. Here the four - Range Breakout, Range Breakdown, Range High Deviation and Range Low Deviation - are on, each with a log line, a sound and e-mail, plus a test on start. Each exists only on a confirmed bar in the original too, so there is no earlier moment to fire at; nothing fires for loaded history or in a backtest.
A webhook. The same four conditions post to any address you enter, as a JSON body, the plain alert sentence, or your own template with 26 placeholders. It stays off until an address is entered, sends once per condition per bar, is capped at twenty posts a minute, retries on anything but a 2xx answer, and posts through cTrader's own networking service.
Requirements
cTrader Desktop 5.x; the real-chart check ran on 5.10.22. It declares no access rights - AccessRights = None - and cannot read files, start processes or open connections of its own. An overlay indicator with no separate pane, for any instrument on any timeframe from one minute to daily. 64 parameters in ten groups: the original's 35 settings with the same defaults, ranges, steps and groups, plus 29 cTrader-only ones for the history depth, the pin, the alerts, the webhook and a debug log.
Support
Through the Discussion tab of the Store listing, so the conversation stays next to the product. Please include your broker, symbol, timeframe, cTrader version and a screenshot of the whole chart.
This is analytical software, not investment advice. It never places, modifies or closes an order, and it is built with no trading permissions at all. The drawn levels and zones are levels on a chart, not orders. Trading involves risk. Past performance does not guarantee future results.