Supreme VWAP And Targets for cTrader: anchored VWAP pullbacks with the plan drawn
A volume-weighted VWAP is anchored at every confirmed swing, armed once the impulse away from it has run at least 1.4 ATR, and watched for a pullback into its value band that closes back across it in the trend's direction. Every such BUY or SELL comes with a drawn plan: the entry, a stop beyond the pullback and three targets in R, with the stop moving to the entry after the first target. Seven filter profiles judge every pullback side by side over the whole calculated history, and a dashboard shows the profile in use with its record on the chart's past. The cTrader edition is a C# transcription checked against the original bar by bar, value by value and drawn object by drawn object on the same bars, with no tolerance declared anywhere.
cTrader 5.x · C# on the cAlgo API · 50 parameters in eight groups · AccessRights = None · sold on the cTrader Store, no trial
Six charts: EURUSD on M5, M15 and H1, XAUUSD on M5, BTCUSDT on M15 and DXY on H1, each on about 20,000 bars, with the defaults everywhere and the input sweeps on EURUSD M5. Every value the original computes - the anchors, the VWAP and its band, the gates, the seven profiles' plans and statistics, the alert flags and the screener series - and every drawn label, line, box and dashboard cell was compared against the original's own output read as full doubles, with no tolerance declared and nothing excluded. Every run is at zero.
What it looks like on the chart
The 10 pictures of the cTrader Store gallery. Select any picture to open it full size.
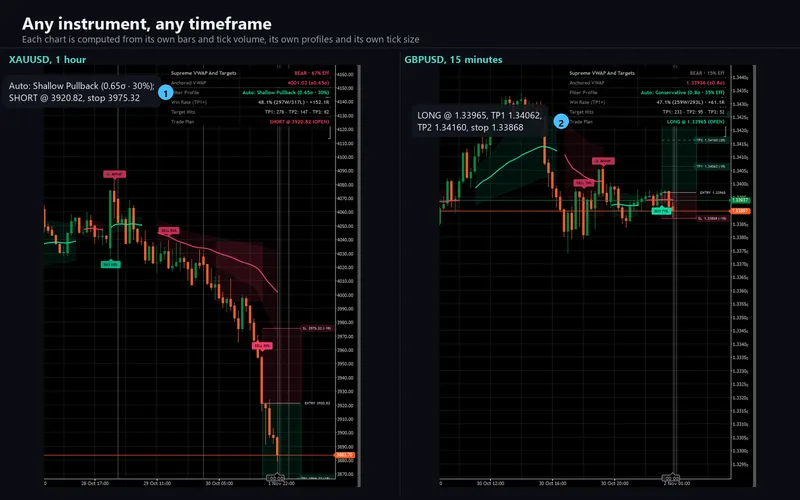
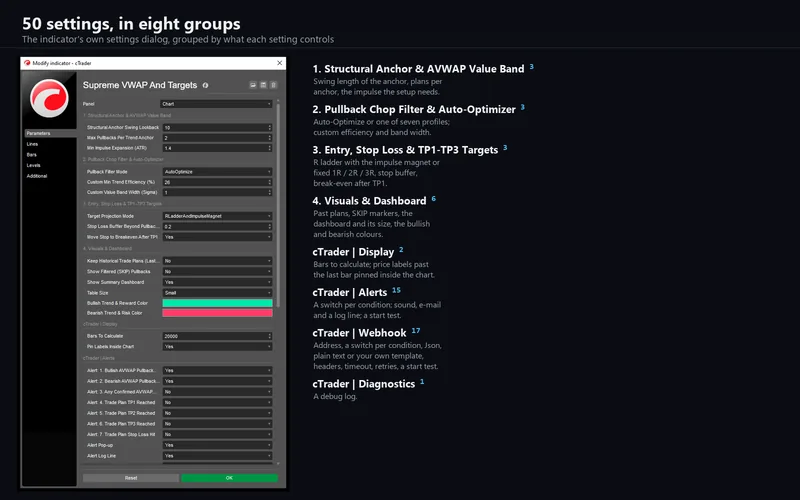
What it does
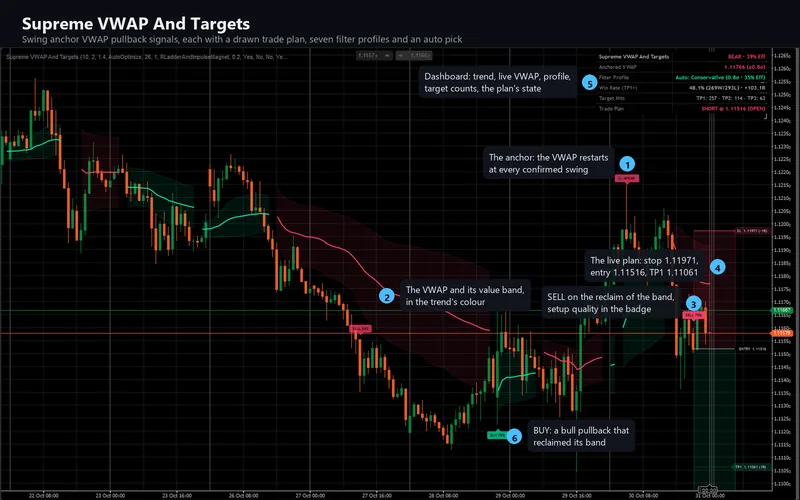
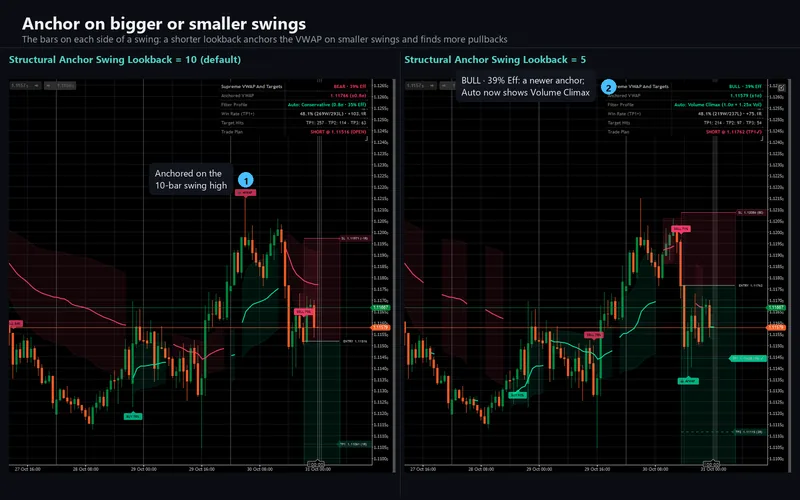
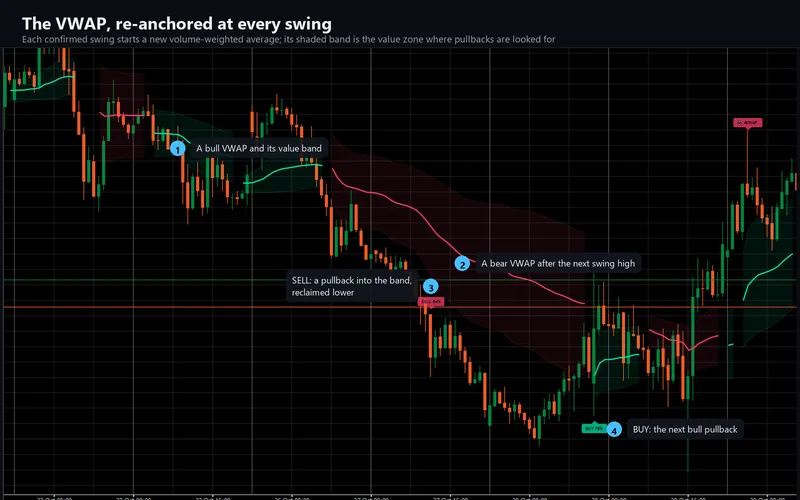
The indicator anchors a volume-weighted average price at every confirmed swing - a pivot with ten bars on each side by default - and trades the pullbacks to it. From the swing bar on, the VWAP is rebuilt from each bar's typical price weighted by tick volume, with a band of weighted standard deviations shaded around it. Once price has moved 1.4 ATR from the anchor the leg is armed. A pullback into the band, then a candle closing back across the VWAP in the trend's direction, is a BUY or a SELL if the profile's filters agree: trend efficiency, setup quality, a pullback depth between 12 and 85 percent of the impulse, and a five-bar guard against sharp moves. Each anchor gives at most two plans.
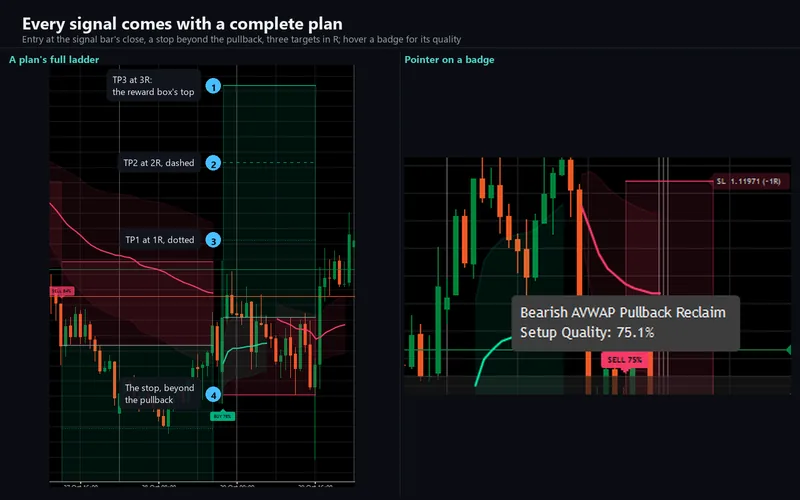
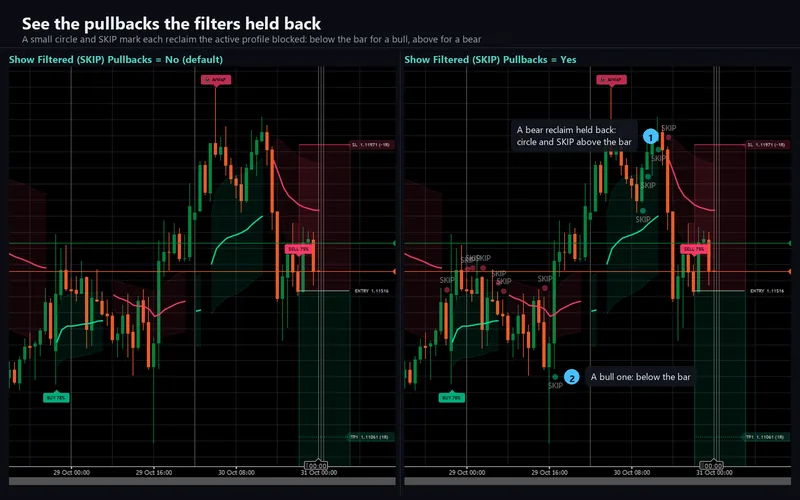
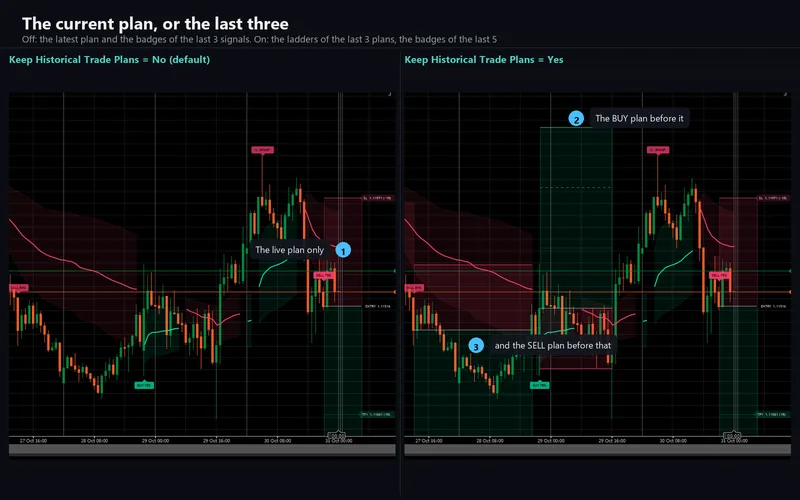
Every signal comes with a drawn plan: the entry at the signal bar's close, a stop beyond the pullback plus 0.2 ATR with the risk kept between the profile's floor and three ATR, and targets at one, two and three times the risk. When the impulse high or low lies between 1.3 and 4.5 times the risk away, the second or third target moves onto it and its label reads MAG. After the first target the stop moves to the entry. A plan ends at its stop, at the third target, after 60 bars, or at the next signal. Optional SKIP circles mark the pullbacks the filters held back.
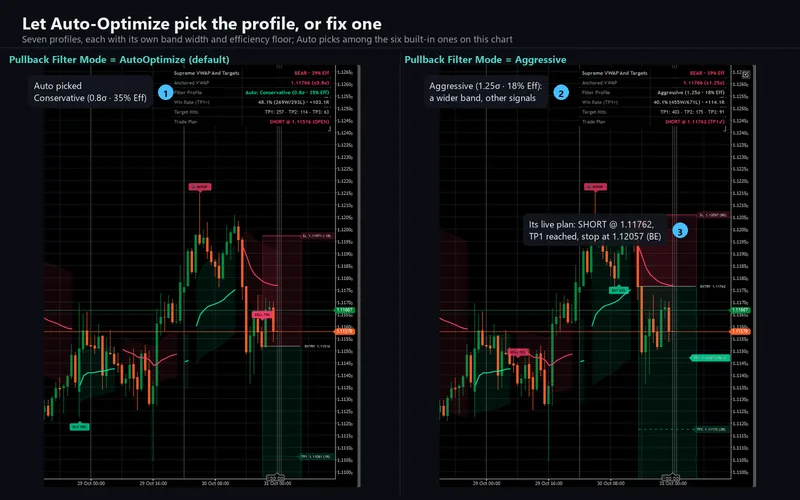
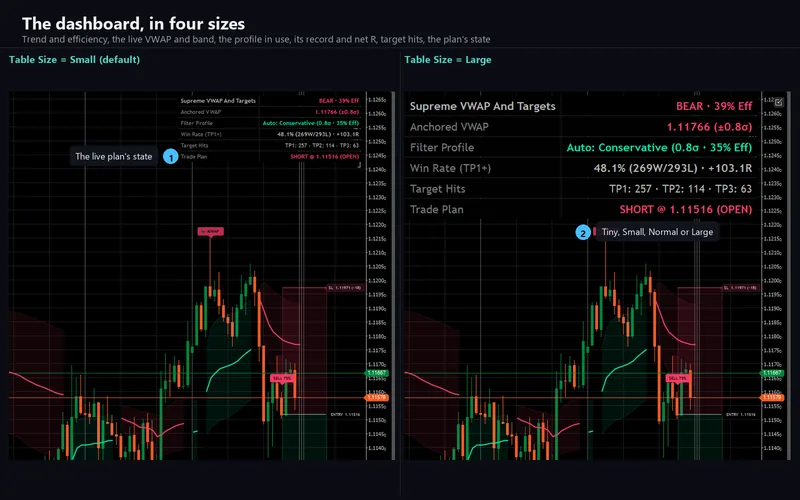
Seven filter profiles run side by side over the whole calculated history - Balanced, Conservative, Aggressive, Shallow Pullback, Deep Value Reclaim, Volume Climax and your own custom thresholds - each with its own band width and minimum trend efficiency. In Auto-Optimize, the default, the chart shows the built-in profile with the highest share of plans counted as reached, ties going to the higher net R; a profile needs three closed plans to compete, except Balanced, Conservative and Aggressive, and Custom Thresholds never takes part. The dashboard shows the trend and its efficiency, the live VWAP and band, the profile in use with its tally and net R, its target counts and the active plan's state.
How the tally counts a plan. A plan closes in one of five ways. One that reaches the third target counts as reached and banks its full R. One that reaches the first target and is then stopped counts as reached too, because the stop is at the entry by then, and banks half the R of the targets it reached. One stopped before the first target is a loss of one R. One still open sixty bars after its entry expires at that bar: if the first target had been reached it counts as reached and banks that target's R; if not, it is counted in the tally when its open result is zero or better and as a loss below zero, and that open result is booked. One replaced by a new signal is closed at that bar and counted like an expired plan. So an expired or replaced plan slightly in profit, or at break-even, is counted in the tally although it never reached a target. The TP1, TP2 and TP3 counts show how many plans actually reached each target; net R sums what every plan booked. Nothing here includes spread, commission or slippage; it describes the chart's past under these rules, not a probability.
What repaints, and what does not
Everything is decided when a bar closes: a signal, its plan's levels and each target or stop event are set on the closed bar and never change afterwards. The forming bar is recalculated on every tick; the dashboard's trend efficiency follows it, the band holds its last closed value, and a SKIP circle lingers on the next bar until it closes, as on the original. Two things change the display later without moving a printed signal: Auto-Optimize is re-decided on every bar, so a closed plan that changes the ranking switches the chart to the new leader; and the profiles are calculated over Bars To Calculate, 20,000 by default and from 500 to 200,000, so a different depth can rank them differently.
How the port was verified
The engine is platform-free C# that builds the drawing model too, so the shipped code can be replayed against a bar series. Every capture is the original's own output, read as full doubles and replayed bar by bar through the shipped engine; values compare exactly, with no tolerance declared anywhere. 188,860,855 value cells and 9,312 drawn-object fields over 220 runs: zero mismatches. Six charts - EURUSD on M5, M15 and H1, XAUUSD on M5, BTCUSDT on M15 and DXY on H1 - each on about 20,000 bars, with the defaults everywhere and input sweeps on EURUSD M5 across every profile and numeric setting, both target modes, break-even, SKIP markers, past plans, table sizes and colours. The seven alert flags are compared in every run, and nothing is declared as a difference.
What the comparison found
Rounding to one decimal carries a tolerance: the original scales by ten, then rounds half away from zero with a 10-10 tolerance on the scaled fraction; 256 of 256 probed cases fit, and a plain .NET round would print 60.0 where the original prints 60.1. It decides the setup quality, its badge and a magnet target's R. The dashboard's figures end in .1 by design: the original's format pattern carries a literal trailing digit, so the value is rounded to a whole number and .1 is appended: 58.1% is 58 percent rounded, +7.1R is +7R rounded. The port prints exactly that, checked against 32 values.
What differs because the platform differs
Your candles are not the same candles. A live cTrader chart uses your broker's candles and tick volume, not the feed the original was captured from; volume weighs the VWAP, the activity gate and the quality score, so anchors, bands and signals can differ from the same symbol elsewhere. On identical bars the output is identical, as the figures above measure and a private same-data replay edition showed on a real chart.
The plan's labels are pinned inside the chart. The original anchors the latest plan's five price labels six bars past the last bar; cTrader leaves about 14 bars of room there and the labels are wider, so with Pin Labels Inside Chart on, the default, the space after the last bar is compressed just enough to keep them inside the plot. Off gives the original's exact anchors.
Dialog, screener and text. cTrader shows an enum's member name, so the mode dropdowns read AutoOptimize, ShallowPullback and so on, with the full titles in each setting's tooltip. The original's five screener series are computed and proven but not drawn, since a 0-to-100 output would rescale a price chart. Labels and cells are WPF text, which snaps to whole pixels: the dashboard at Small runs about 3 percent wider than the original's; Tiny and Large match.
Alerts fire once, at the close of the bar that made the event, where the original's per-bar alert would fire twice. Seven conditions - a BUY, a SELL, either signal, each target reached, the stop reached - each with its own switch for a log line, a sound and e-mail, plus a test on start; nothing fires on history or in a backtest. A webhook posts the same conditions to any address as JSON, plain text or your own template with 21 placeholders, with a retry, a cap of twenty a minute and failures logged rather than thrown.
Requirements
cTrader Desktop 5.x; the shipped build was checked on 5.10.22. No access rights at all - AccessRights = None - because the webhook posts through cTrader's own networking service. 50 parameters in eight groups: the original's 15 settings in four groups, plus 35 cTrader-only settings for display, alerts, the webhook and diagnostics, of which only Bars To Calculate changes a calculated value. Any instrument with tick volume, any timeframe from one minute to daily. An overlay on the price chart, with no separate pane.
Support
Through the Discussion tab of the Store listing, so the conversation stays next to the product. Please include your broker, symbol, timeframe, cTrader version and a screenshot of the whole chart including the dashboard.
This is analytical software, not investment advice. It never places, modifies or closes an order, and it is built with no trading permissions at all. The drawn entry, stop and targets are levels on a chart, not orders. Trading involves risk. Past performance does not guarantee future results.