Three signal families
Trend Cross, RSI Reclaim and Divergence. A BUY or SELL is raised when any enabled family fires on a closed bar, and each family has its own switch.
 NinjaTrader 8 indicator, NinjaScript
An EMA cross, an RSI reclaim of 50 and a momentum divergence at an RSI extreme are three different situations. Momentum Tidebreaker marks each on the closed bar, draws swing support and resistance rays, and for every signal tracks an entry, a stop and two targets from the ATR until TP2 or the stop is reached. Its calculation reads prices only, so a feed without volume changes nothing.
$77one payment, lifetime licence
Get the lifetime licence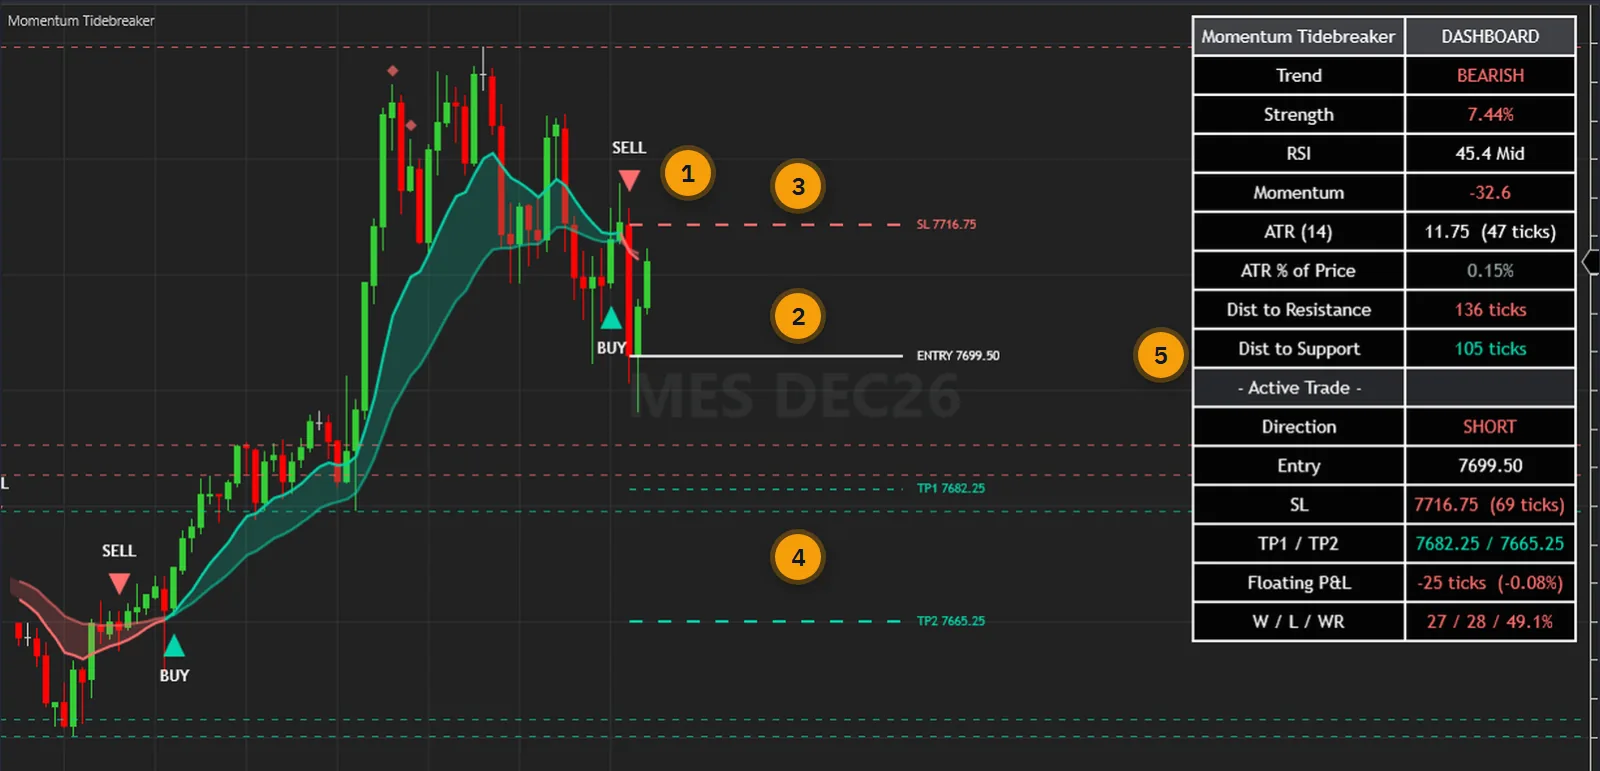
Two EMAs and an RSI in a second panel are a common setup, and they leave the reading to you. Is the fast line far enough from the slow one to mean anything? Did RSI come back through 50 with the trend or against it? Is price still falling while momentum has started to turn? You answer those by eye, on every bar, and then work out a stop and a target on top.
Momentum Tidebreaker writes those questions down as rules. A Trend Cross needs RSI on the right side of 50, an EMA gap above 1 % of an ATR and, by default, momentum pointing the same way. An RSI Reclaim needs the EMA trend and the close on its side. A Divergence needs the close back across the fast EMA.
Each signal then starts a tracked trade from the signal bar's close: a stop from the ATR, one target at one risk and another at two by default. The dashboard shows where it stands in ticks. That is a set of levels on a chart, not a position, and the indicator holds none.
The user guide is public: every parameter and the verification are in it. Read it before you pay.
One indicator in the price panel: the band, the signals, the rays, the levels and the dashboard together.
Trend Cross, RSI Reclaim and Divergence. A BUY or SELL is raised when any enabled family fires on a closed bar, and each family has its own switch.
EMA 12 and 26 by default. While the fast EMA is above the slow one, both lines and the band are in Bullish Color, otherwise in Bearish Color. Fill Transparency sets the band.
A small diamond marks a divergence condition, signal or not. A larger triangle with a star marks a BUY or SELL that is also a divergence, a rare combination at the default 30 and 70 levels.
Require Momentum Confluence tightens the Trend Cross family only. Oversold and Overbought Level decide where a divergence can form, and Trend Strength Period sets the ATR behind Strength.
The stop defaults to 1.5 ATRs from the signal bar's close. TP1 is one risk away and TP2 two by default, and the risk is never less than 10 ticks. The lines are drawn once and are not moved.
Dashed lines at the most recent swing highs and lows, three per side by default. A swing is confirmed Pivot Length bars after it happens, 10 by default. Each ray starts 100 bars back from the newest bar.
Trend, Strength, RSI, Momentum, ATR, the distance to the rays in ticks, the tracked trade with floating P&L, and the tally row. It sits in the top-right corner, and its text size is fixed.
BUY, SELL, STRONG BUY, STRONG SELL, TP1, TP2, SL and both divergences, each with its own switch and all on by default. They fire on live bars only, in the Alerts Log, with sound and email when you turn them on. There is no webhook.
The two EMAs and eleven hidden series, among them BuySignal, SellSignal, TrendDirection, ActiveDirection, EntryPrice, StopLevel, Target1 and Target2, for NinjaScript strategies and Market Analyzer columns.
Every picture below is a NinjaTrader 8 capture with numbered notes added. Nothing on the charts is drawn by hand. Click any image to enlarge it.
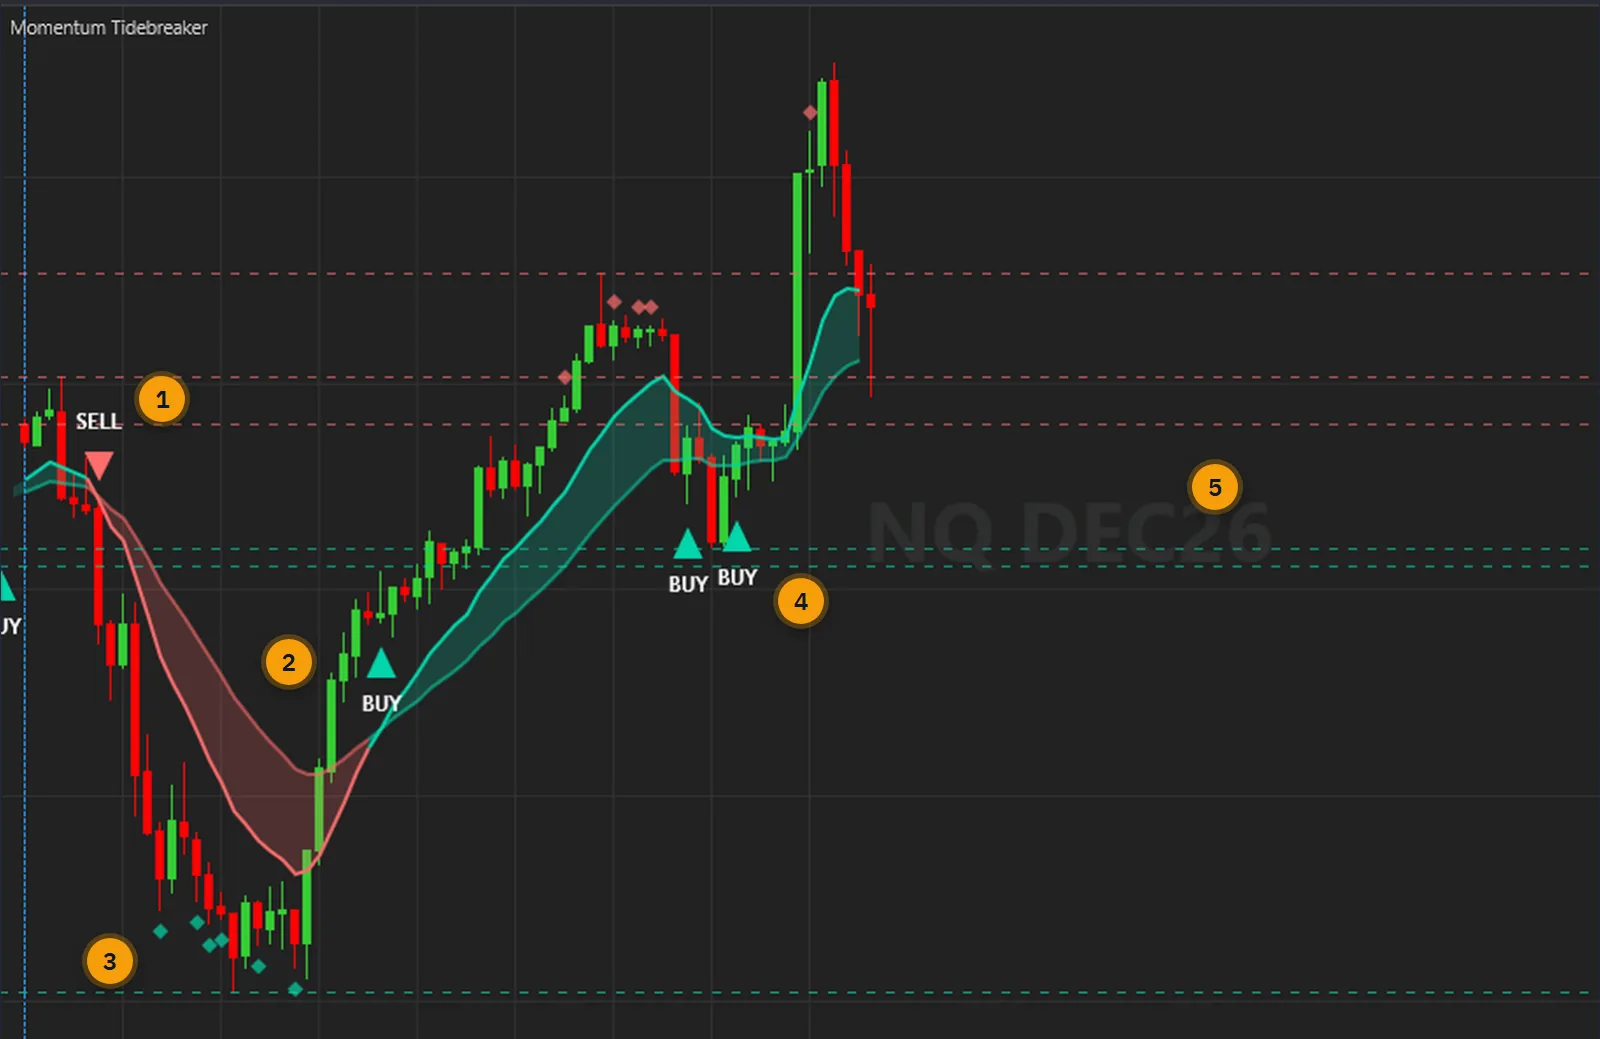
A BUY or SELL triangle marks a closed bar where an enabled family fired. A diamond marks a divergence condition whether or not it became a signal: RSI beyond its level, with momentum and the close going opposite ways. The low diamonds on this chart printed with no triangle, because a Divergence signal also needs the close back across the fast EMA.
No STRONG marker appears on the charts on this page. A STRONG signal is a BUY that is also a bullish divergence, or a SELL that is also a bearish one, and that is rare at the default 30 and 70 levels. Moving the levels towards 50 gives more diamonds and more STRONG signals.
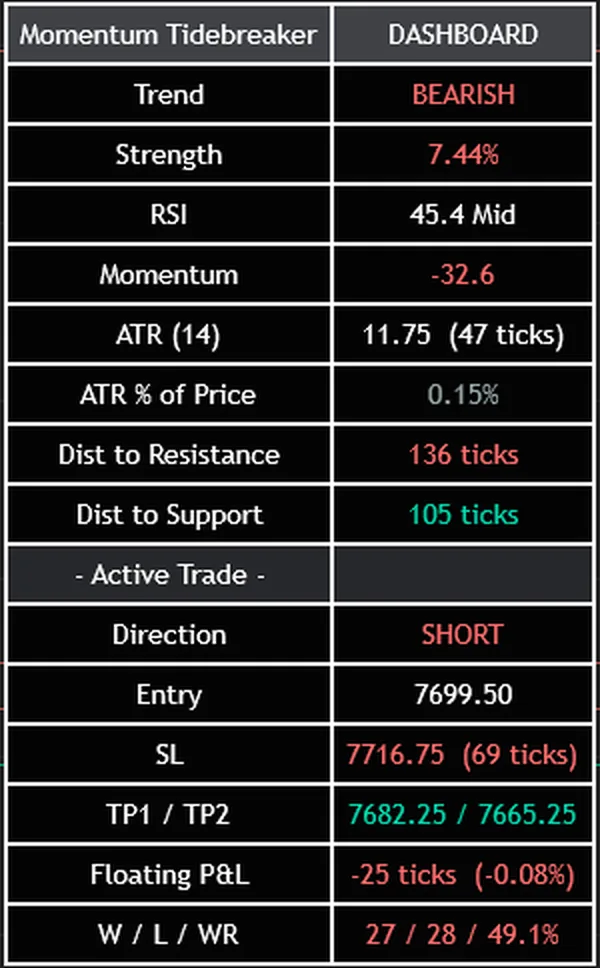
Sixteen rows in the top-right corner: Trend, Strength, RSI, Momentum, the ATR in price and in ticks, the ATR as a share of price, and the distance to the nearest kept resistance and support. Under that, the tracked trade: direction, entry, stop, both targets and floating P&L. Every price prints the nearest tick.
The tally row counts trades closed at TP2, trades closed at the stop and the share closed at TP2, over the bars the chart has loaded, at these settings. A trade replaced by a new signal is not counted at all. It describes those bars. It is not a probability of profit and it is not a trading record.
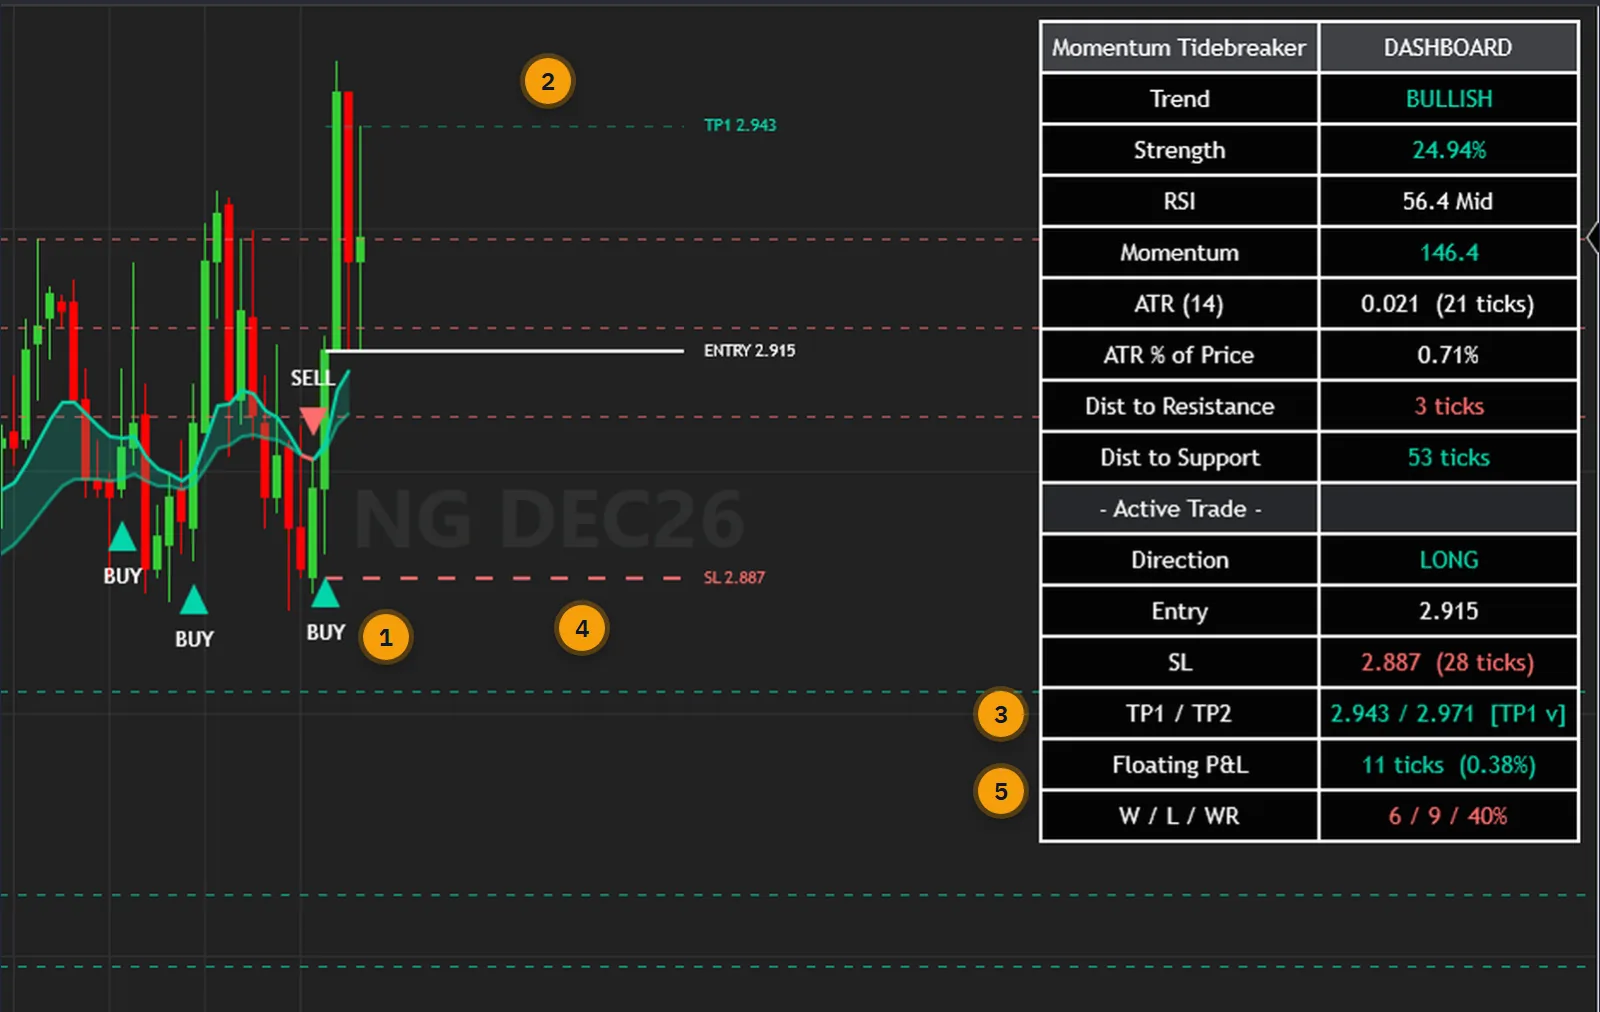
Every signal starts a new tracked trade from the signal bar's close. On each following closed bar the levels are tested in a fixed order, TP2, then TP1, then the stop, and the first that is met wins. On this chart TP1 has been reached: its line has dimmed, the dashboard prints [TP1 v] and the trade stays open with the stop where it was.
When the stop is reached the trade closes as a loss and its lines and tags go away, so a chart cannot show you a hit stop afterwards. The tally row is where those count. A bar that reaches TP1 and the stop together books TP1 and is not a loss, and the stop is tested again on the next bar. On a tick such as 0.25 a level can fall between two ticks: the line and the hit test use the calculated level, and the tag prints the nearest tick.
The calculations are not tied to an instrument. The captures below were taken in NinjaTrader 8 on the free simulation feed: index, energy, metal, currency and rate futures, from 1-minute to 30-minute bars, with the indicator at its default settings on every one.
The calculation does not read volume: the EMAs, RSI, ATRs, swings, signals and levels come from open, high, low and close alone. What matters on a futures chart is the tick. Every price prints the nearest tick, and the dashboard's distances are ticks, not index points: on MNQ, where the tick is 0.25, 50 ticks is 12.5 index points. A continuous contract that is not back-adjusted shows a price jump at the roll, which can produce a false crossing, a swing level at the old price and an oversized ATR for a while.
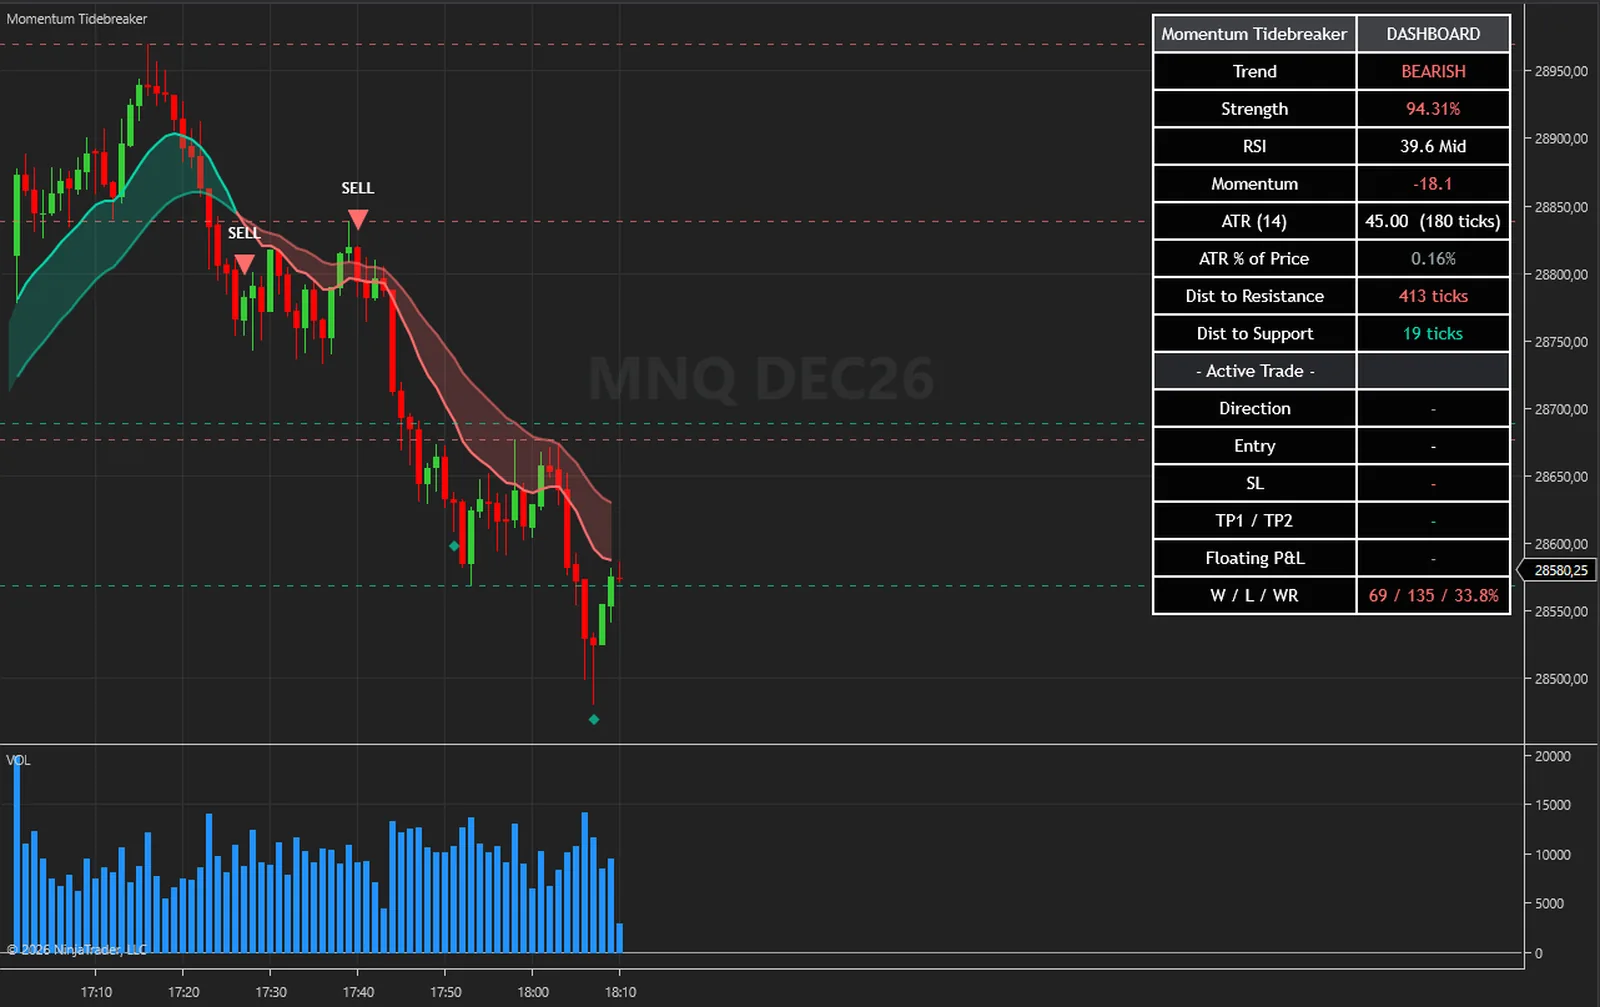
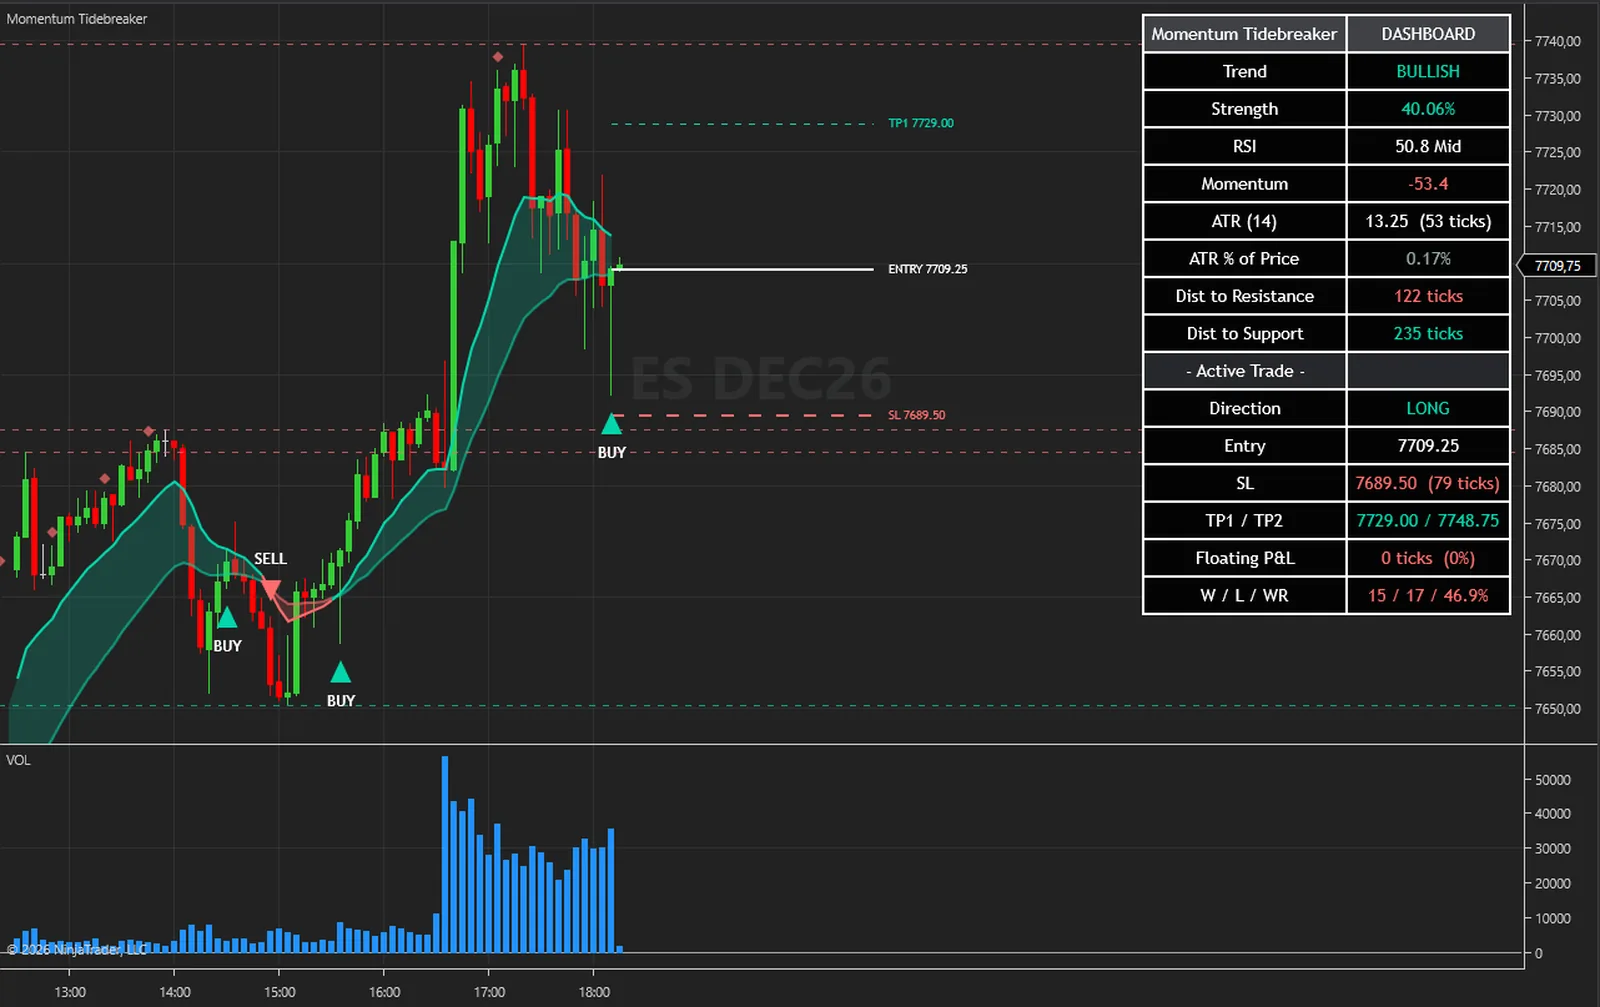
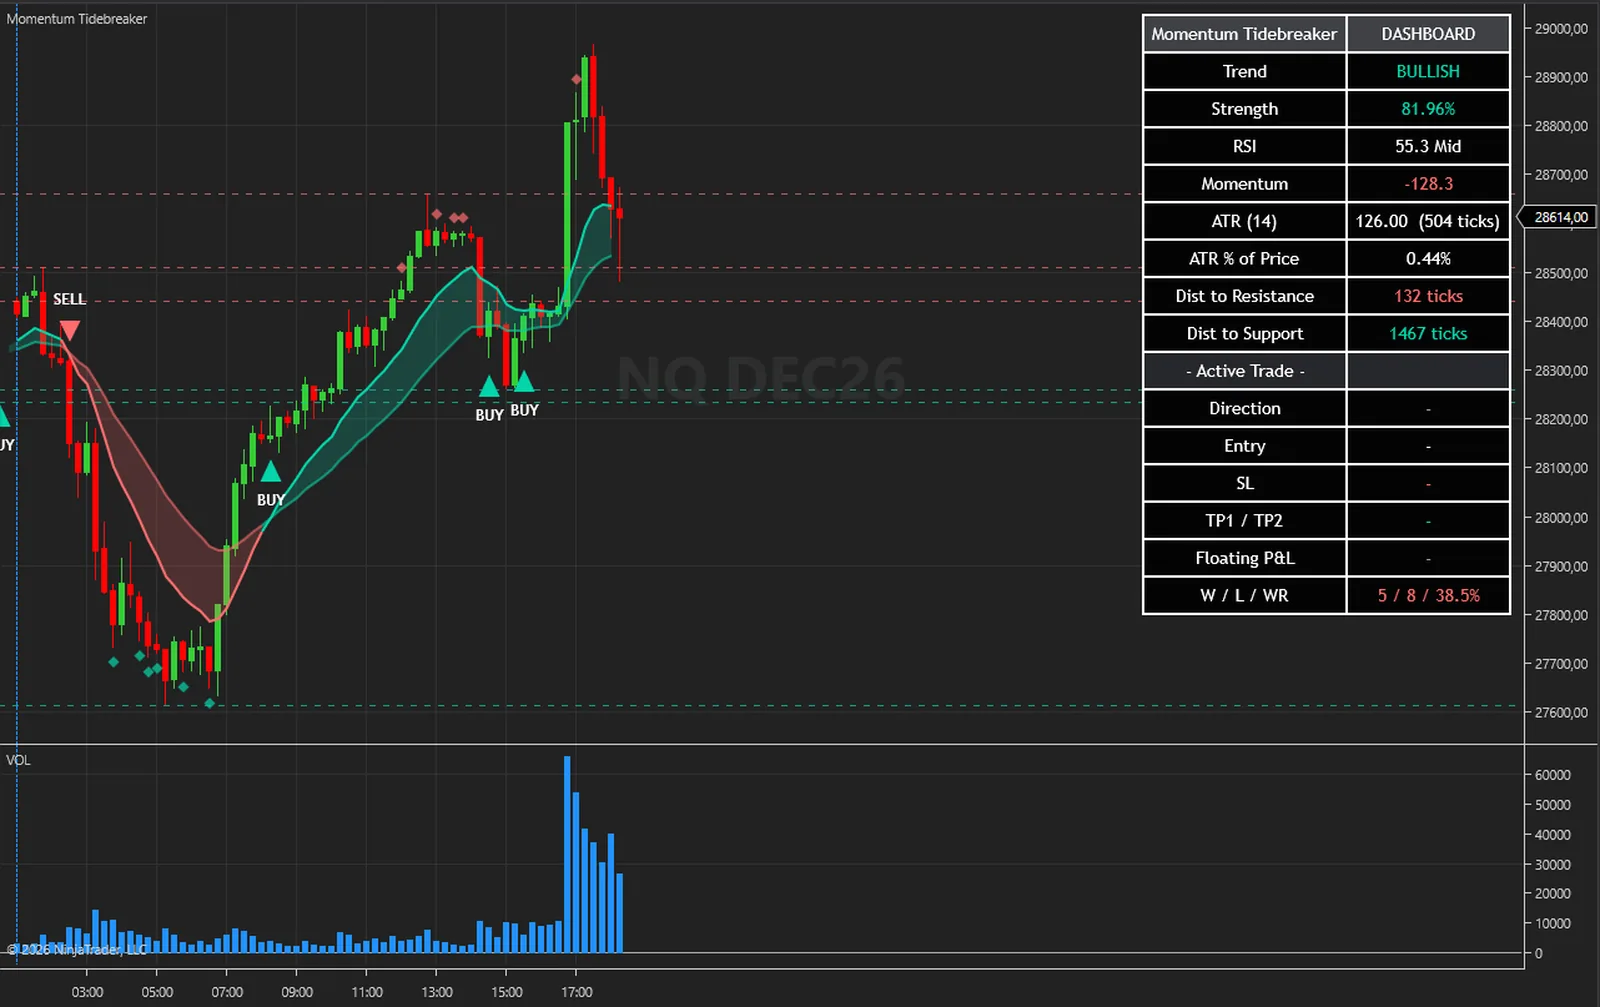
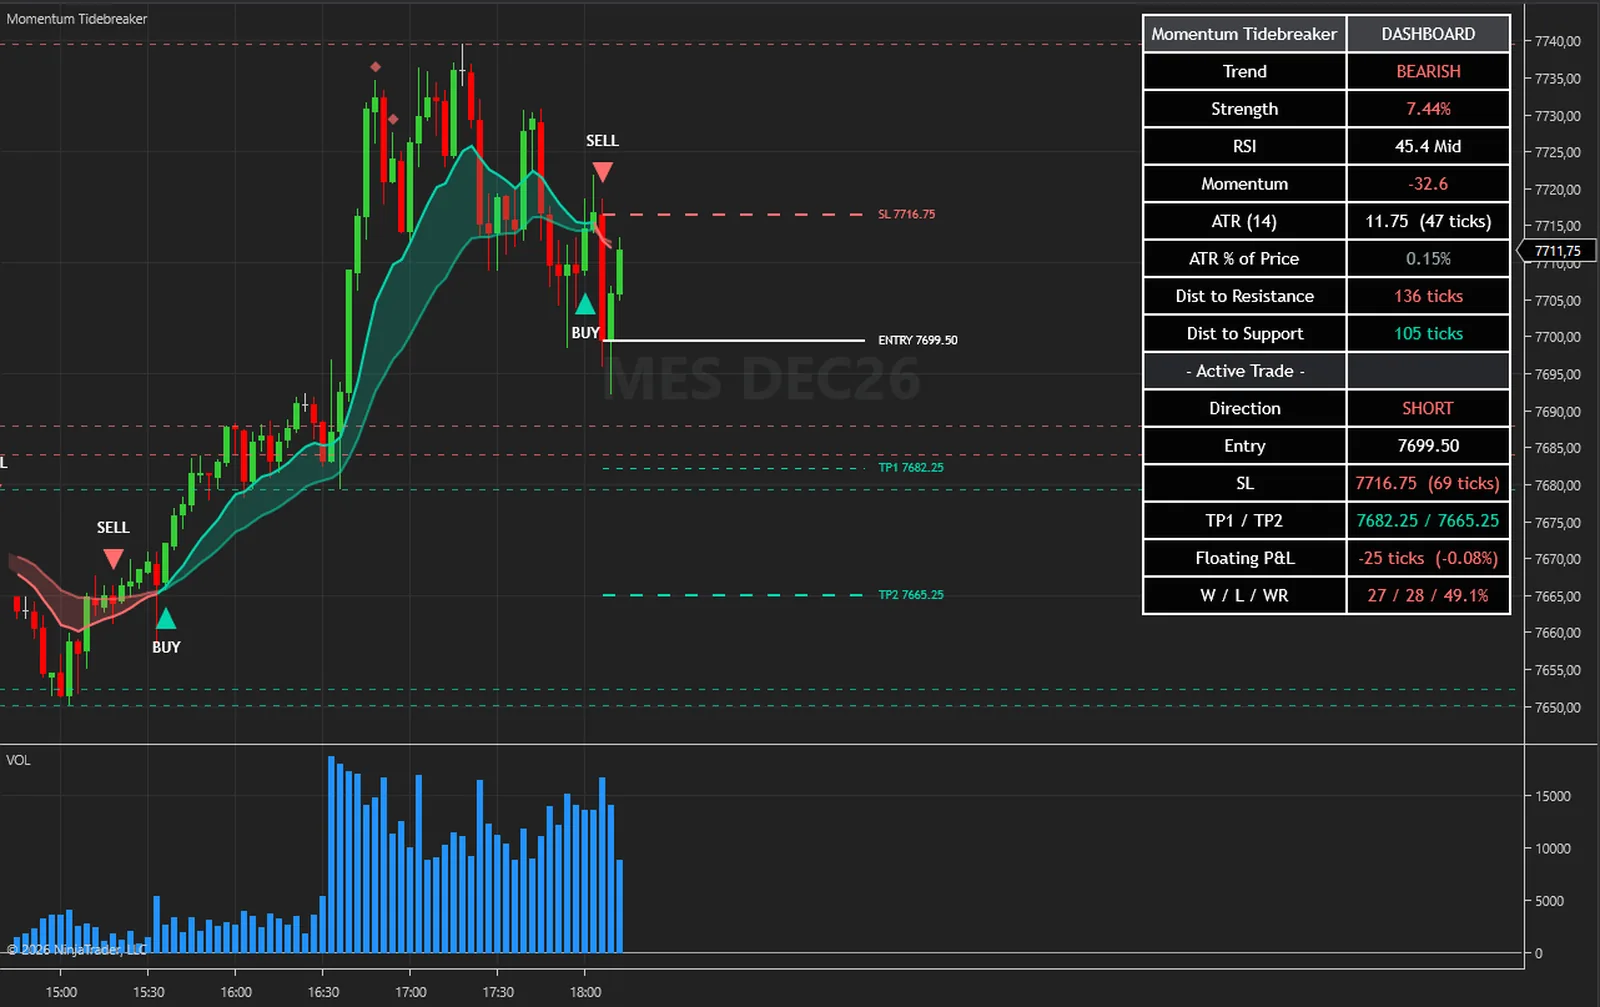
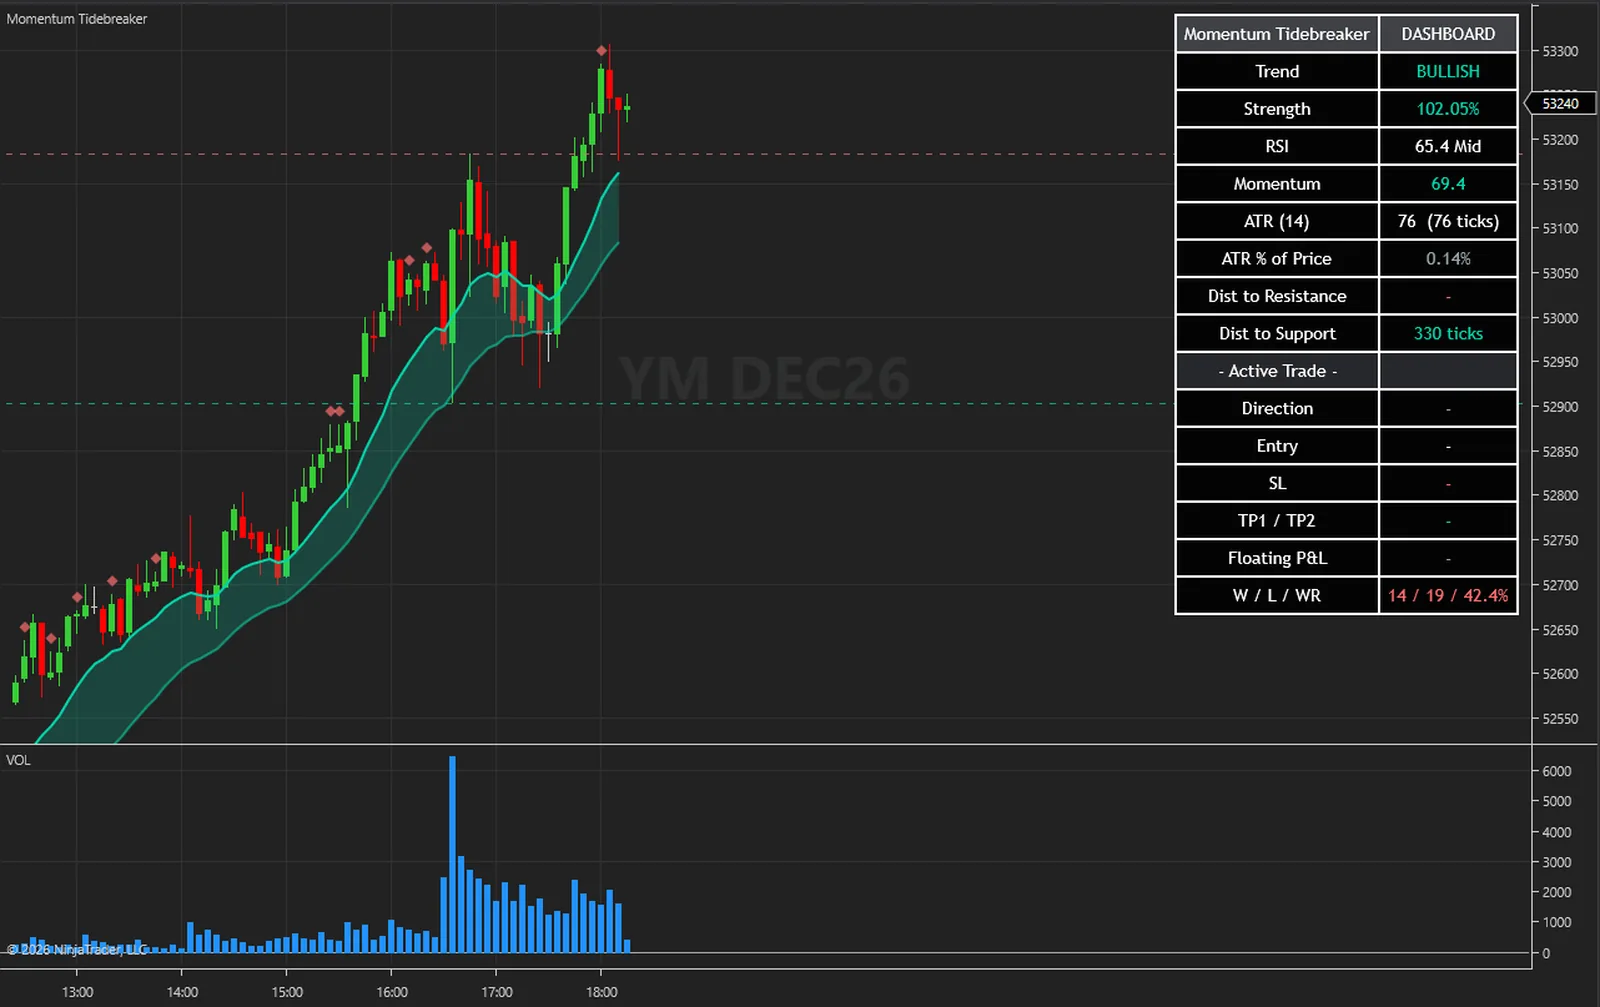
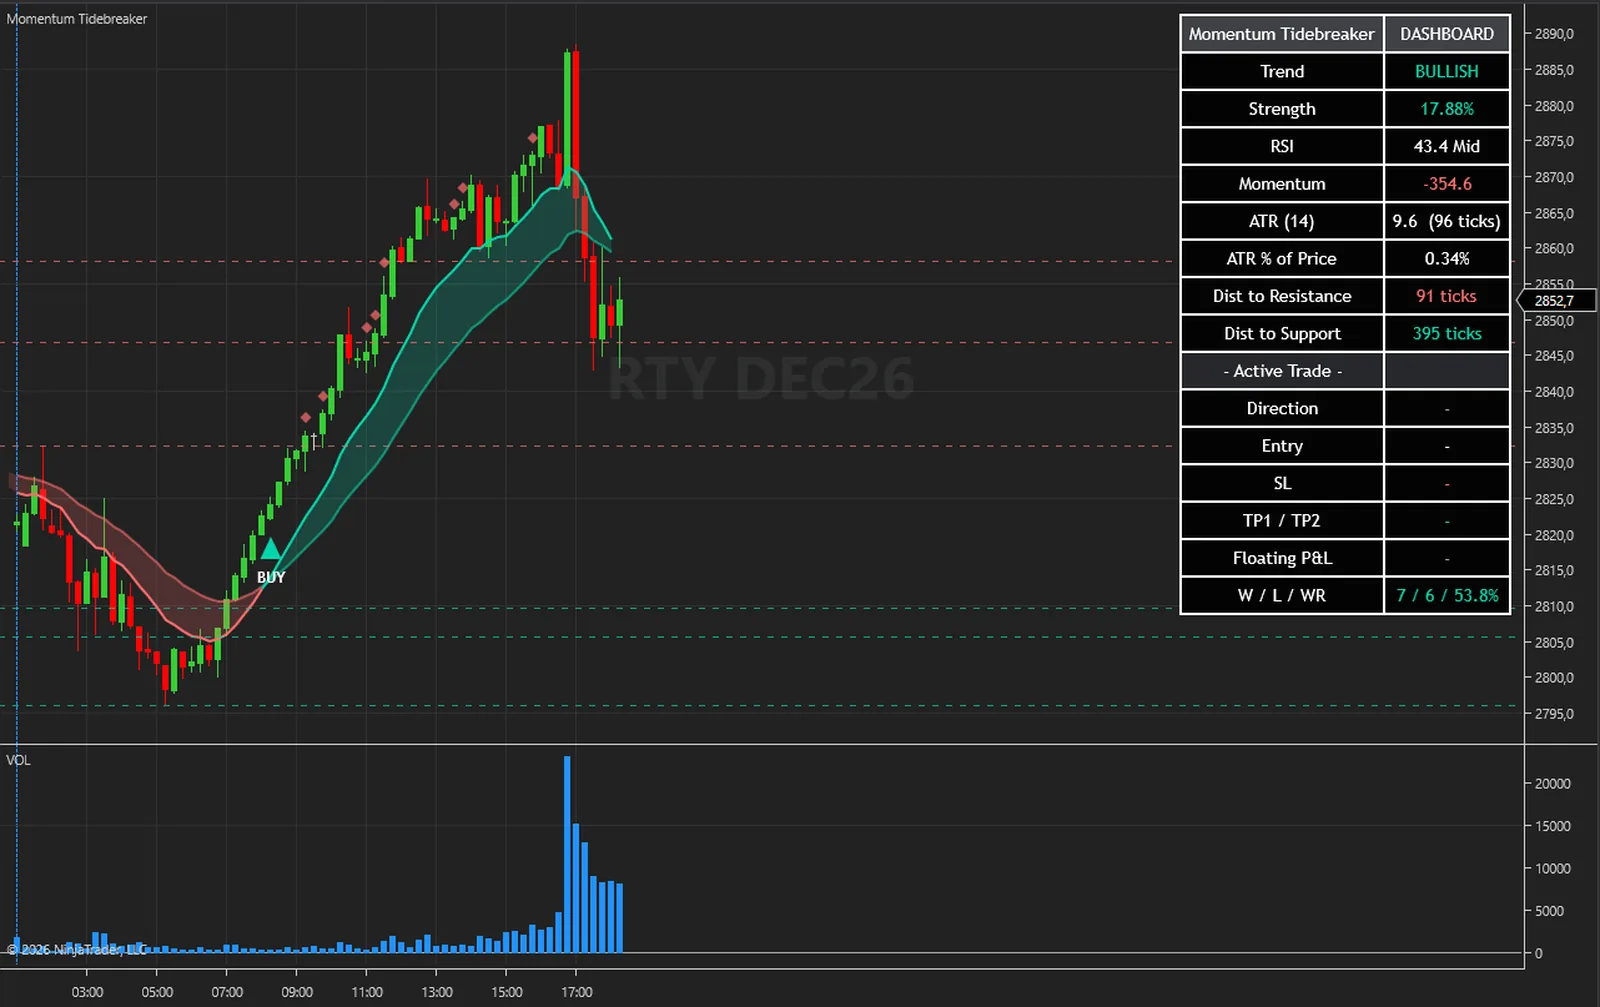
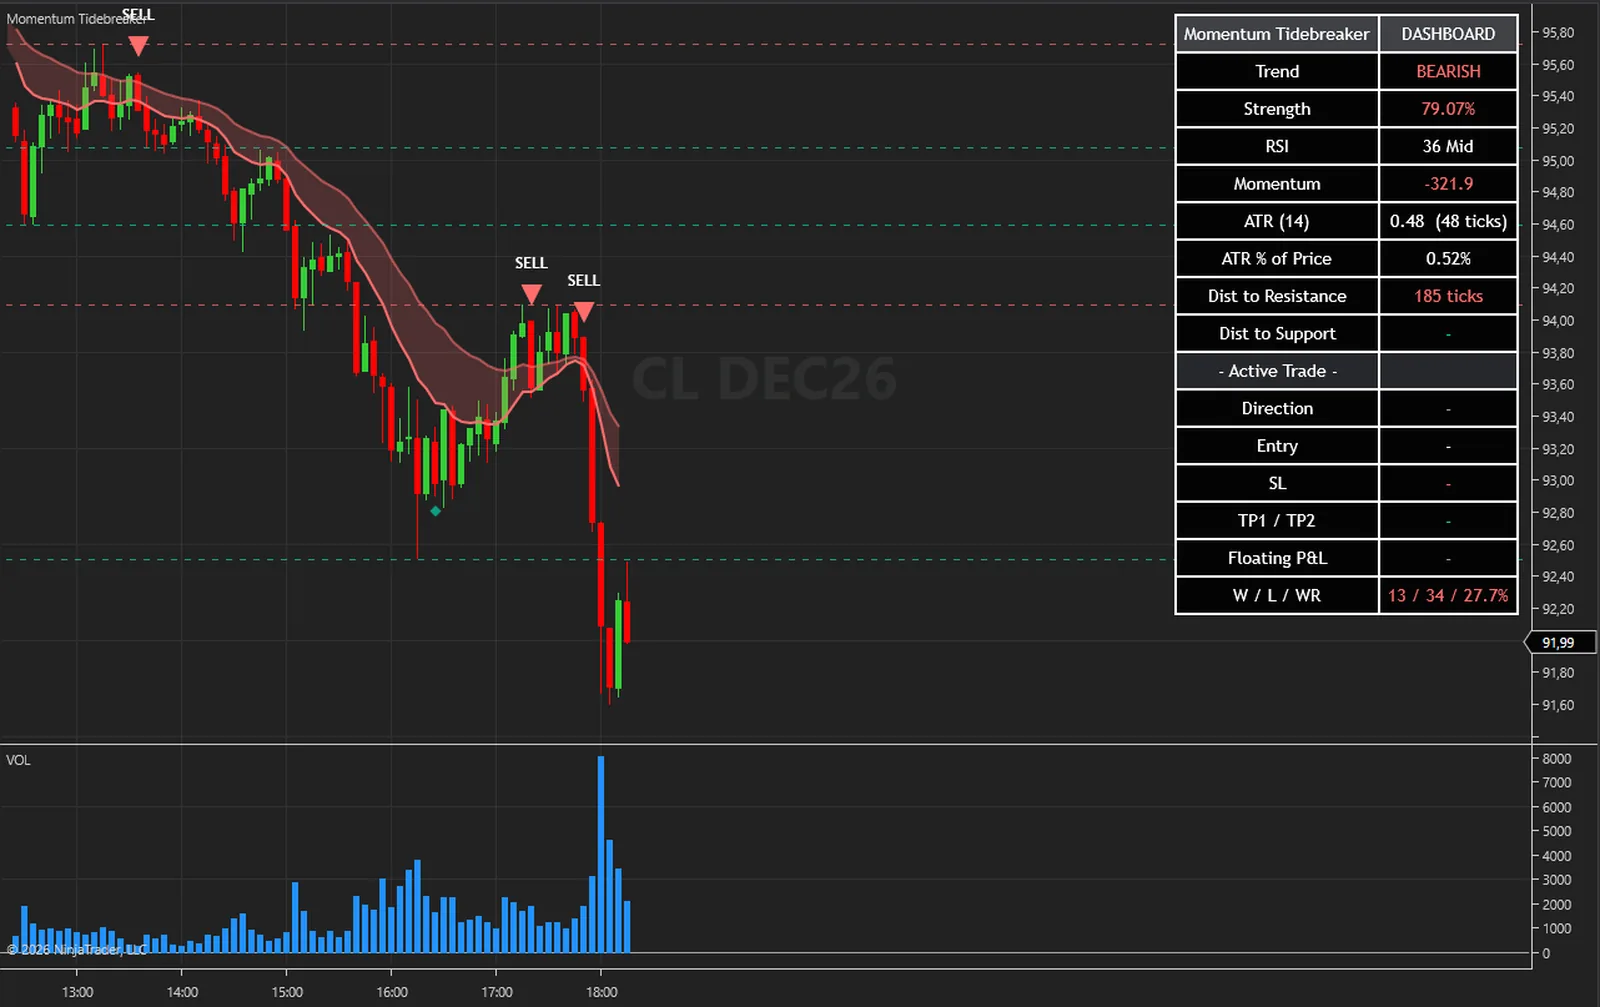
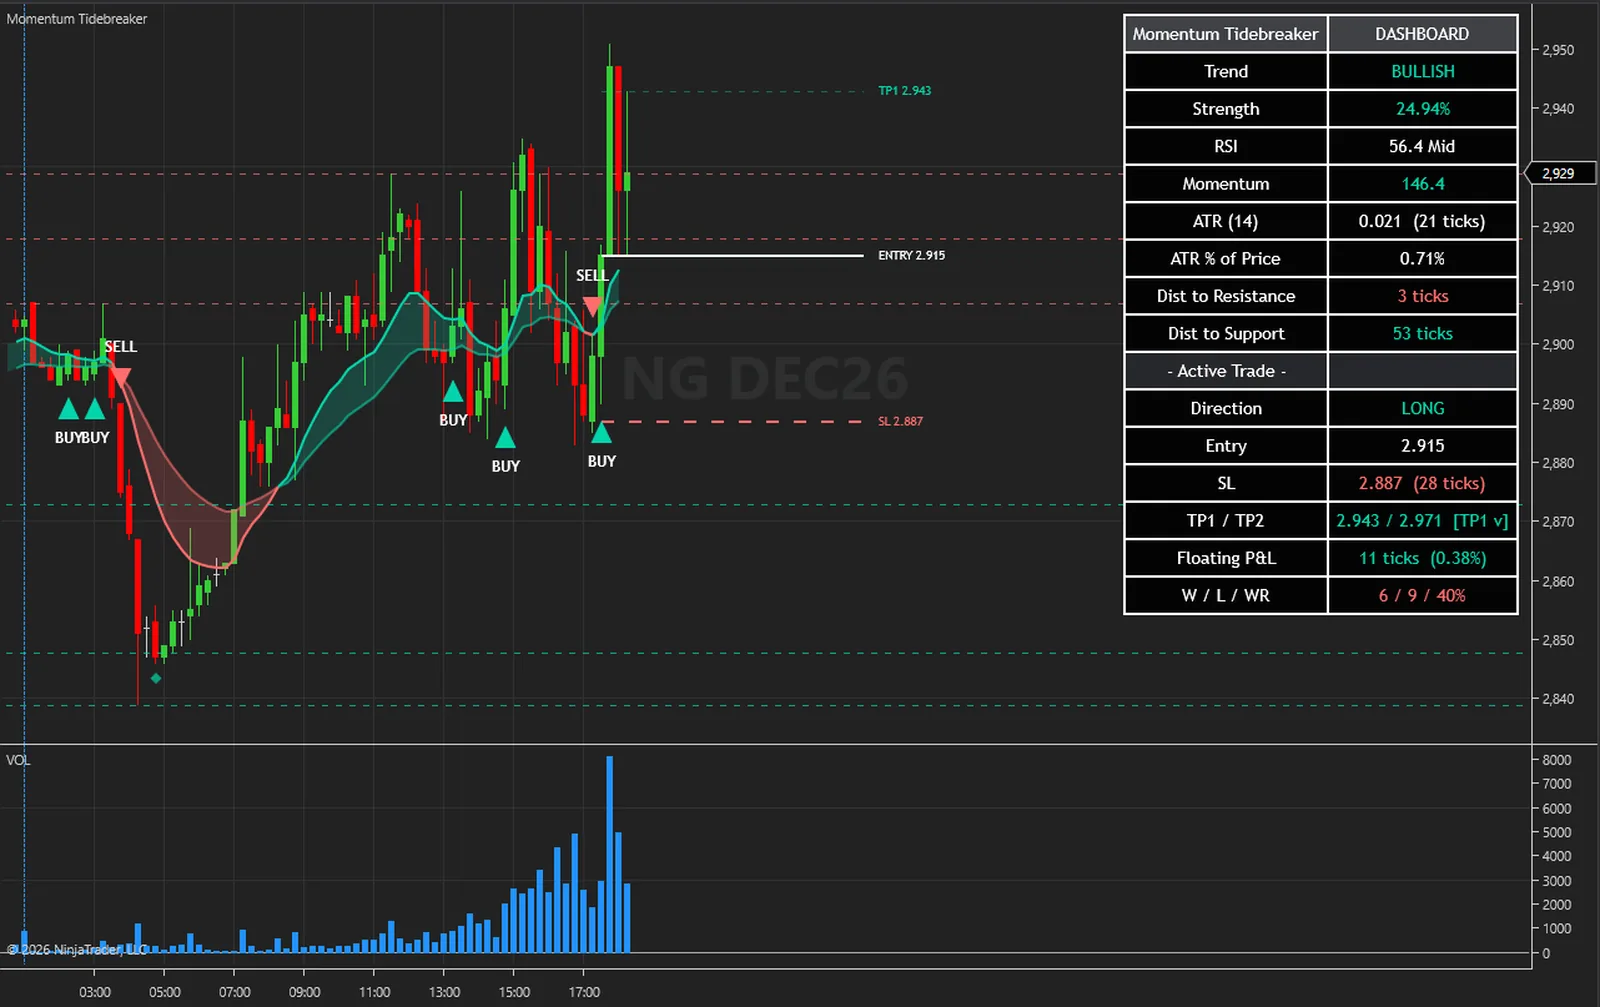
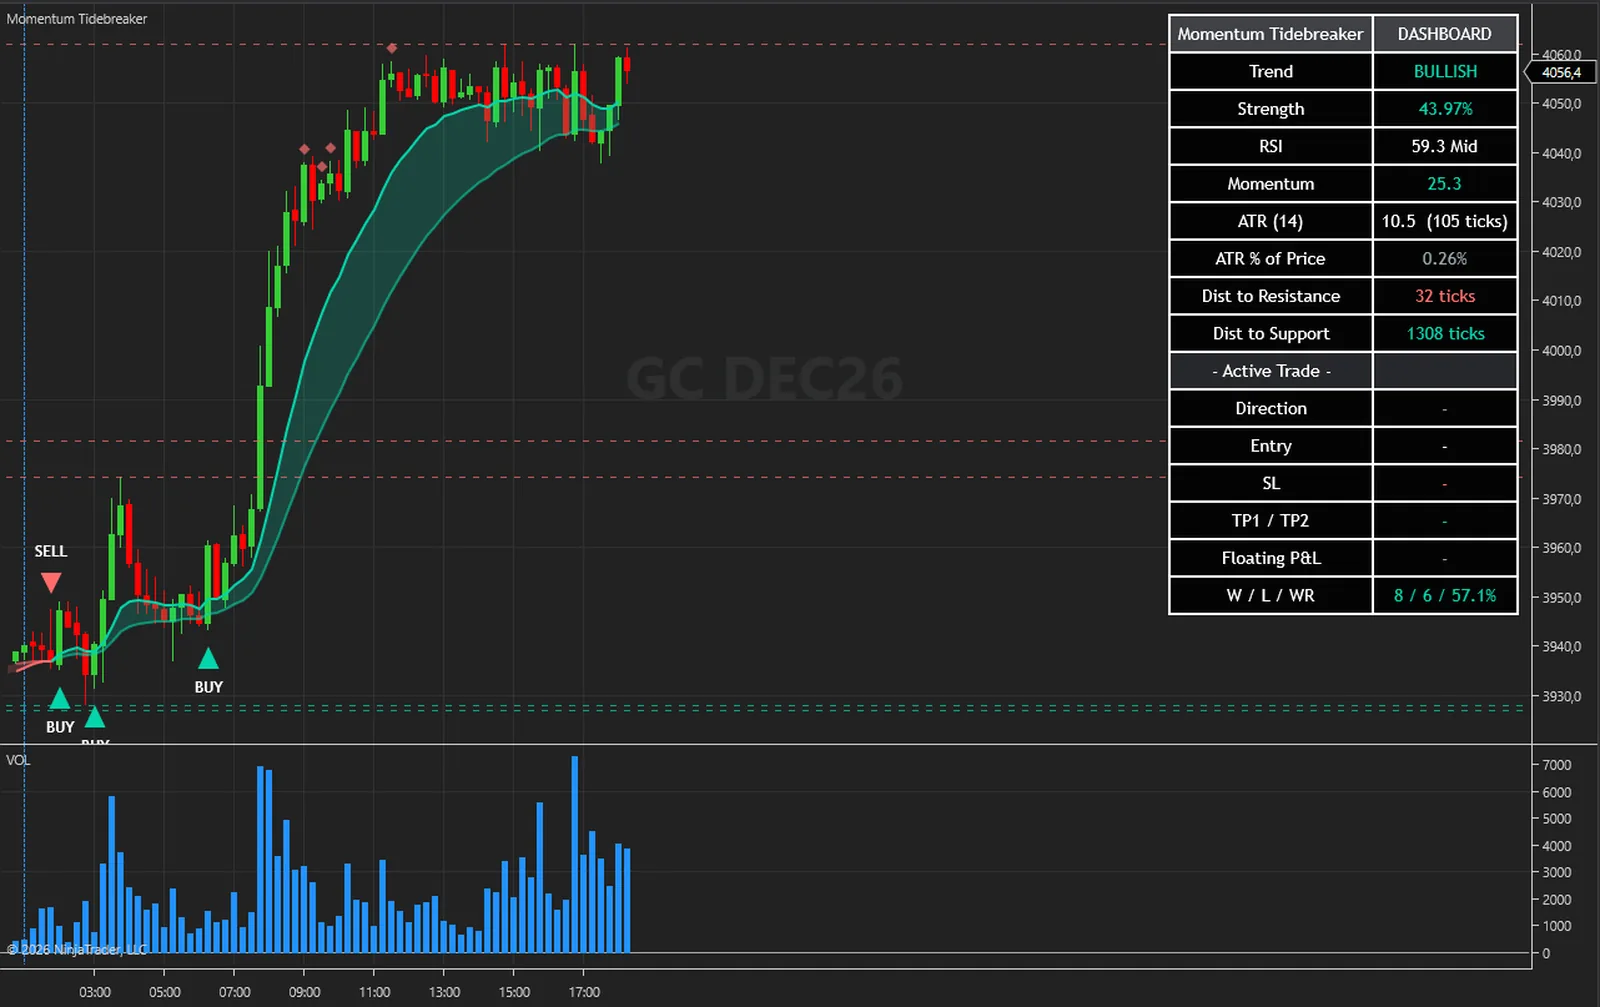
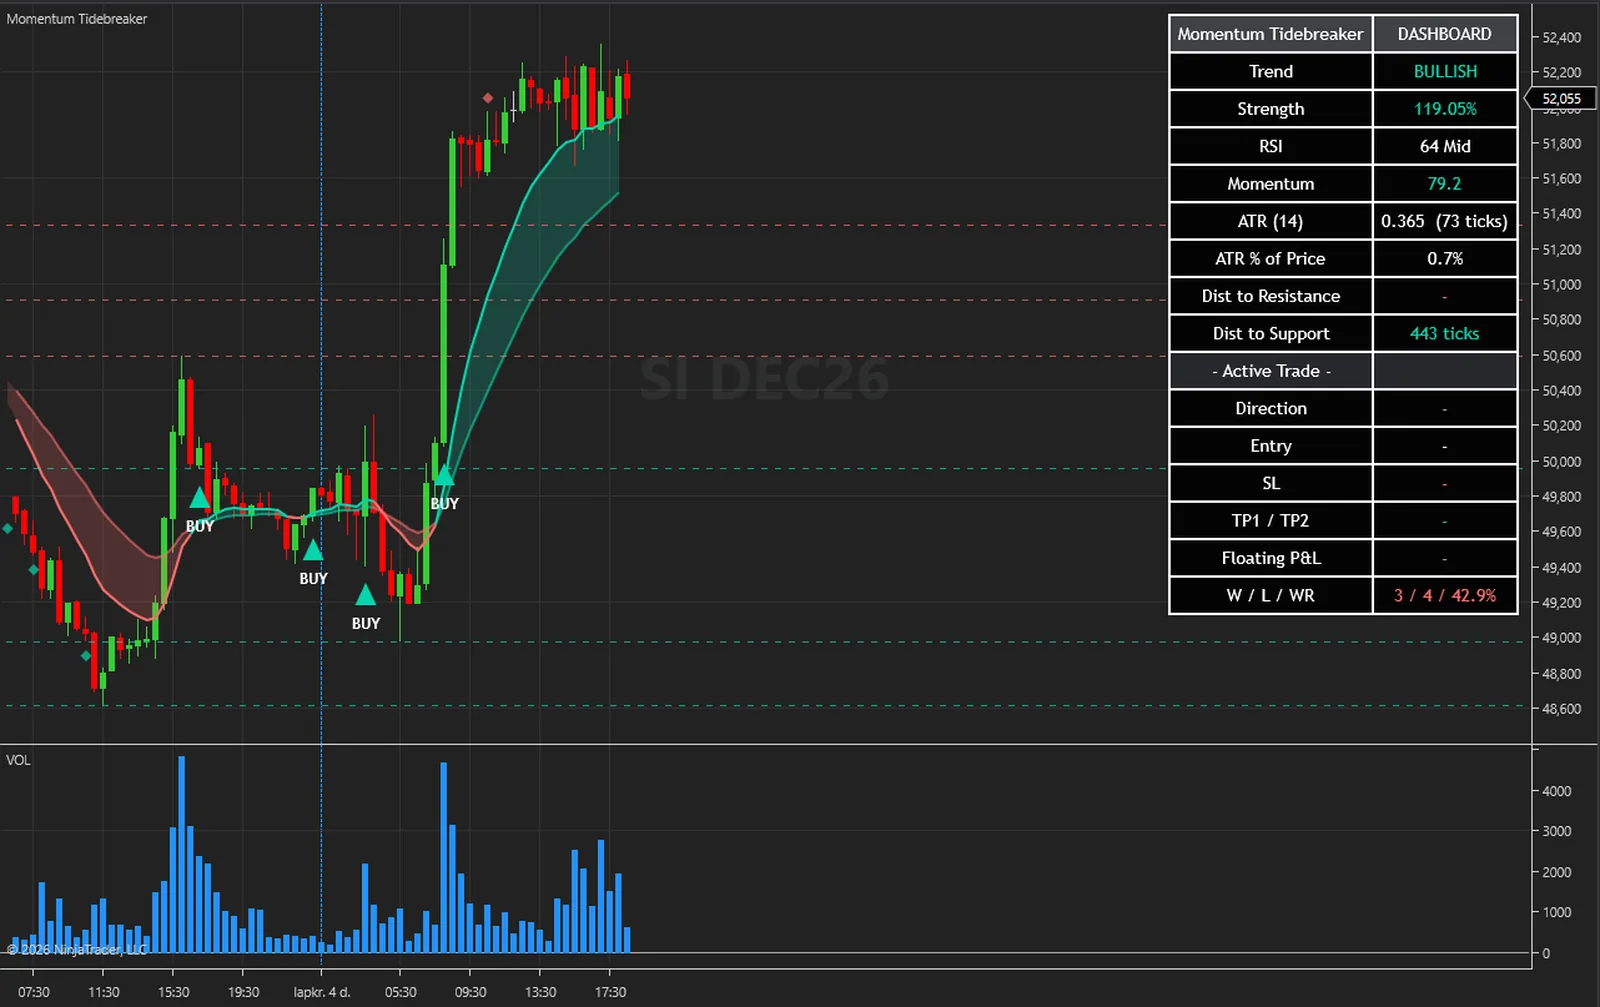
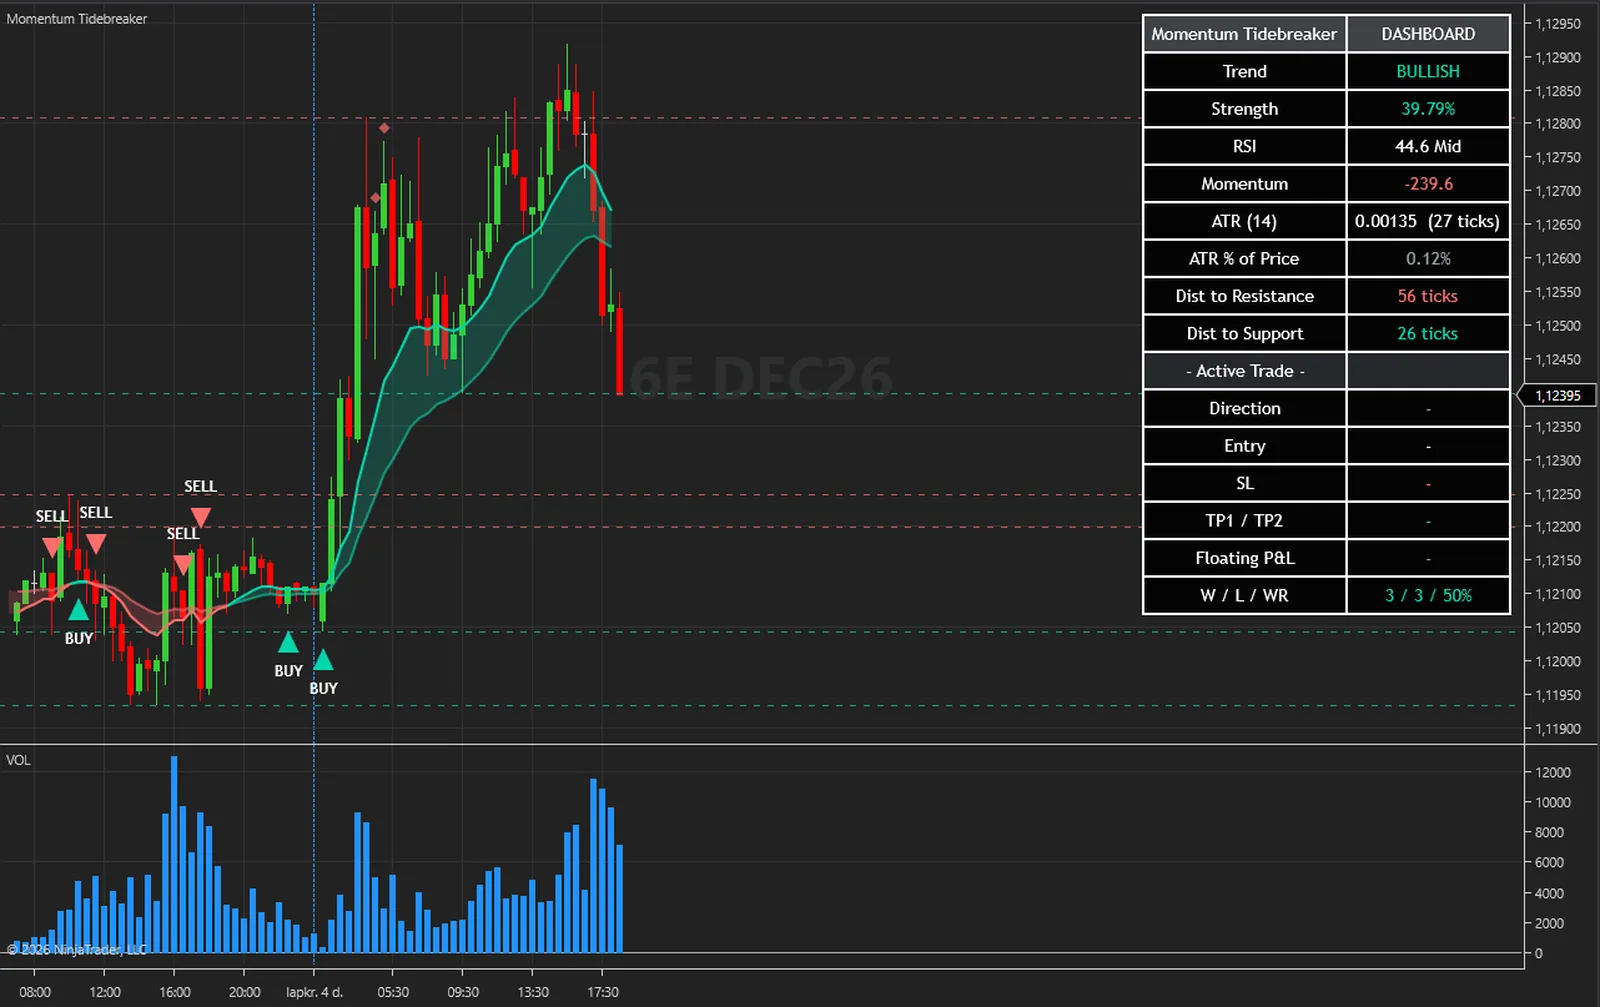
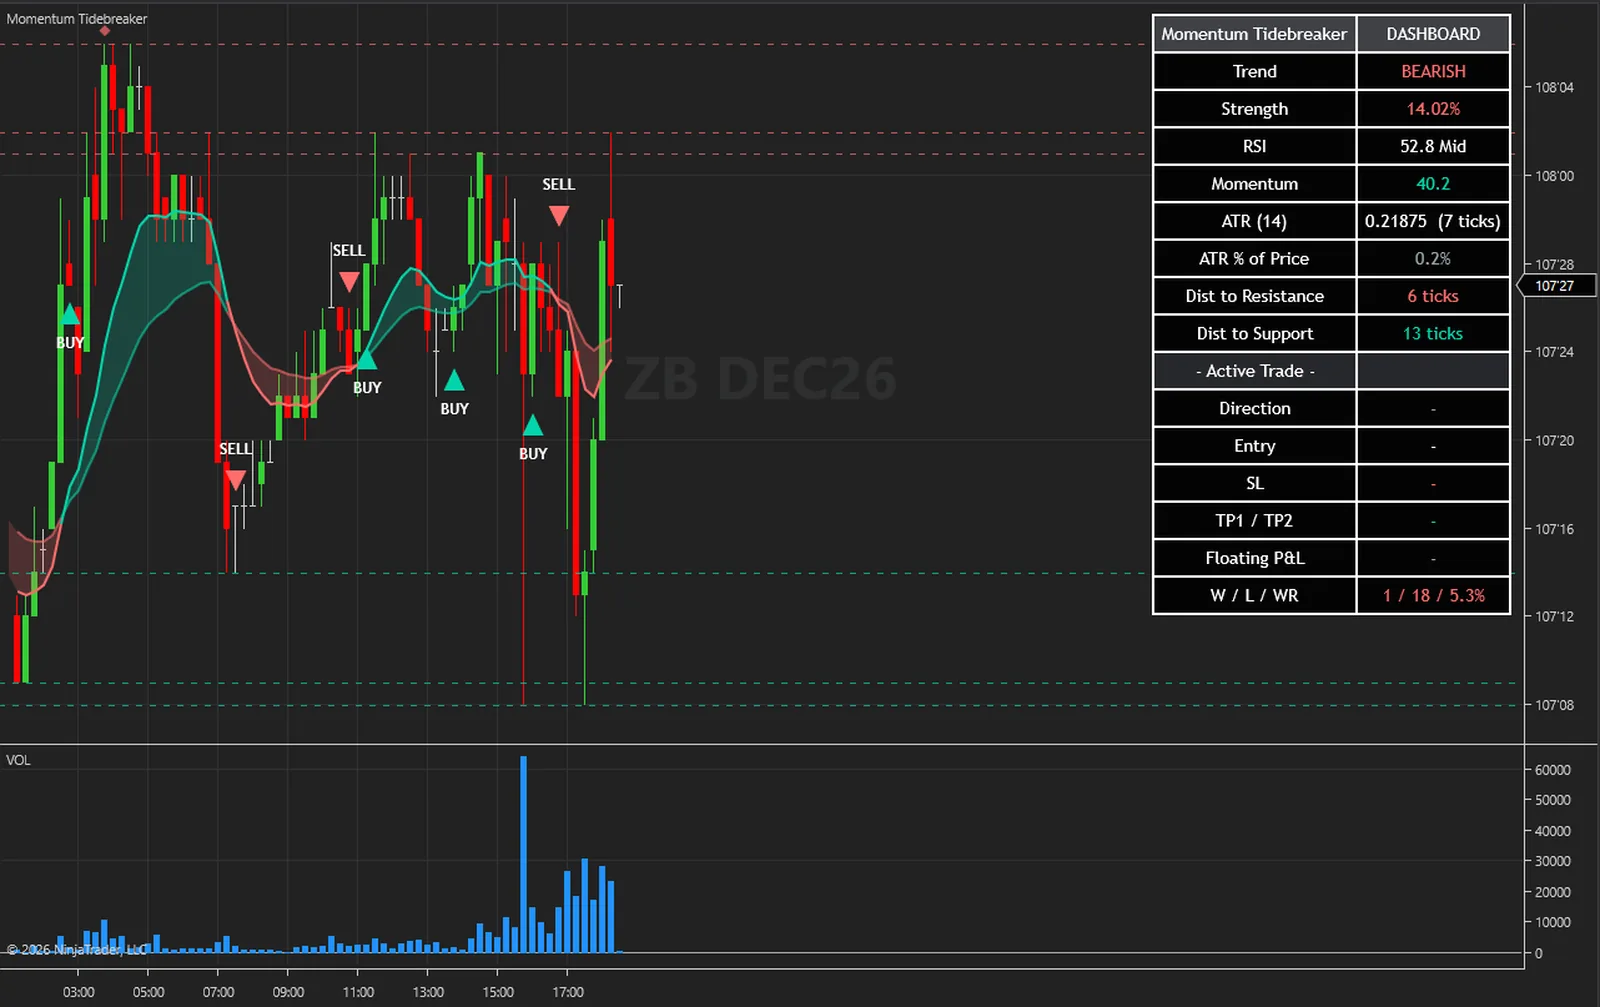
The same steps on every closed bar, in this order. Nothing hidden and nothing exotic.
The two EMAs and the trend direction, Strength from an ATR, RSI, and 5-bar momentum over a 10-bar ATR. A forming bar raises no signal, no target or stop hit and no marker.
A swing high or low confirmed Pivot Length bars after its own bar becomes a dashed ray. The most recent ones are kept, three per side by default.
Trend Cross, RSI Reclaim or Divergence, whichever is enabled. A BUY goes under the bar and a SELL over it. A diamond prints for a divergence whether or not it becomes a signal.
From the signal bar's close: a stop from the ATR, TP1 one risk away and TP2 at your ratio. A new signal replaces the trade before it. If a BUY and a SELL fire on one bar, the SELL is tracked.
On each following closed bar: TP2, then TP1, then the stop, and the first that is met wins. Alerts fire on live bars and the dashboard updates.
| Plain EMA cross | Momentum Tidebreaker | |
|---|---|---|
| Signals | Every cross | Three families, marked on closed bars |
| Conditions on the cross | None | RSI side of 50, Strength above 1 %, momentum |
| RSI and divergence | A second panel, read by eye | RSI reclaim of 50 and divergence diamonds on the chart |
| Support and resistance | You draw them | Rays at the most recent swings, per side |
| Stop and targets | You work them out | From the ATR, drawn at the signal |
| Trade tracking | None | Levels, floating P&L in ticks and a tally row |
| For your strategies | The EMAs | Thirteen series, signals and levels among them |
The engine that computes everything also runs outside NinjaTrader. With its diagnostic dump switched on, the NinjaTrader edition writes every committed bar with the values it drew; those bars are replayed through the engine outside the platform, and the two files are compared value by value.
On 4,923 MNQ 1-minute bars every one of the 70 series compared was equal on every bar. A second run, with Calculate set to each tick and the chart left live across the switch from history to live bars, gave the same result on 4,191 bars.
What that proves: the indicator receives exactly one closed bar per chart bar with the right open, high, low, close and volume, never double-feeds or skips a bar, and shows the values the engine produced. What it does not claim: it is a test of correct calculation, not of trading results, and it says nothing about future performance.
The full method is in the user guide: User Guide (PDF) and Installation and Quick Start (PDF).
No subscription and no renewal. Pay once and the indicator stays licensed to your NinjaTrader account, updates included.
Momentum TidebreakerNinjaTrader 8 indicator
$77one payment, lifetime licence
The licence is issued to your NinjaTrader account through NinjaTrader's Vendor Licensing, by hand, normally within a few hours and always within 24 hours of your form arriving. You get an email with the download link when it is done.
Because a licence cannot be handed back once it is on your account, a sale is final once the licence has been issued. If you paid and the licence has not been issued yet, email me and I will refund you in full. The user guide is public, so you can read exactly what the indicator does before you pay.
The full terms of sale and the privacy notice for buyers are one page each, in plain language.
Trading carries risk of loss. This is an analysis tool, not financial advice, and no indicator can promise a profit.
A forming bar raises no signal, no target or stop hit and no marker. Every signal, hit, diamond and alert belongs to a closed bar. Once drawn a marker does not change, and a trade's lines are drawn once, on the signal bar, and are not moved. A support or resistance ray can come from the forming bar: a swing is confirmed Pivot Length bars after its own bar, and a ray that a forming bar confirms goes away again if that bar's high or low then moves past the swing. On a closed bar it stays. OnEachTick and OnPriceChange make the EMAs, the fill and the dashboard follow the forming bar, and do not make a signal earlier. A signal on a session's final bar appears after the reopen.
A diamond marks the divergence condition. It becomes a signal only when the close is also back on the right side of the fast EMA and Enable Divergence Signals is on.
That is expected with the default levels. A STRONG signal needs a divergence buy or sell, a rare combination at 30 and 70, and it is always a Divergence signal, because the other two families need RSI on the other side of 50. Moving Oversold Level and Overbought Level towards 50 makes it more common.
No. They are ticks of the instrument. On MNQ, where the tick is 0.25, 50 ticks is 12.5 index points. Every price on the dashboard prints the nearest tick, and the ticks are calculated from the levels before that rounding.
The slow EMA has a value after Slow EMA Length bars, 26 at the default, and the RSI after RSI Length plus one. Until then the dashboard can read NaN. A ray needs Pivot Length bars on both sides of a swing. The indicator does not extend the chart's data: raise Days to load in the Data Series dialog. The EMAs, the tracked trade and the tally row count from the first bar loaded, so two charts with different history can differ for a while.
NinjaTrader 8.1 Desktop for Windows; the build is tested on 8.1.9.0. Any data connection that delivers bars works, including the free simulation connection.
No. NinjaTrader 8 is free to download and use for charting and simulation, with free real-time futures data for the simulator. A live account with a broker of your choice is a separate step that this indicator does not need. NinjaTrader is the platform it runs inside, not a broker.
No. The licence is tied to your NinjaTrader account login through NinjaTrader's Vendor Licensing, not to a PC. Log in on any installation and the indicator runs; a new PC needs no transfer.
I issue it by hand in the NinjaTrader Vendor Dashboard. It is normally done within a few hours and always within 24 hours of your form arriving, including weekends.
No. It is one payment of 77 USD for a lifetime licence on one NinjaTrader account, with future updates included.
Once the licence has been issued the sale is final, because a licence on your account cannot be handed back. That is why the user guide is public: read it first. If you paid and the licence has not been issued yet, email me and I will refund you in full.
Yes. Email me from the address you bought with and I will move the licence to your new account login.
No indicator can promise that, and this one does not. It gives you closed-bar trend and momentum signals, and a stop and targets from the ATR to plan around. What you do with that, and how you size positions, decides the outcome.
Each one is a compiled NinjaScript Add-On, 77 USD once, with its own page, charts and public user guide.
The closes that would print your RSI levels, drawn as bands with a midline, a trend regime, signals scored in five layers, a stop, three targets and a dashboard.
$77 one payment, lifetime licence
A range filter whose turns are scored with RSI side, EMA side, a higher-timeframe EMA and a volume burst, with star-rated plates, a percentage stop, five targets, reversal diamonds and a dashboard.
$77 one payment, lifetime licence
Finds sideways ranges from swing highs and lows, builds a volume profile with a point of control inside each, marks failed moves with a diamond, and draws an entry, a stop and three targets on each confirmed break.
$77 one payment, lifetime licence
77 USD once. A lifetime licence on your NinjaTrader account, updates included, and the licence issued within 24 hours.


