Levels picked by rule
The two value-area edges, up to two peaks and one ranked row per profile at the defaults. Troughs, the POC and more ranked rows are switches, and Avoid Overlap blocks a new level that overlaps an active one.
 NinjaTrader 8 indicator, NinjaScript
A volume profile shows where volume traded and leaves the rest to you: which rows count as levels, which ones price has already gone through, and what the last close did at each of them. Supreme Dynamic Profile rebuilds a profile of the most recent closed bars, turns its value-area edges, peaks and ranked rows into levels that run to the right, colours each level by the side of the last close against it, and marks the closed bars that break a level or are rejected by it. The volume is estimated from bars, not read from exchange bid and ask data.
$77one payment, lifetime licence
Get the lifetime licence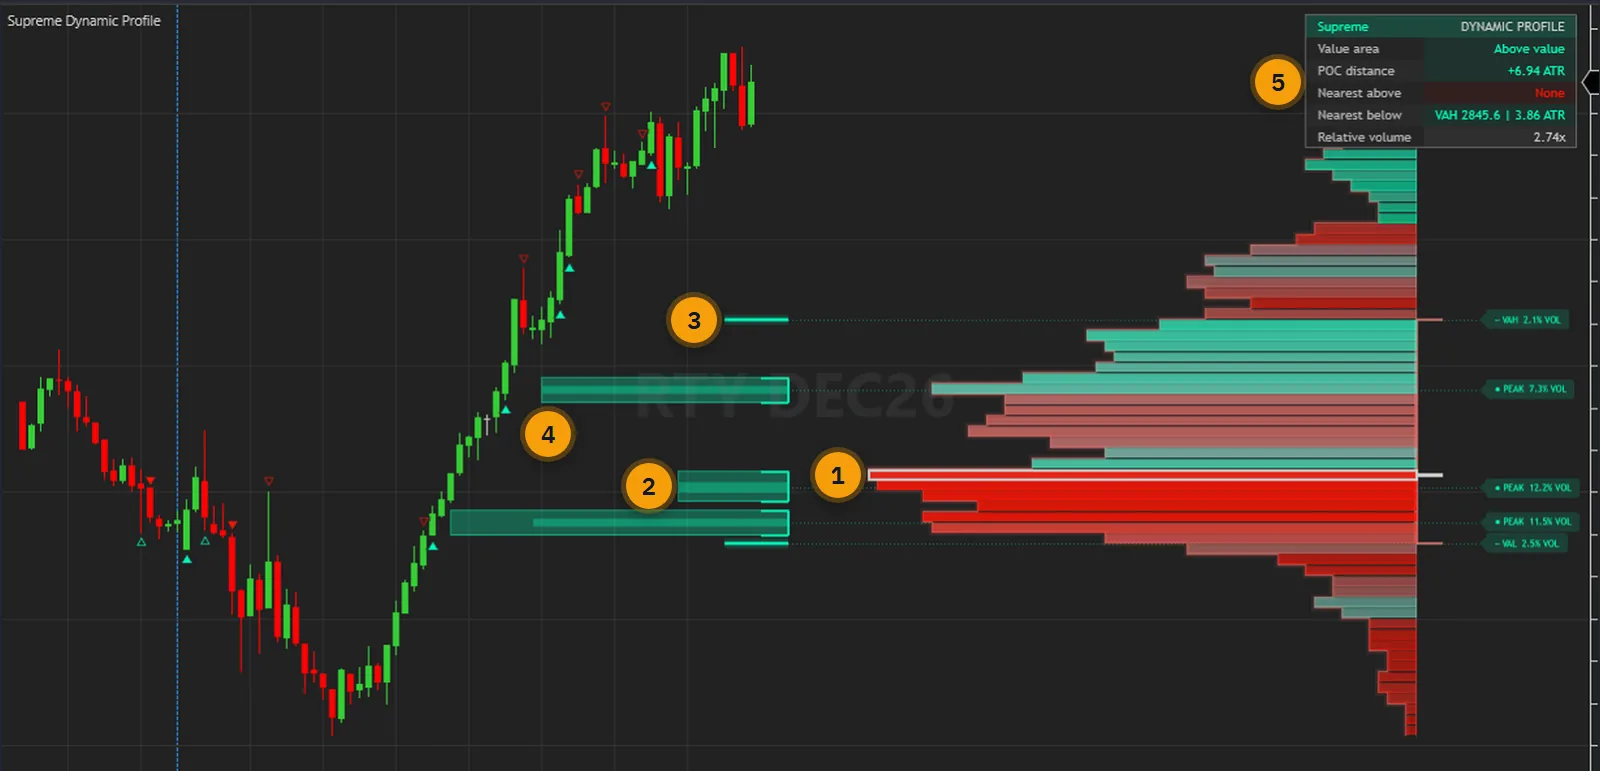
A plain volume profile is a histogram. It shows where volume traded, and from there the work is yours: decide which rows count, draw them, and keep track of which ones price has already gone through.
Then comes the reading. A row price closed through an hour ago and a row it has not reached yet look alike on a histogram, and nothing on it tells you that the last bar came back from one of them.
Supreme Dynamic Profile picks the levels by rule, colours each one by the side of the last close, and marks the closed bars that break or reject them. Its window is a count of closed bars, so nothing resets at a session start and a profile can span a session gap. What it reads is bars: each bar's volume is spread evenly over the rows it covered, so this is estimated volume at price and an estimated up and down split.
The user guide is public: every parameter and the verification are in it. Read it before you pay.
One indicator in the price panel: the profile, the levels, the marks and the table together.
The two value-area edges, up to two peaks and one ranked row per profile at the defaults. Troughs, the POC and more ranked rows are switches, and Avoid Overlap blocks a new level that overlaps an active one.
Fixed covers the last 240 closed bars by default. Dynamic starts at the latest confirmed pivot inside that limit and also rebuilds on a new pivot. The profile is rebuilt every 5 closed bars, or every bar if you set 1.
A level turns green when a bar closes above it and red when a bar closes below it, and stays neutral until either has happened. Its price does not move. Levels near price are drawn stronger.
Filled triangles for breaks, hollow triangles for rejections, diamonds for retests, at most one per direction per bar. Retests need Stop Extending On Break off, because at the default a level stops at its break.
Signal Levels, Signal Cooldown and Minimum RVOL decide what counts, for the marks and the alerts alike. At the default the POC and the value area give no signal; All Levels adds them.
Directional colours a row by its estimated up and down volume. Row length is volume, not buying or selling pressure. Use Lower Timeframe, off by default, builds from smaller candles on second and minute charts.
Where price sits against the value area, its distance from the POC in ATRs, the nearest visible level above and below, and relative volume. Detailed adds six rows, including the profile's window and the last signal.
Breaks, rejections and retests on each side, a new key level, and two Any switches, each its own setting. They land in the Alerts Log, with sound and email channels when you turn them on, in realtime only.
Seven event series that read 1 on the closed bar of the event, and Developing POC, VAH and VAL. A NinjaScript strategy can read them, and the Market Analyzer can show them as columns.
Every picture below is a NinjaTrader 8 capture with numbered notes added. Nothing on the charts is drawn by hand. Click any image to enlarge it.
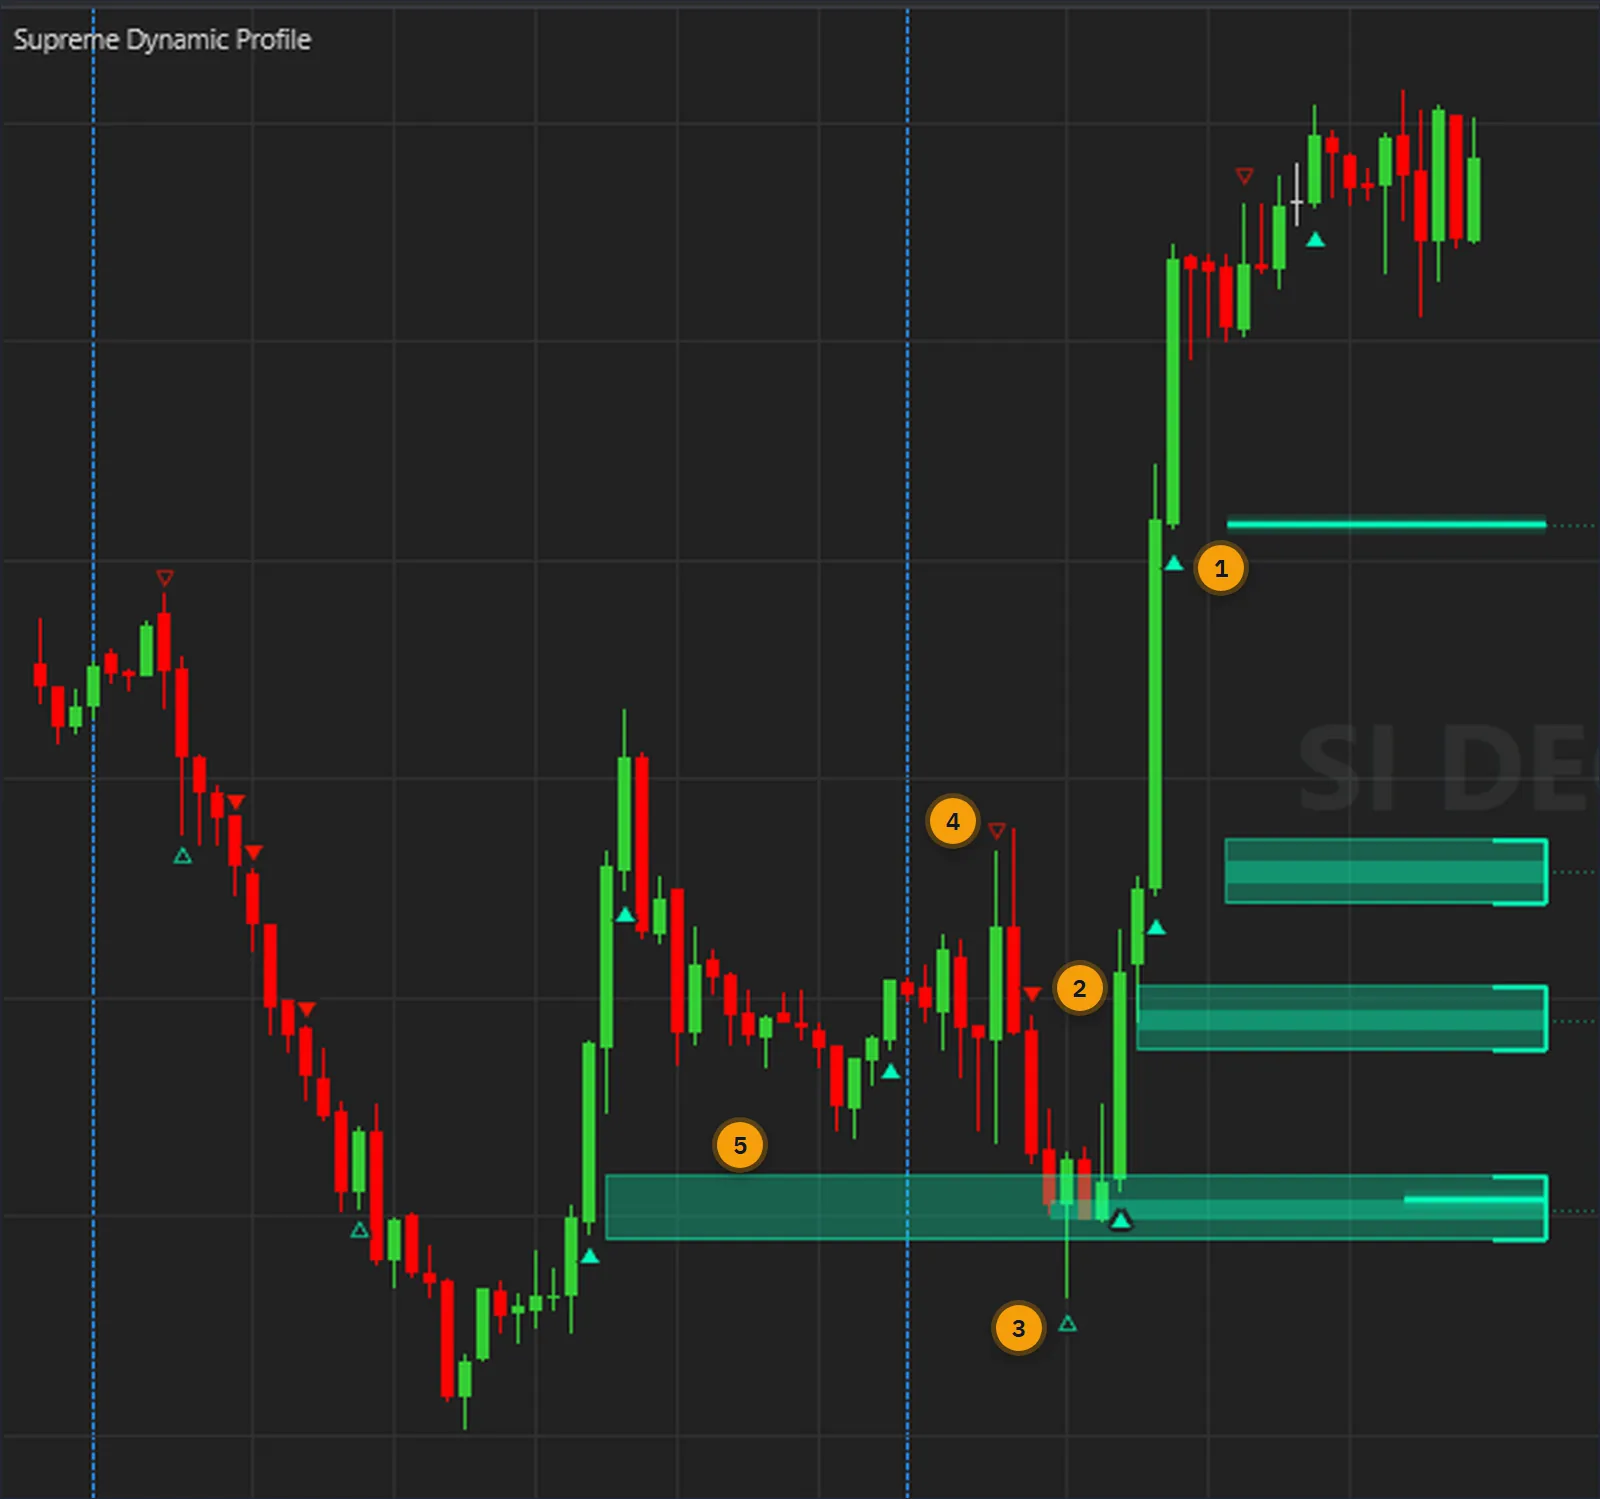
Each active level is checked once per closed bar. A touch starts an episode. A close on the other side of the level is a break, and a close back on the side price came from is a rejection. On one level a break takes priority over a retest, and a retest over a rejection.
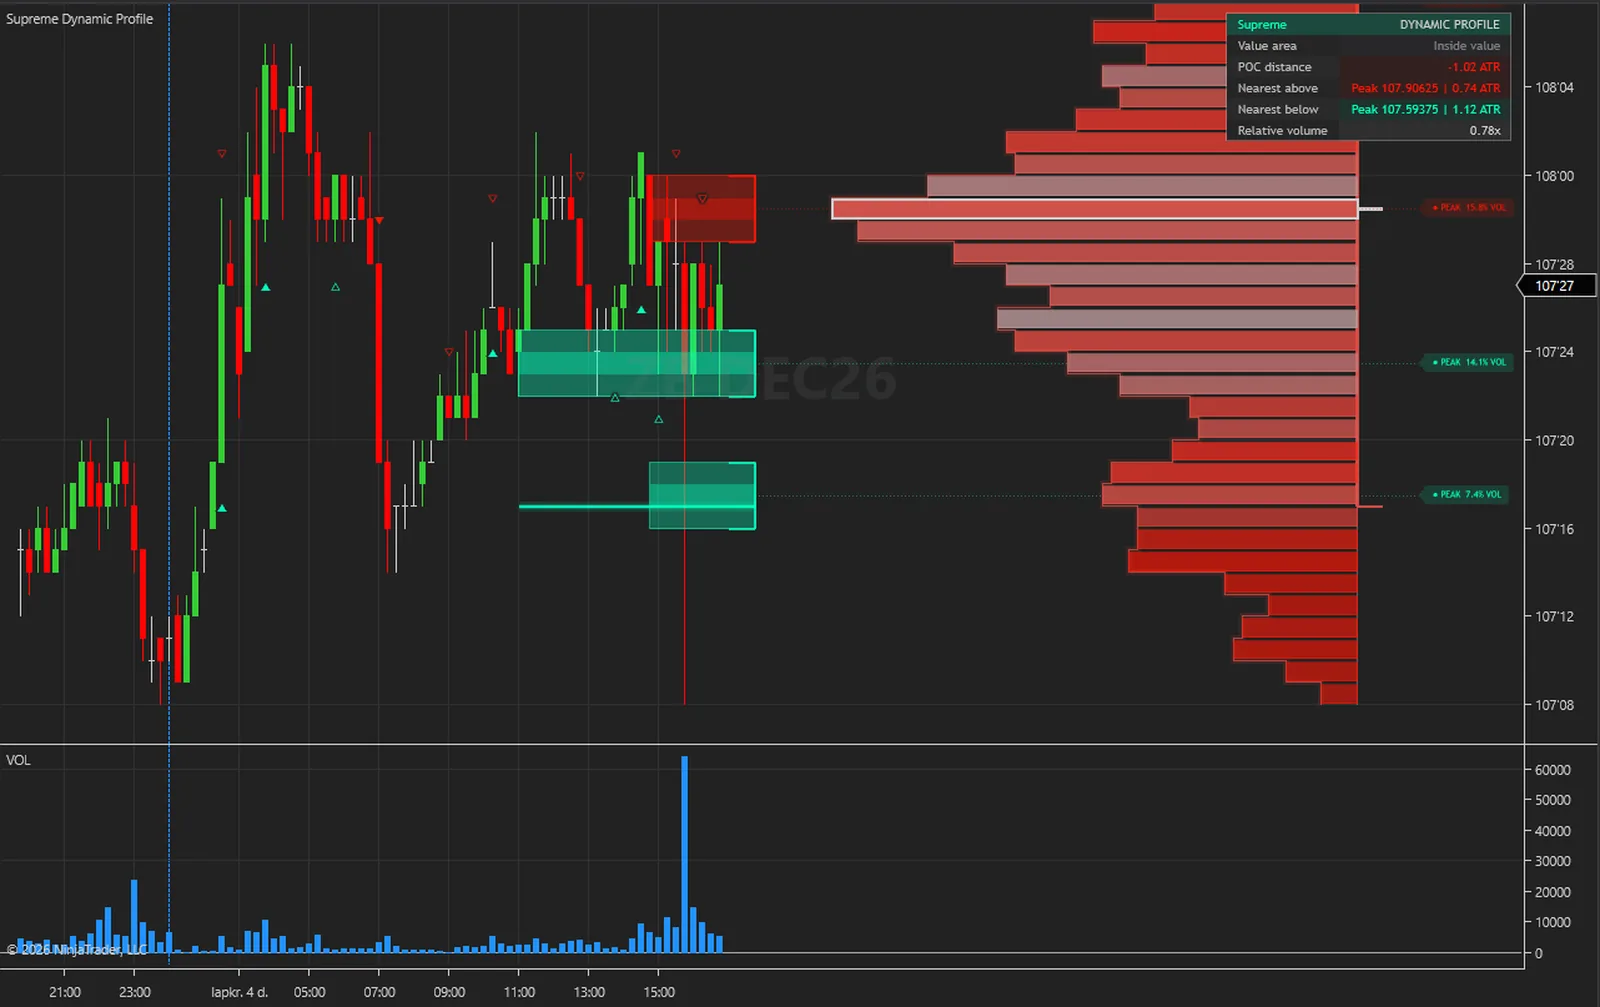
A mark describes the close. It says nothing about the next bar, and on this chart a bearish break is followed within a few bars by a sharp rise. The charts here are at the defaults, so they show no retest diamonds: those need Stop Extending On Break off.
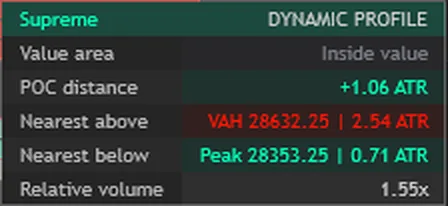
The table answers the questions you would otherwise read off the profile. Is price inside the value area? How far is it from the POC, in ATRs? Which visible level is next on each side, and how far away? Is this bar busy against the bars before it?
This is the default Compact layout, here on NQ. Detailed adds six rows: the profile's window and age, its volume, the sampling, the up and down estimate, the level counts and the last signal. The table is painted on top, so near the top of a chart it can cover profile rows and a level's label. Position moves it to another corner.
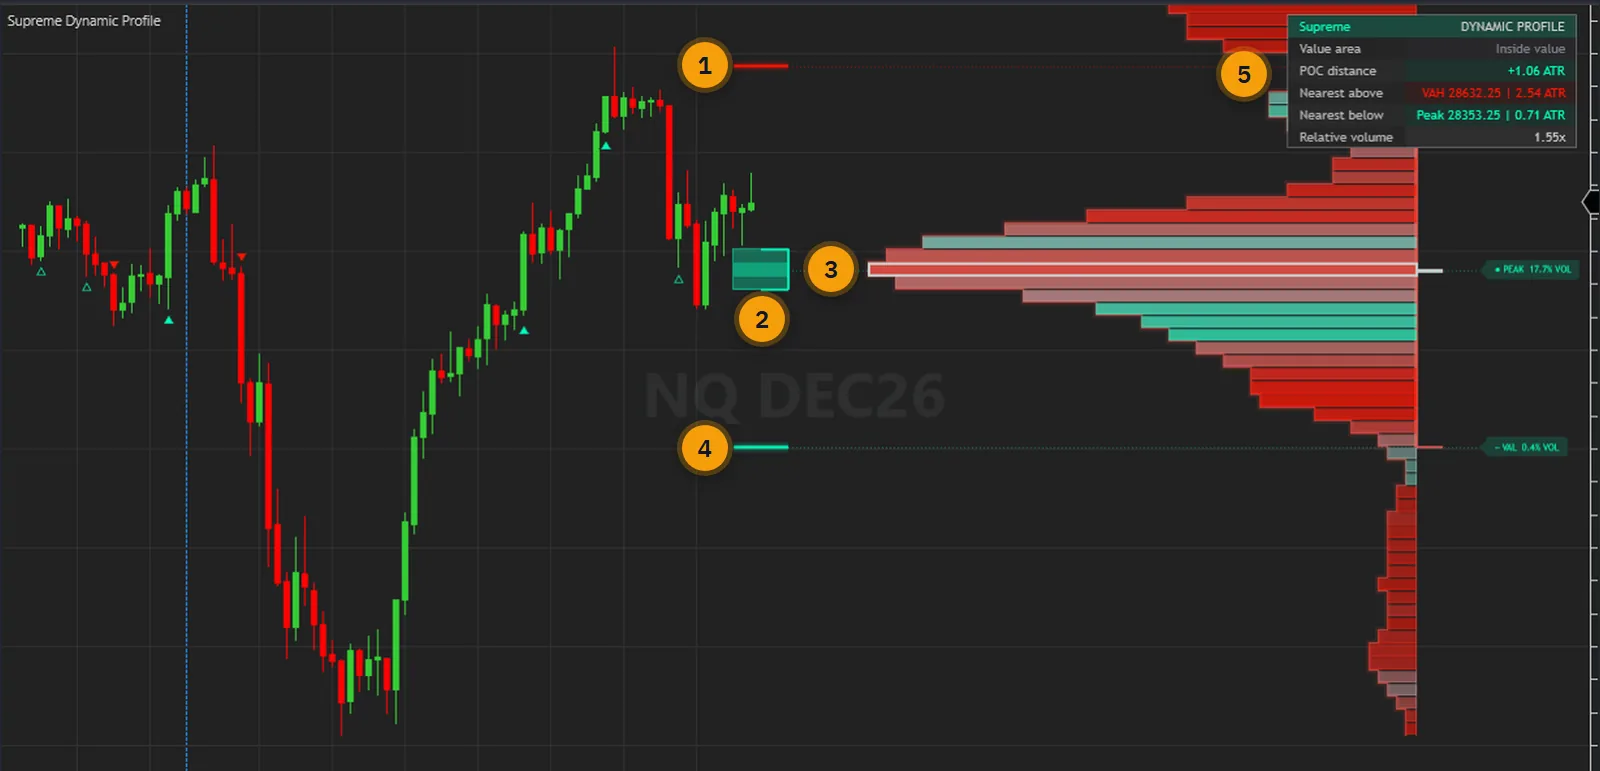
On this chart price sits between a red value-area high and a green peak zone. The colour says which side a bar last closed on. Levels live on from one profile to the next, so a level built earlier stays in view after the profile has moved on, until a close breaks it or it expires 500 bars after it was created.
The label on a level gives its share of the profile's volume when the level was created. That figure is fixed and describes the bars of that window. It is not a probability of profit. Visible Active Nodes limits how many levels are drawn, and levels past that limit stay tracked and can still alert.
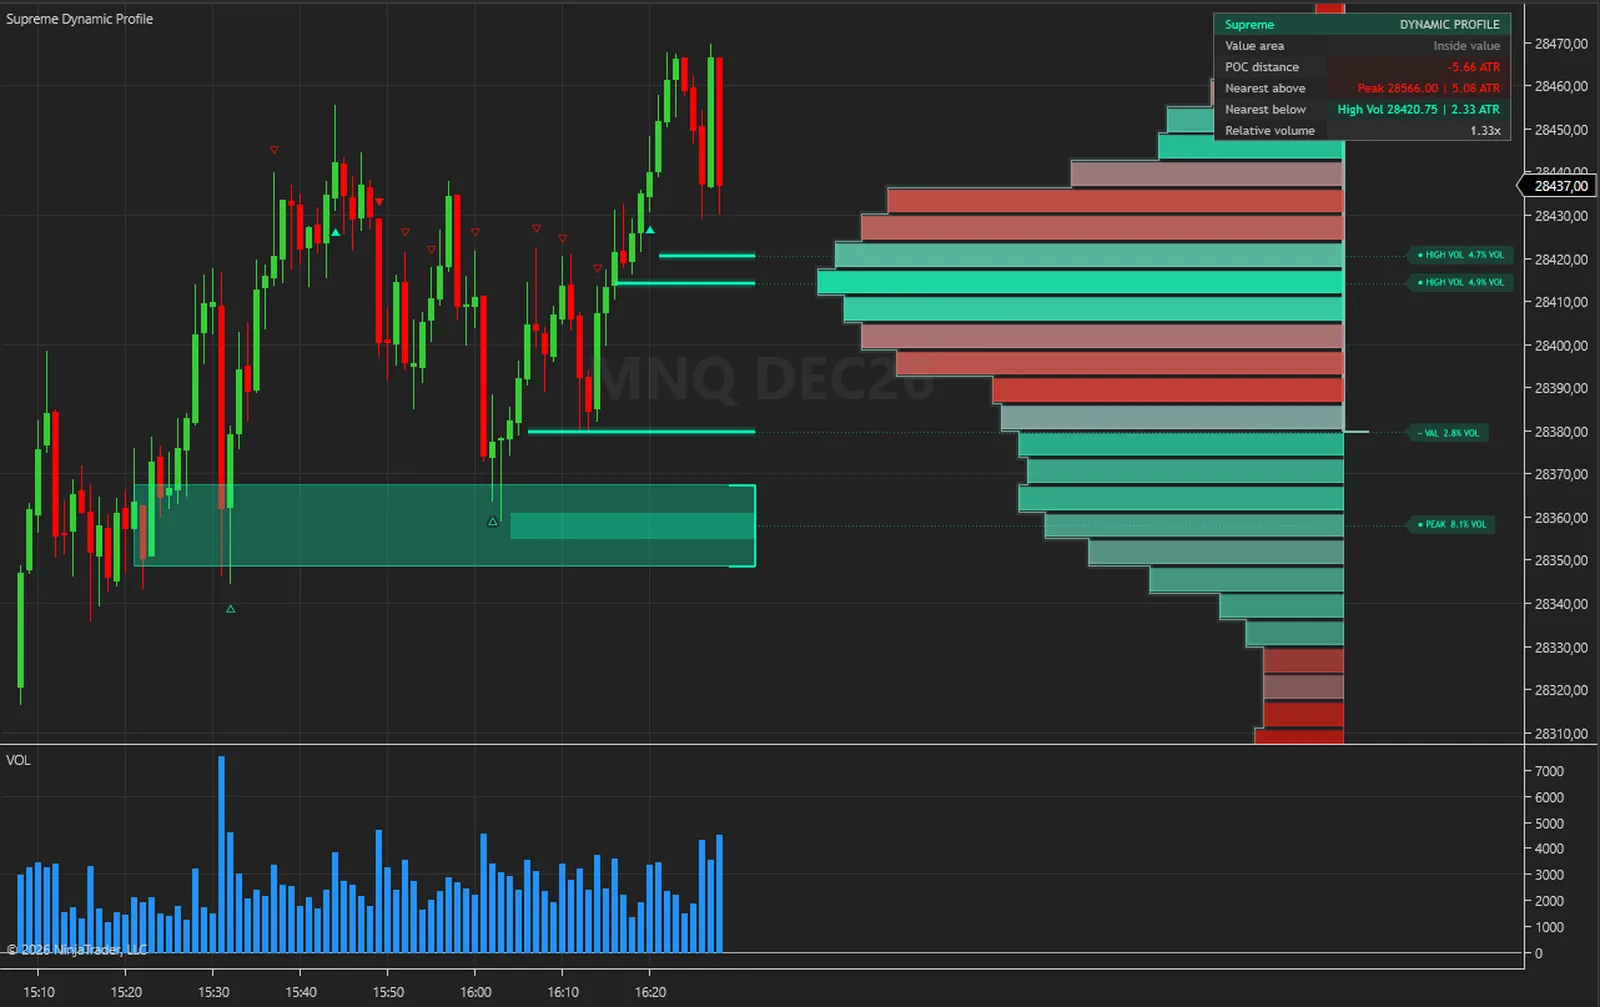
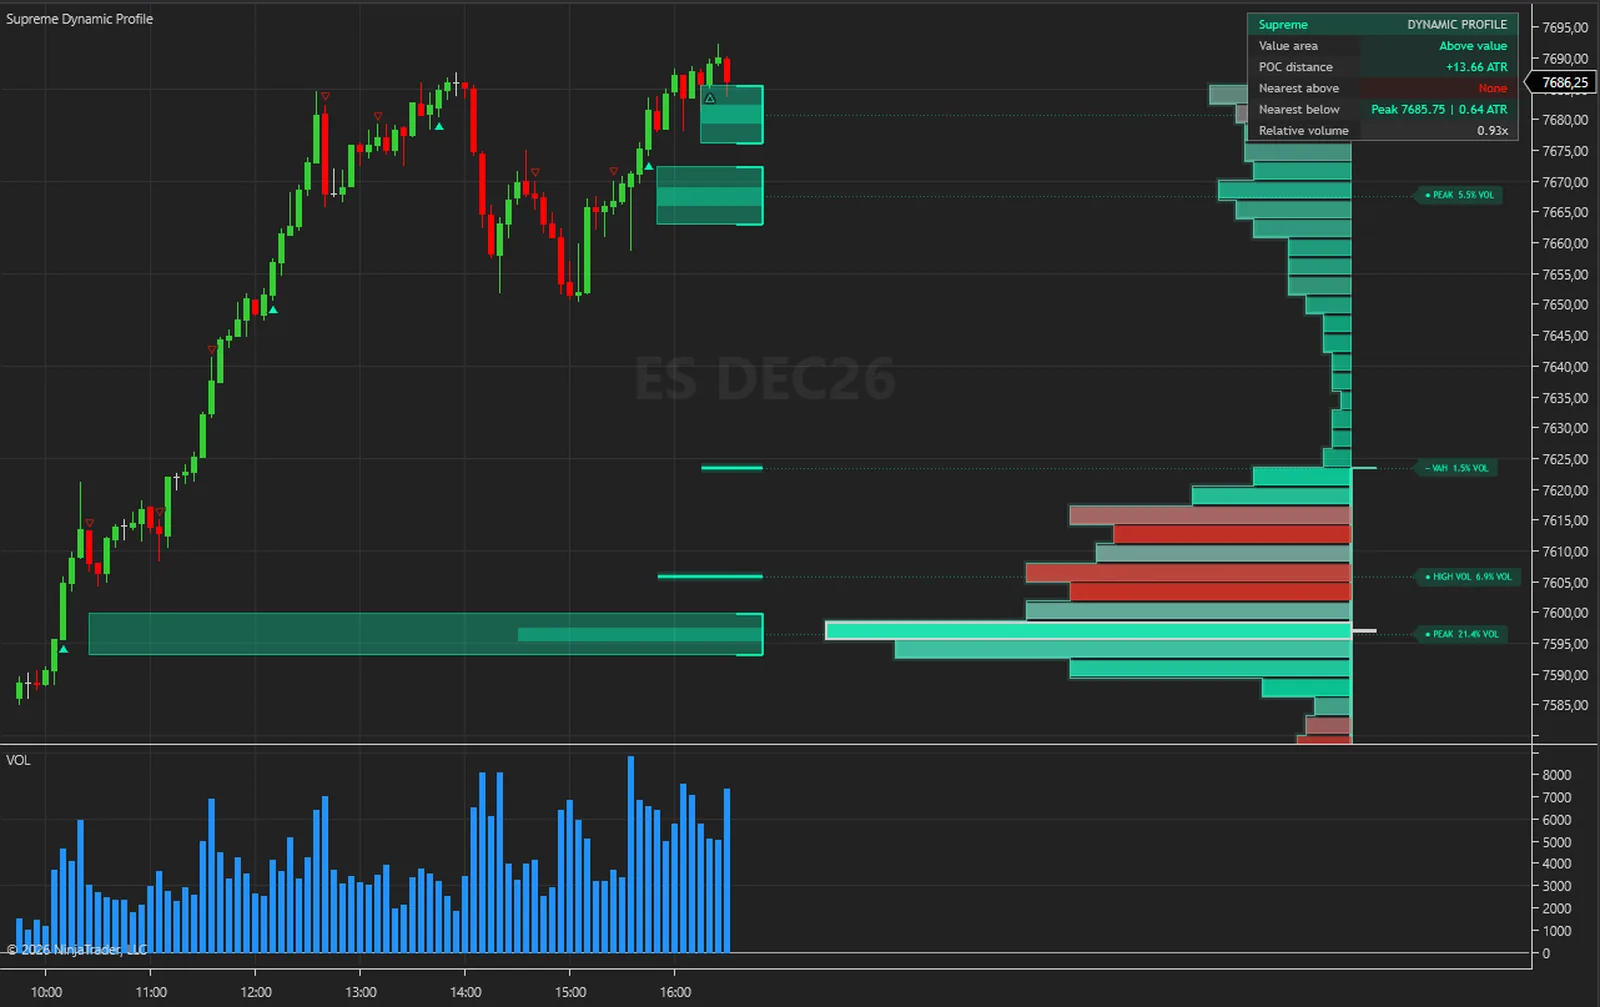
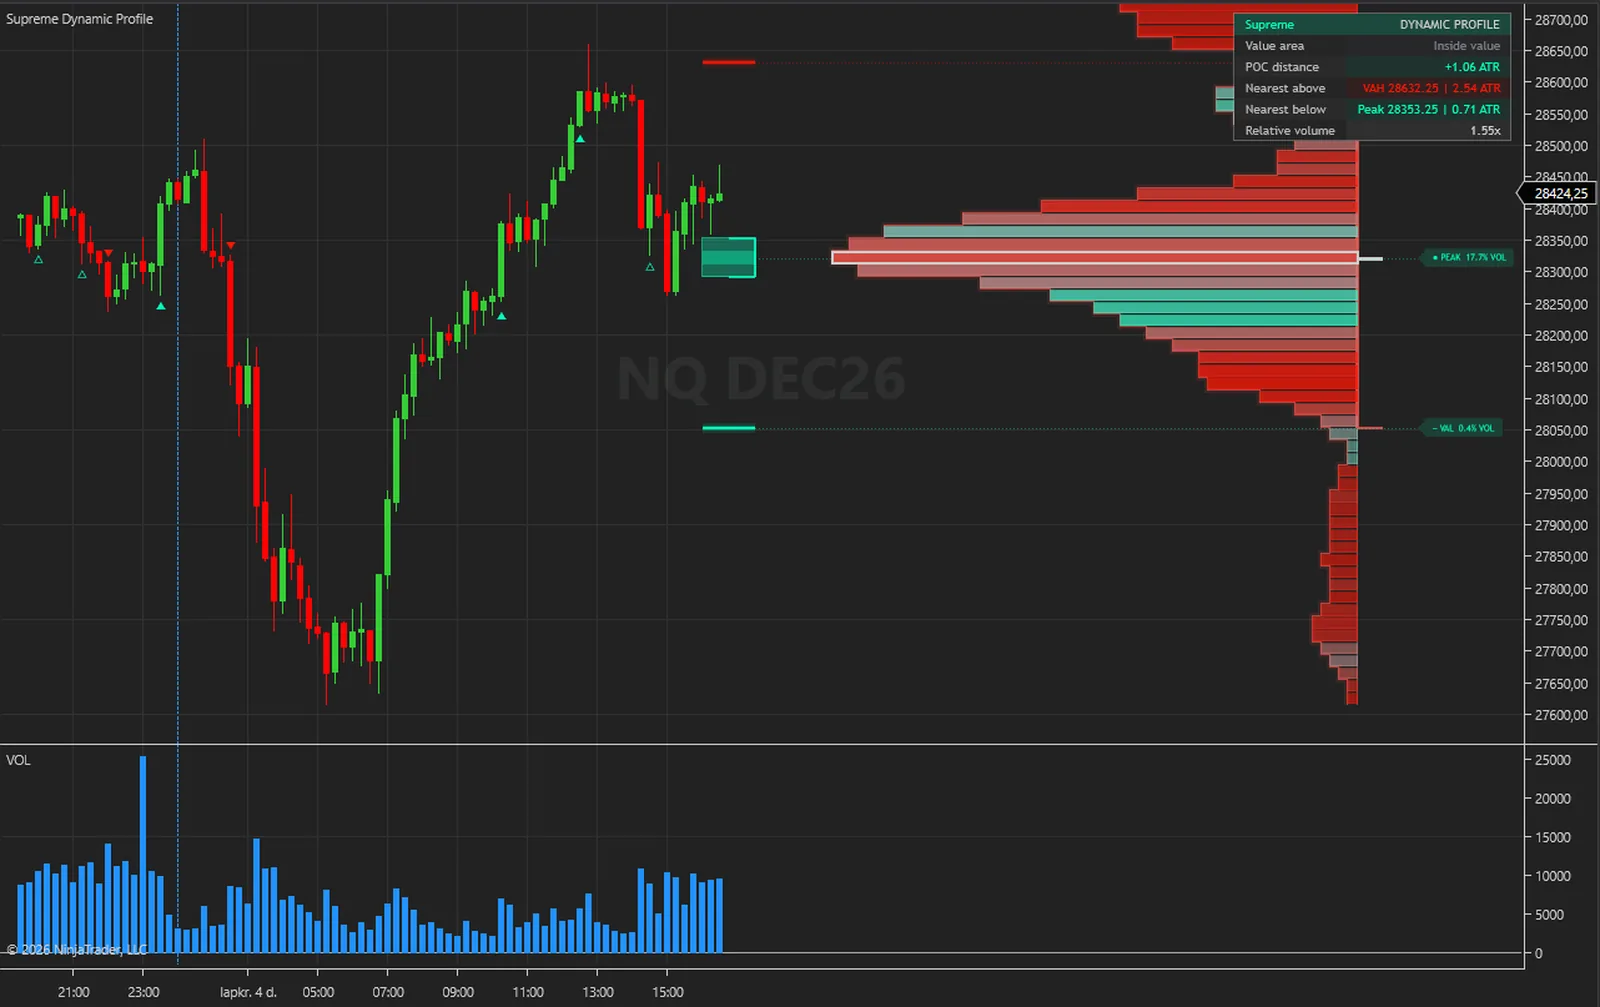
The calculations are not tied to an instrument. The captures below were taken in NinjaTrader 8 on the free simulation feed: index, energy, metal, currency and rate futures, from 1-minute to 30-minute bars, with the indicator at its default settings on every one.
On a futures chart the profile reads real contract volume from the bars and spreads it evenly over the rows each bar covered, so it is an estimate at price, not exchange bid and ask data. The chart's Trading Hours template decides which bars exist: on an ETH template the overnight bars count towards the window and on an RTH template they do not. A feed without volume gives no profile: the table reads No volume profile and no levels appear.
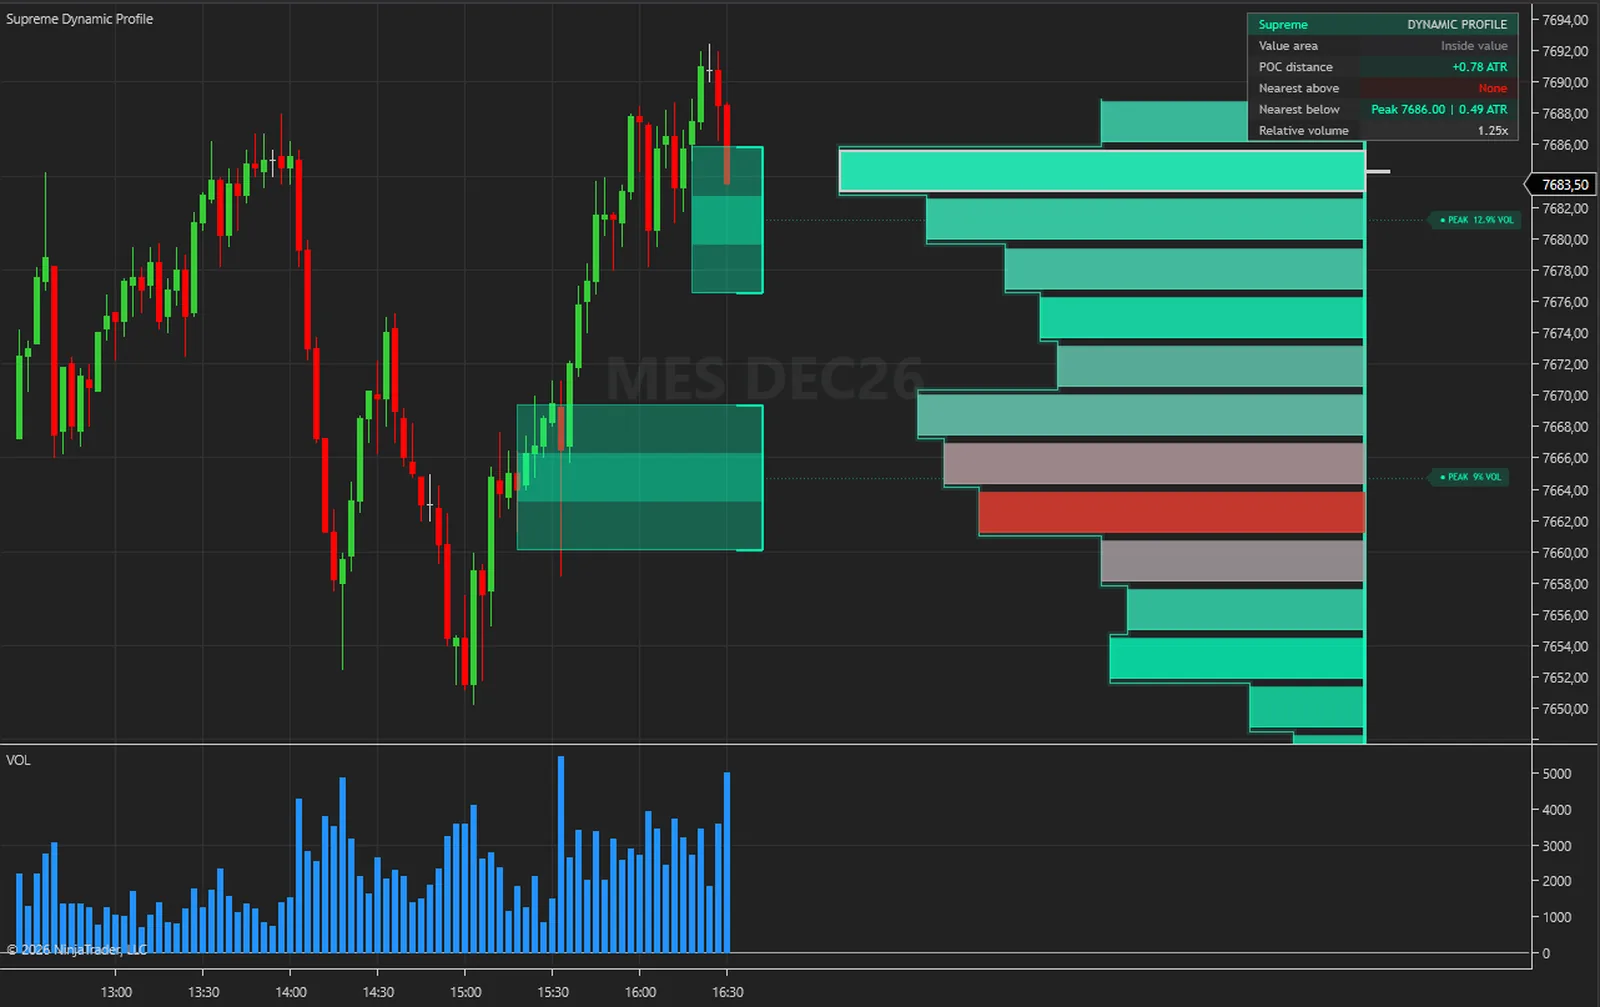
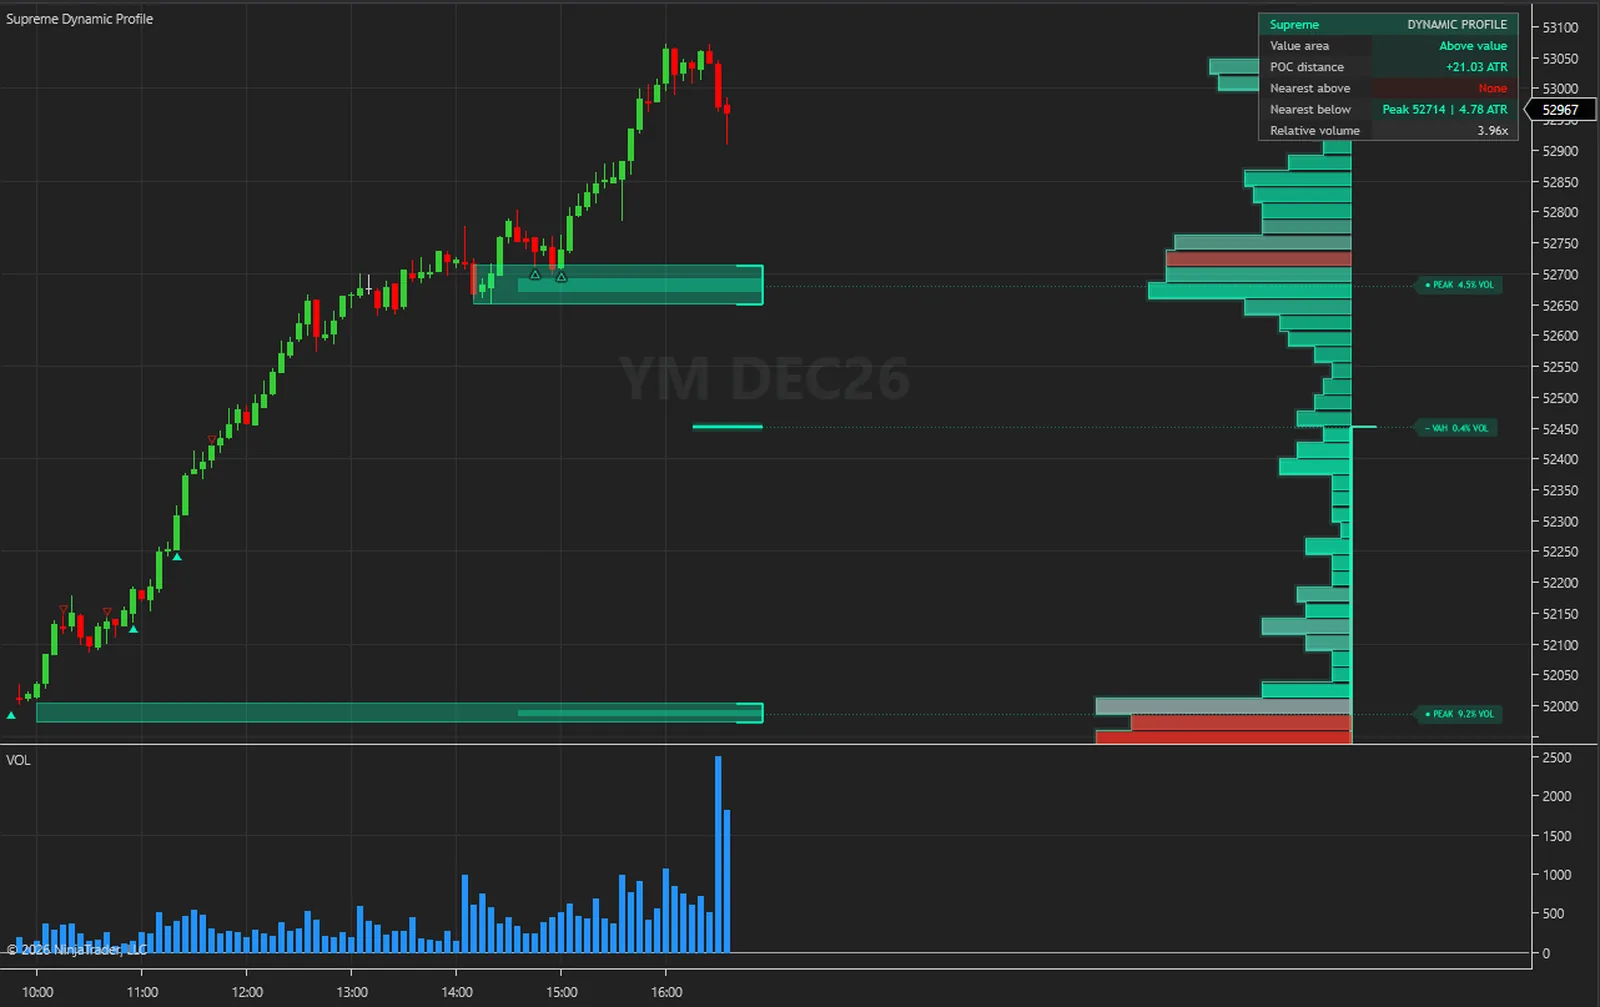
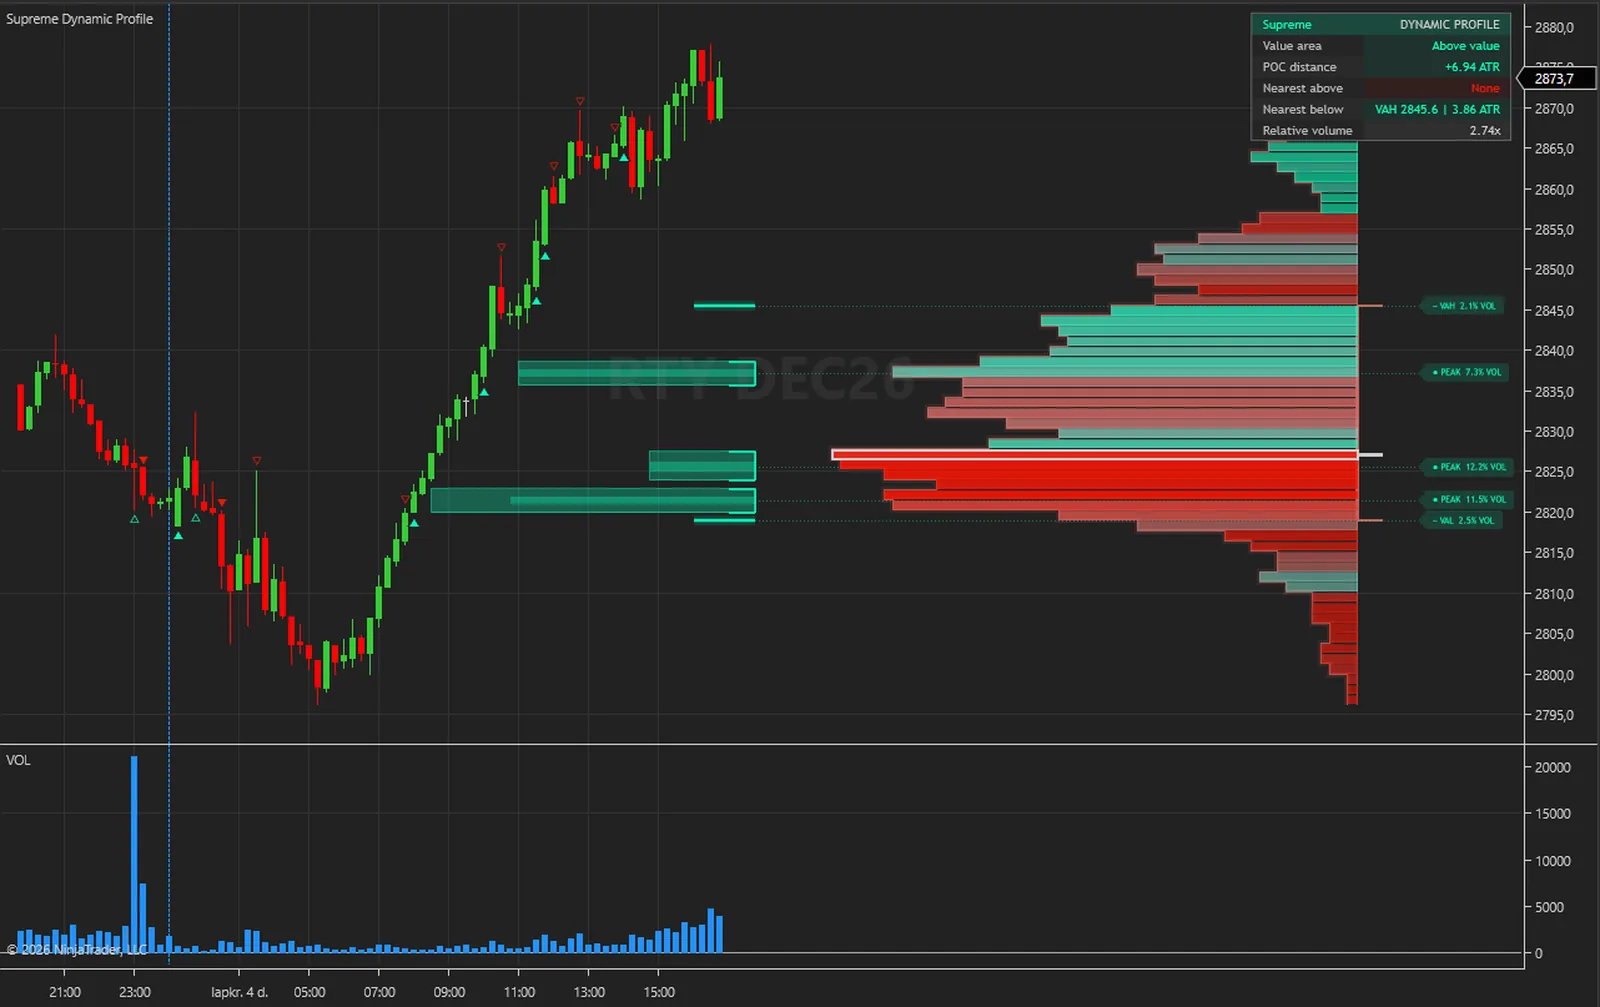
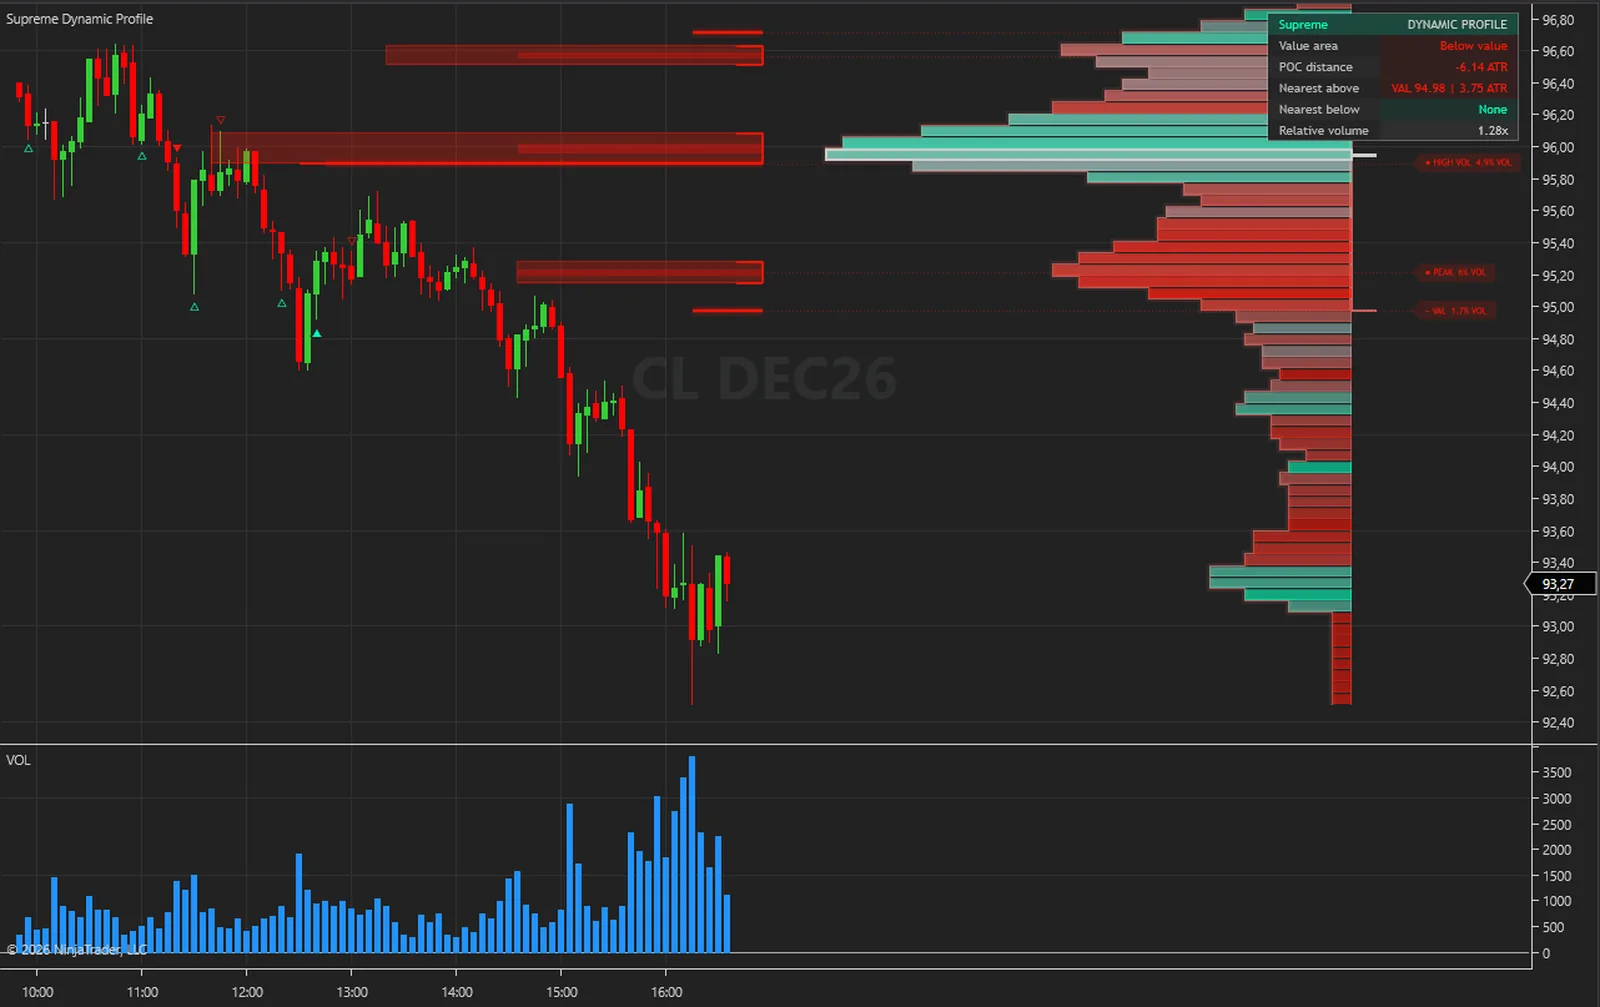
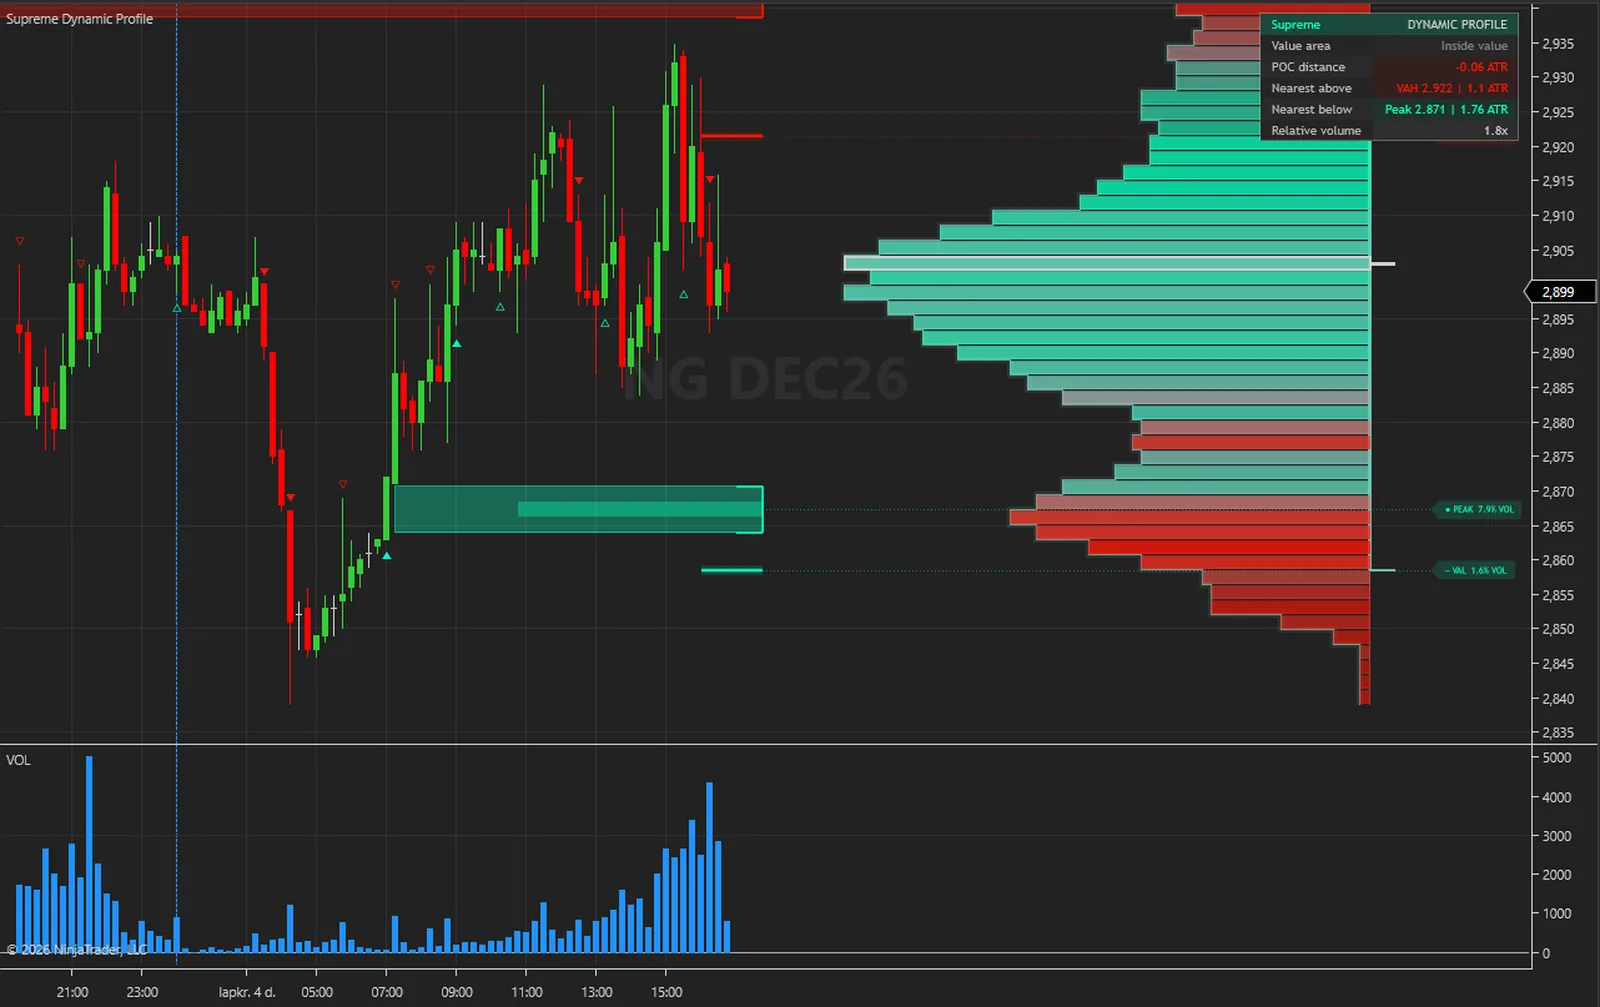
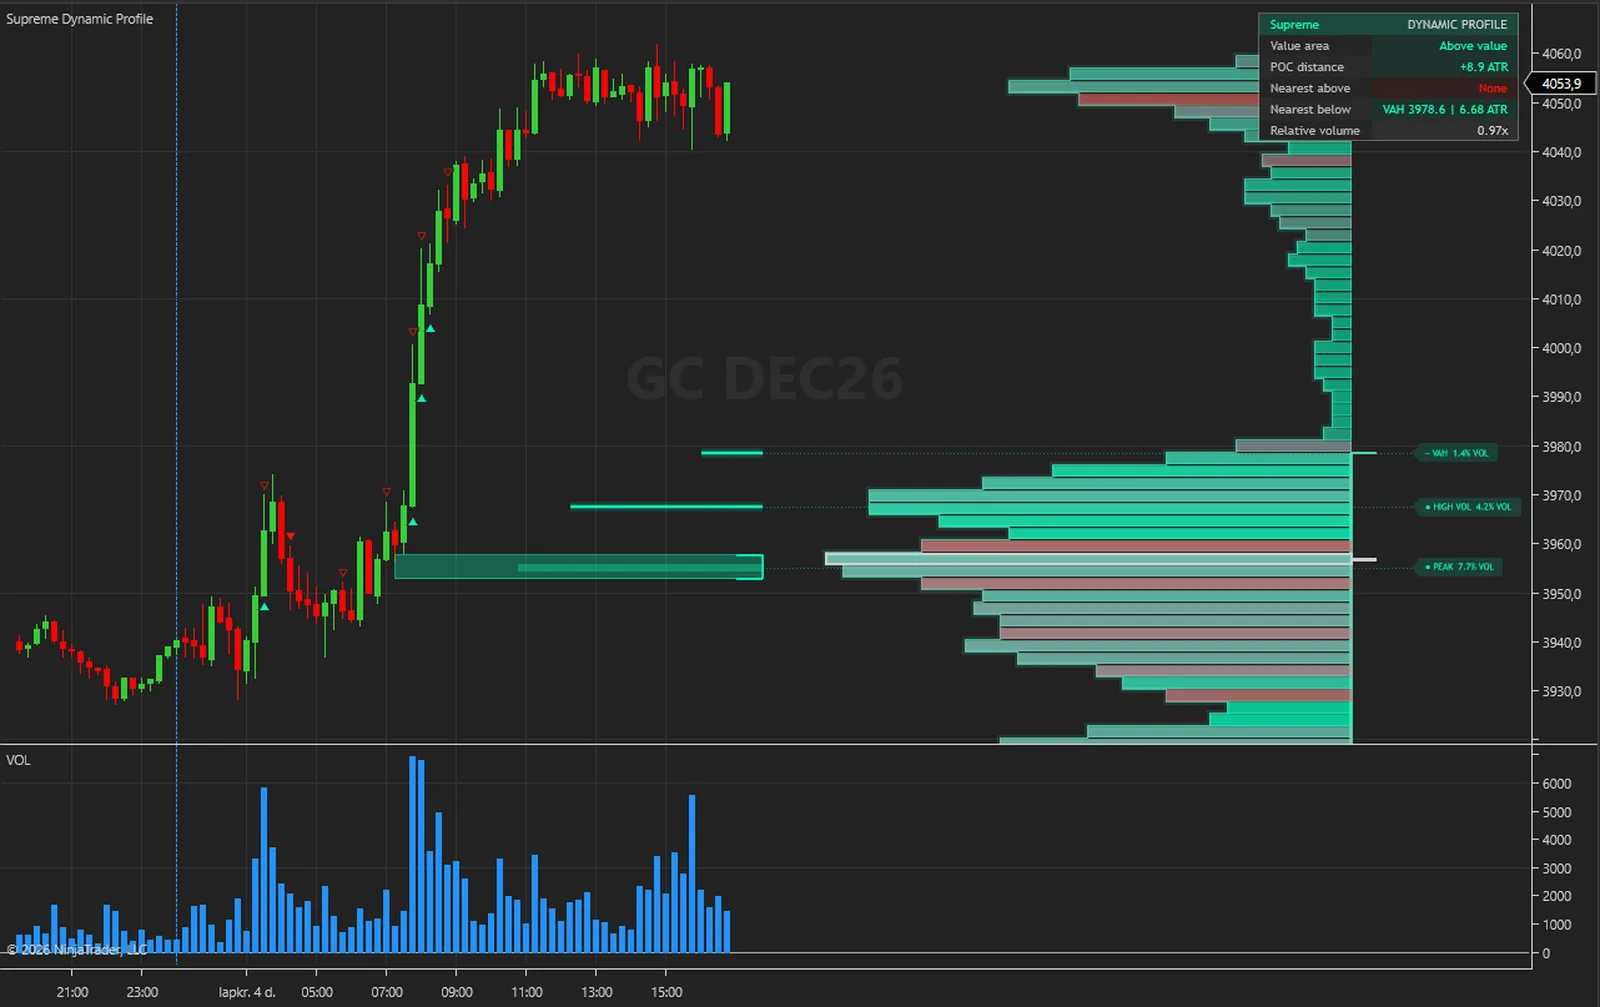
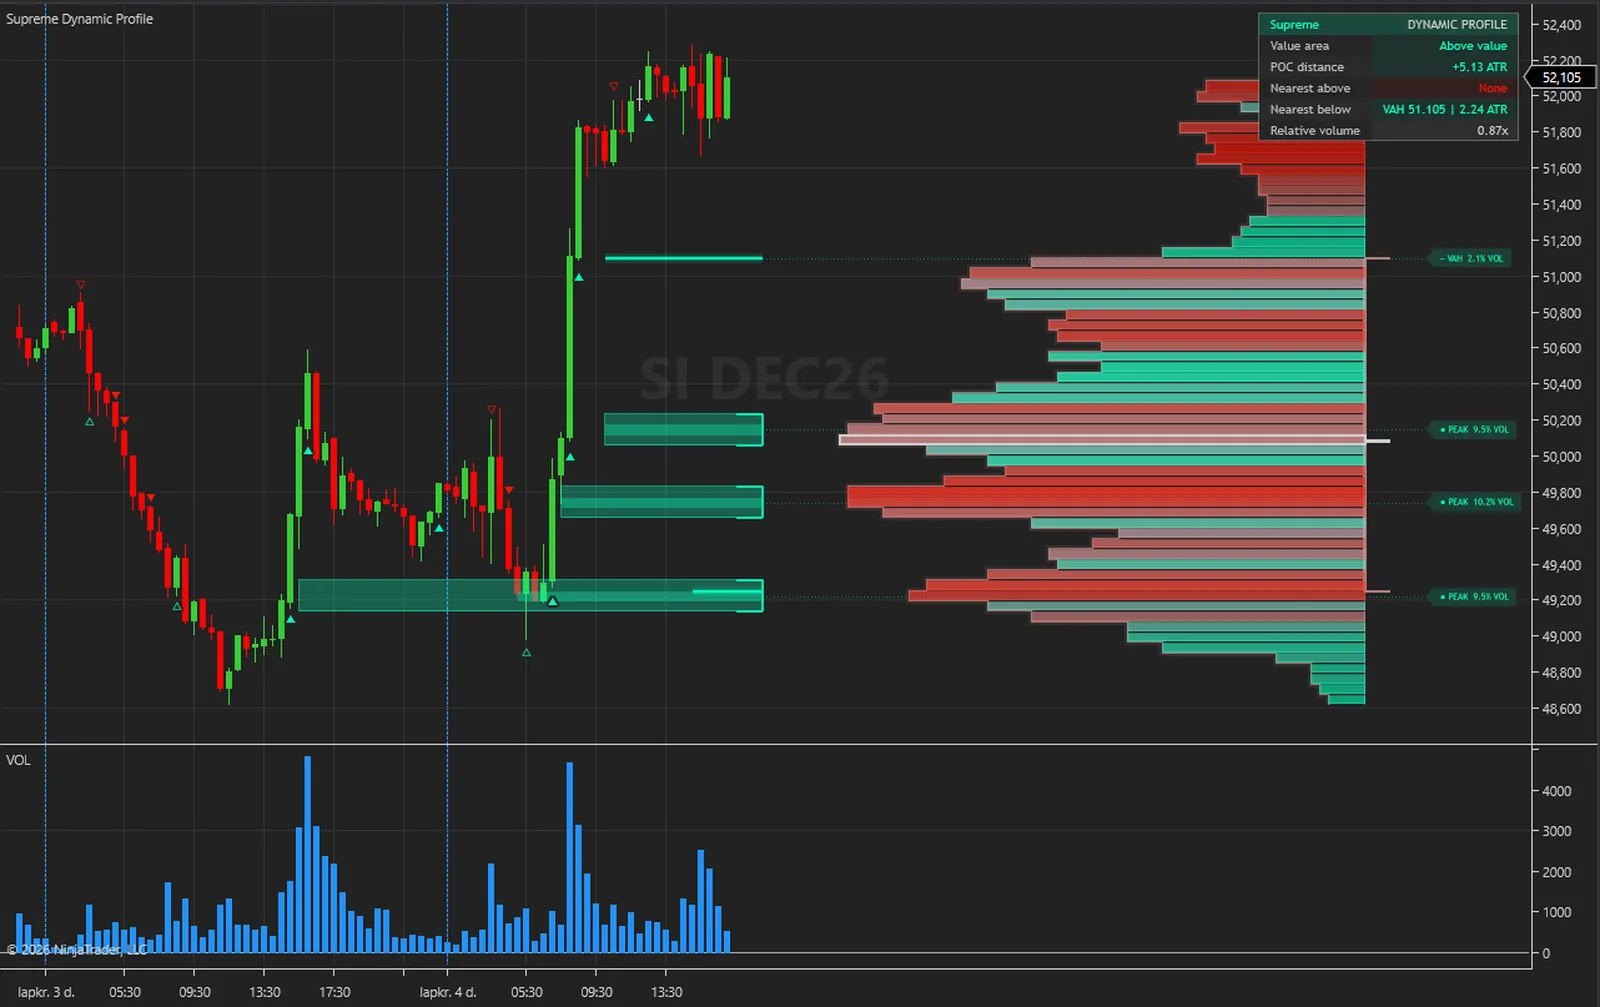
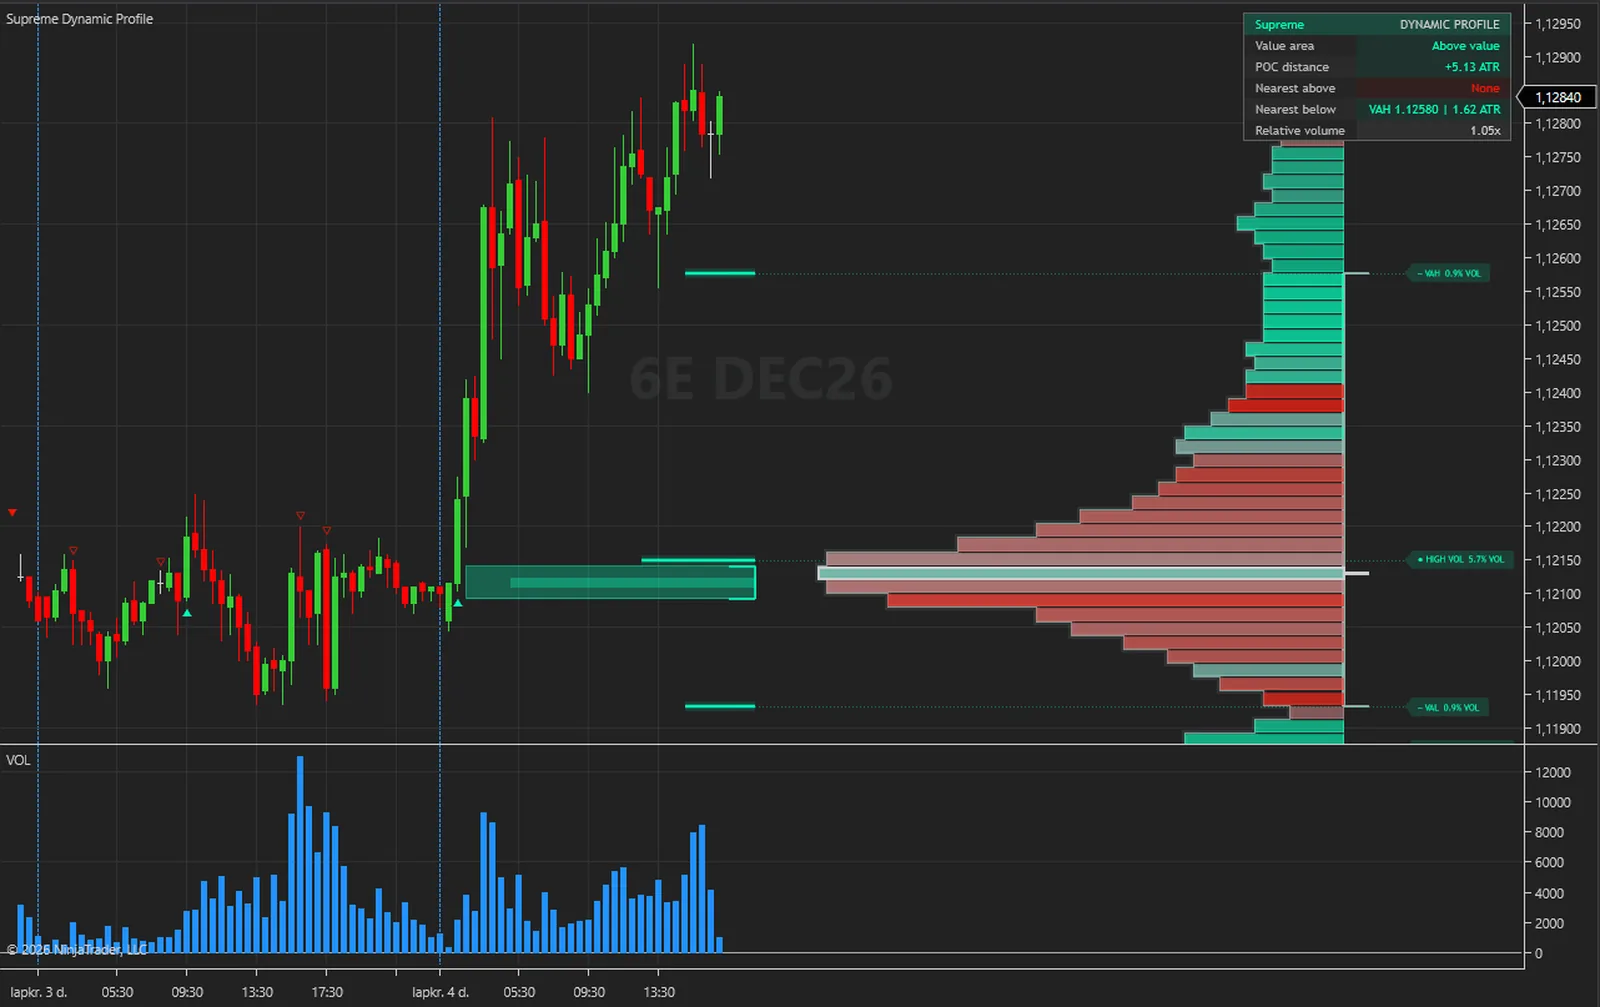
The same steps on every closed bar. Nothing hidden and nothing exotic.
Fixed counts back the Lookback Limit, 240 closed bars by default. Dynamic starts at the latest confirmed pivot inside that limit. The profile is rebuilt on every Refresh Every N Bars closed bar, 5 by default.
Each bar's volume is spread evenly over the rows its range covered, 64 rows by default. It counts as up volume for a close above the open, down for a close below it, and half and half for a close at it.
The band around the busiest row that holds 70 % of the volume gives the two edges. Rows busier than their neighbours give peaks, and the busiest row that is not already a level gives a ranked row.
From the bar after it was created. A bar touches a level when its range reaches it. A close on the other side is a break, and a close back on the side price came from is a rejection. A touch and a close on the break's side within Retest Window bars is a retest.
Signal Levels, Minimum RVOL and Signal Cooldown accept or refuse the event. The mark prints, the level's colour follows the close, the table updates and, in realtime, the alert fires.
| Plain volume profile | Supreme Dynamic Profile | |
|---|---|---|
| Levels | You draw them | Value-area edges, peaks and ranked rows, by rule |
| Level colour | One colour | Green or red from the last close against it |
| After a break | You keep track | The level stops at the close, or stays for retests |
| Closes at a level | You read them off the candles | Break, rejection and retest marks on closed bars |
| Where price sits | You work it out | A table: value area, POC distance, nearest levels |
| Which marks count | No marks to filter | Level types, a cooldown and a minimum relative volume |
| For your strategies | The histogram | Ten series, seven of them events |
The engine that computes everything also runs outside NinjaTrader. With its diagnostic dump switched on, the NinjaTrader edition writes every committed bar with the values it drew; those bars are replayed through the engine outside the platform, and the two files are compared value by value.
On 4,923 MNQ 1-minute bars every one of the 221 series compared was equal on every bar. A second run, with Calculate set to each tick and the chart left live across the switch from history to live bars, gave the same result on 4,191 bars.
What that proves: the indicator receives exactly one closed bar per chart bar with the right open, high, low, close and volume, never double-feeds or skips a bar, and shows the values the engine produced. What it does not claim: it is a test of correct calculation, not of trading results, and it says nothing about future performance.
The full method is in the user guide: User Guide (PDF) and Installation and Quick Start (PDF).
No subscription and no renewal. Pay once and the indicator stays licensed to your NinjaTrader account, updates included.
Supreme Dynamic ProfileNinjaTrader 8 indicator
$77one payment, lifetime licence
The licence is issued to your NinjaTrader account through NinjaTrader's Vendor Licensing, by hand, normally within a few hours and always within 24 hours of your form arriving. You get an email with the download link when it is done.
Because a licence cannot be handed back once it is on your account, a sale is final once the licence has been issued. If you paid and the licence has not been issued yet, email me and I will refund you in full. The user guide is public, so you can read exactly what the indicator does before you pay.
The full terms of sale and the privacy notice for buyers are one page each, in plain language.
Trading carries risk of loss. This is an analysis tool, not financial advice, and no indicator can promise a profit.
A mark on a closed bar does not change. An active level extends with the newest bar until it breaks, expires or is removed, and a stopped level is removed unless a history option keeps it. The profile, its labels and the table describe the newest bars and move with them, by design. With Calculate set to each tick the forming bar is only previewed: it creates no level, fires no signal and raises no alert, and all three Calculate modes give the same results bar for bar. One thing to know: levels are built from the bars before them and the refresh count starts at the first bar loaded, so two charts that loaded different amounts of history can differ in their levels and signals for a while, and a chart reloaded after a long session can differ from what it showed live.
The first profile needs at least ten closed bars and is built only inside the newest Calculation History bars, 2,000 by default, and the levels on screen were built from the bars before them. The indicator does not extend the chart's data, so raise Days to load in the Data Series dialog. Aim for at least 2,500 bars where your feed allows it.
No. The indicator works from bars, not tick data. A bar's volume is spread evenly over the rows its range covered and counted as up or down from its close against its open, so this is estimated volume at price and an estimated up and down split. On a futures chart the volume itself is real contract volume. Use Lower Timeframe, off by default, makes the estimate finer on second and minute charts by reading smaller candles.
The price axis follows the bars, not the drawings, so part of a profile or a level far from price can lie outside the panel; drag the price axis to see it. The table is painted on top and can cover rows and labels near its corner, as it does on some of the charts on this page, and Position in 09 Metrics Table moves it. Label Max limits the labels, nearest first, and a label too close in price to a nearer one is skipped.
The busiest row of the profile has a border in the chart's text colour, white on these charts, but the POC level itself is off by default. Point of Control adds it, drawn in the chart's text colour. POC Variant set to Developing draws its path as a step line instead, and creates no fixed level and no signal.
NinjaTrader 8.1 Desktop for Windows; the build is tested on 8.1.9.0. Any data connection that delivers bars works, including the free simulation connection.
No. NinjaTrader 8 is free to download and use for charting and simulation, with free real-time futures data for the simulator. A live account with a broker of your choice is a separate step that this indicator does not need. NinjaTrader is the platform it runs inside, not a broker.
No. The licence is tied to your NinjaTrader account login through NinjaTrader's Vendor Licensing, not to a PC. Log in on any installation and the indicator runs; a new PC needs no transfer.
I issue it by hand in the NinjaTrader Vendor Dashboard. It is normally done within a few hours and always within 24 hours of your form arriving, including weekends.
No. It is one payment of 77 USD for a lifetime licence on one NinjaTrader account, with future updates included.
Once the licence has been issued the sale is final, because a licence on your account cannot be handed back. That is why the user guide is public: read it first. If you paid and the licence has not been issued yet, email me and I will refund you in full.
Yes. Email me from the address you bought with and I will move the licence to your new account login.
No indicator can promise that, and this one does not. It gives you a map of where volume traded on the bars in its window, and a record of how closes behaved at those levels. What you do with that, and how you size positions, decides the outcome.
Each one is a compiled NinjaScript Add-On, 77 USD once, with its own page, charts and public user guide.
Change-of-character and break-of-structure signals on closed bars, filtered and graded by seven checks, with a trade plan, an adaptive ribbon, OTE zones and a six-timeframe dashboard.
$77 one payment, lifetime licence
An anchored VWAP at each confirmed swing, pullback reclaims on closed bars, seven filter profiles, a stop, three targets and a dashboard of what those plans did on your chart.
$77 one payment, lifetime licence
Two moving averages over an alternate timeframe, whose cross prints Buy or Sell on closed bars, a stop and three targets as percentages of the entry, supply and demand zones, and a dashboard.
$77 one payment, lifetime licence
77 USD once. A lifetime licence on your NinjaTrader account, updates included, and the licence issued within 24 hours.


