Trend Cross
The fast EMA crosses the slow EMA, RSI is on the right side of 50, momentum agrees, and the EMA distance measured in ATR clears a strength threshold.
 Invite-only TradingView indicator
Most momentum tools watch one thing, usually a crossover, and miss everything else. Momentum Tidebreaker runs three independent detectors: a trend cross, an RSI reclaim and an RSI divergence. Each one looks at a different side of momentum, every signal waits for the bar to close, and each comes with an ATR stop and two targets drawn on the chart.
$47one payment, lifetime access
Get lifetime access
The published walkthrough: the indicator on real charts, what its inputs do, and which signals to take and which to skip.
An EMA crossover catches the start of a trend and nothing else. It says nothing when the trend pauses and resumes, and it is late, or silent, when a move exhausts itself and turns.
Those are three different market structures, and they need three different tests. Momentum Tidebreaker runs all three on every closed bar: a trend cross for directional commitment, an RSI reclaim for continuation, and a divergence for reversal at exhaustion.
A signal fires when any one class matches. When the trend cross and the divergence agree on the same closed bar, the signal is upgraded to a Strong Signal and marked with a star.
The script page on TradingView is public. Read the full description there before you pay.
Each class can be switched off, so the chart shows only the setups you trade.
The fast EMA crosses the slow EMA, RSI is on the right side of 50, momentum agrees, and the EMA distance measured in ATR clears a strength threshold.
Inside an existing EMA trend, RSI dips across 50 and recovers while price holds the trend side of the slow EMA. A continuation entry after the first cross.
RSI is overbought or oversold, momentum improves against the move, and the close crosses back over the fast EMA. It catches turns that a crossover misses.
When the trend cross and the divergence fire on the same closed bar, a star is added to the triangle. It marks agreement between two classes, not a probability.
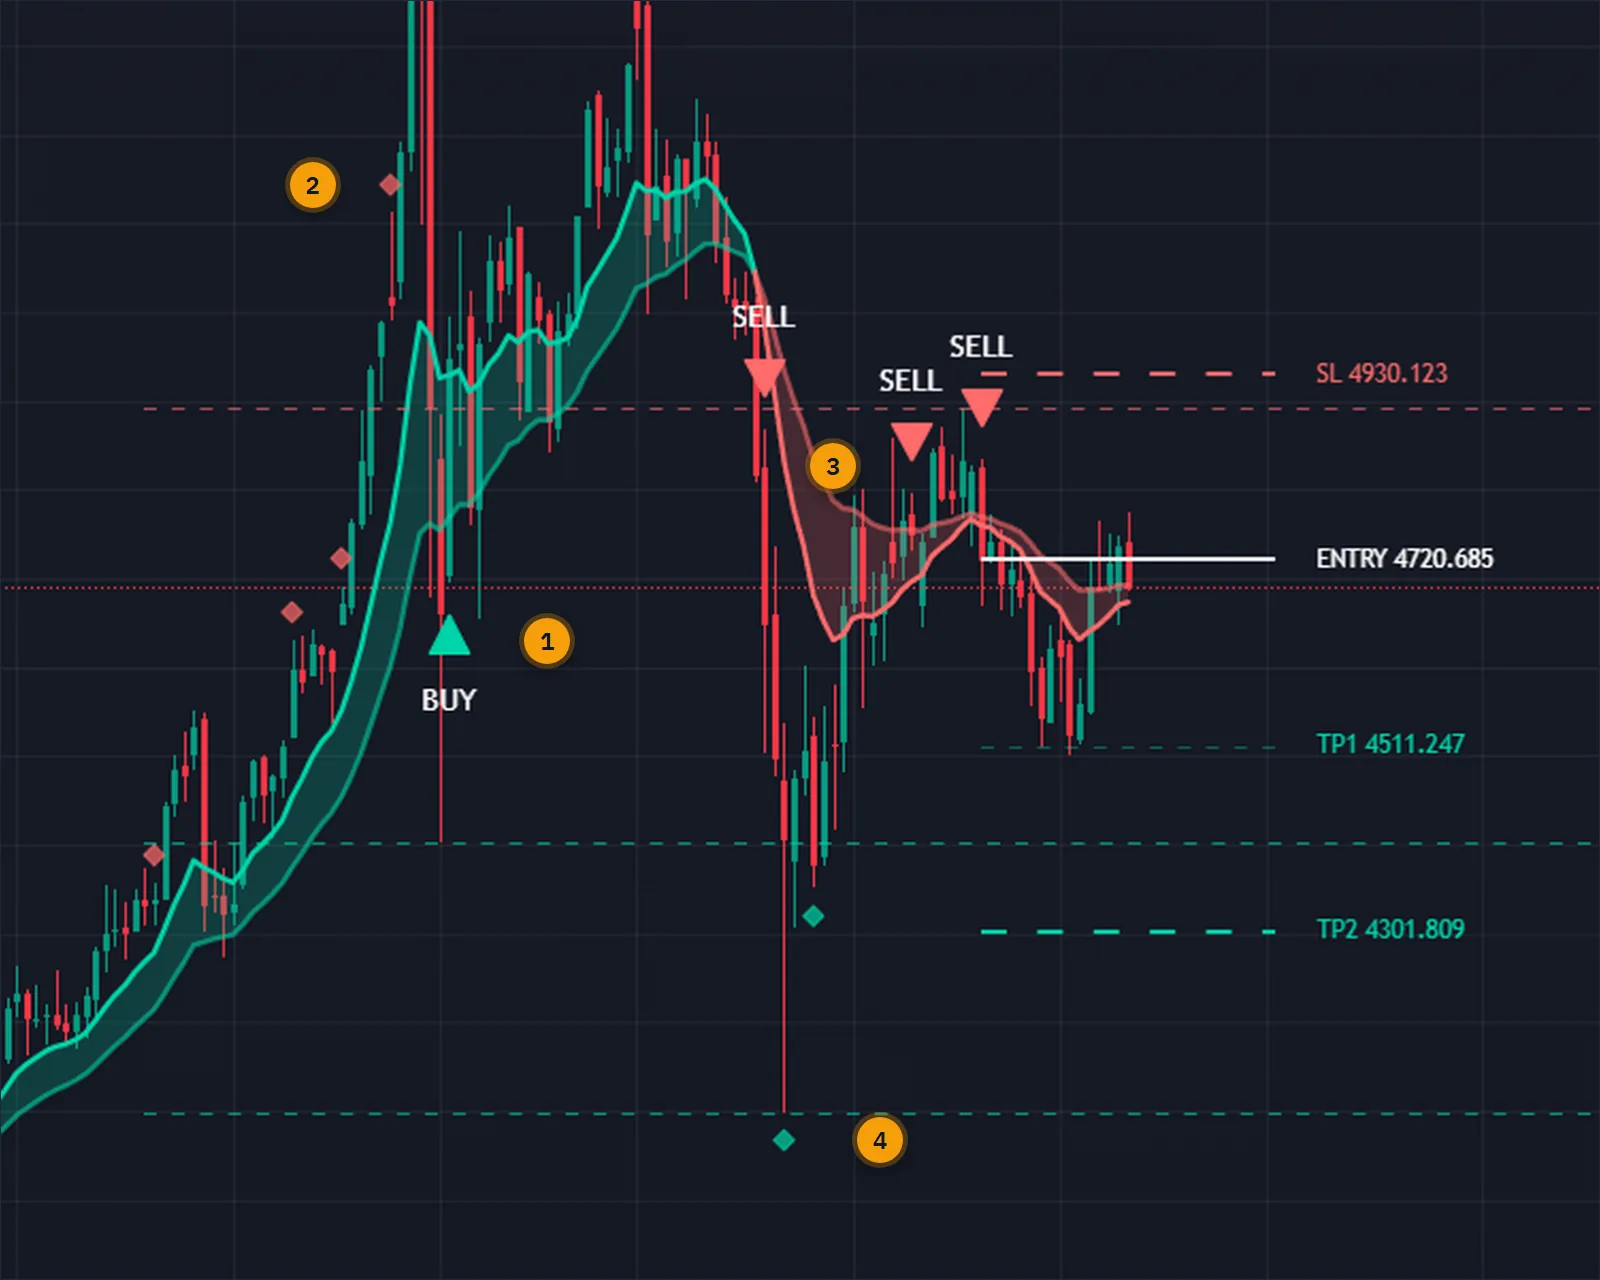
Stop at 1.5 ATR by default. TP1 sits at 1R and is a partial-profit marker, TP2 at 2R closes the trade. Both multipliers are inputs.
One to five levels built from pivots, drawn on the chart, with the distance to the nearest of each shown on the dashboard in points.
Every class is gated by the confirmed bar at the function level. Once a triangle, a diamond or a level is drawn, it does not move or disappear.
Trend, strength, RSI state, momentum, ATR and ATR as a percentage of price, the structure distances, and the open trade with its floating result.
Buy, sell, strong buy, strong sell, TP1, TP2, stop, and bullish and bearish divergence. All fire on bar close and carry the entry, stop and target prices.
Every picture below is a TradingView capture with numbered notes added. Nothing on the charts is drawn by hand. Click any image to enlarge it.
The trend cross is about commitment: the structural shift of the fast EMA through the slow one, with RSI and momentum taking part. The reclaim is about continuation: RSI dipping back through 50 inside a trend and recovering. The divergence is about exhaustion: a stretched RSI, fading momentum and a close back across the fast EMA.
Because the three tests look at different structures, they add useful signals instead of repeating each other. A duplicate filter stops the same direction firing twice on one bar.

The top of the panel is a market snapshot: the trend and its strength as EMA distance over ATR, RSI with its overbought, oversold or mid state, the momentum value, and ATR both as a price and as a percentage of price, which is a quick gauge of the volatility regime.
Below it are the distances to the nearest resistance and support, and the active trade: direction, entry, the stop with its distance in points, both targets with a flag once TP1 is reached, and the floating result. The last row is the tool's own running count of closed outcomes on this chart, which is a record and not a forecast.
Stops, targets and the strength filter are all measured in ATR, so the same settings make sense on a currency pair, on gold, on oil and on a single stock without retuning.
The one-hour, four-hour and daily charts give the cleanest signal density for swing entries. It works on every timeframe; shorter ones fire more signals with tighter ATR stops.


Four steps, run once on every closed bar.
A fast and a slow EMA, RSI 14, a five-bar momentum score normalised by ATR 10, and ATR 14 for risk.
Run the three classes: trend cross, RSI reclaim and divergence. Any one match is a signal; cross plus divergence is a Strong Signal.
Only on a closed bar, and only once per direction per bar. Nothing is evaluated on the forming candle.
Draw the entry, the ATR stop, TP1 at 1R and TP2 at the chosen reward ratio, then track the trade until a target or the stop is reached.
| EMA crossover | Momentum Tidebreaker | |
|---|---|---|
| Setups found | Trend starts only | Trend start, continuation, reversal |
| Filters | None | RSI side, momentum, strength in ATR |
| Confirmation | Often on the live bar | Closed bar only, no repaint |
| Stop and targets | You work them out | ATR stop, TP1 and TP2, tracked |
| Structure | Not shown | Pivot levels and distances |
| Alerts | Cross only | 9 conditions with prices in the message |
No subscription and no renewal. Pay once and the indicator stays on your TradingView account, updates included.
Momentum TidebreakerTradingView indicator
$47one payment, lifetime access
Access is granted by hand from my TradingView account, normally within a few hours and always within 24 hours of your form arriving.
Because access to an invite-only script cannot be handed back, a sale is final once access has been granted. The script page on TradingView is public, so you can read the full description and see it on charts before you pay.
The full terms of sale and the privacy notice for buyers are one page each, in plain language.
Trading carries risk of loss. This is an analysis tool, not financial advice, and no indicator can promise a profit.
No. All three signal classes are evaluated only on closed bars, and that is enforced inside the signal functions, not by a visual override. Once a triangle, a divergence diamond or a stop and target line is drawn, it does not move or disappear on later ticks.
It is a signal where the trend cross and the divergence class fired on the same closed bar, marked with a star next to the triangle. It shows that two independent tests agreed. It is not a probability of profit.
Any instrument: forex, crypto, stocks, commodities and indices. The stop, the targets and the strength filter are measured in ATR, so they adapt to each instrument's volatility and price scale. One-hour, four-hour and daily charts give the cleanest signal density.
No. Invite-only indicators work on the free plan. The free plan limits how many indicators you can have on one chart and how many alerts you can run, so a paid plan helps if you use many, but it is not required for this one.
I grant access by hand from my TradingView account. It is normally done within a few hours and always within 24 hours of your form arriving, including weekends.
No. It is one payment of 47 USD for lifetime access on one TradingView username, with future updates included.
Once access has been granted the sale is final, because access to an invite-only script cannot be returned. That is why the script page on TradingView is public: read it and look at the charts first. If you paid and access has not been granted yet, email me and I will refund you in full.
Yes. Email me from the address you bought with and I will move the access to your new username.
Yes. A MetaTrader 4 and 5 edition is on the MQL5 Market. It is a separate product sold by that store; this page is the TradingView edition.
No indicator can promise that, and this one does not. It gives you a clear, rule-based reading of the chart and a plan to work from. What you do with that, and how you size positions, decides the outcome.
Each one is invite-only, 47 USD once, and has its own page with charts and a full description.
An adaptive trend-following indicator combining a dynamic SuperTrend engine with a Trend Quality Index and three optional confluence filters.
$47 one payment, lifetime access
A non-repainting SuperTrend that pairs the classic trend engine with structural price levels.
$47 one payment, lifetime access
Ten confluence layers scored on every closed bar, with an anti-chop gate and a live dashboard.
$47 one payment, lifetime access
47 USD once. Lifetime access on your TradingView username, updates included, and access granted within 24 hours.


