A score on every turn
EMA and momentum, the timeframes, a cross-check at sensitivity 12 and 16, higher-timeframe bias, volatility, RSI, volume, VWAP and candle, less a chop penalty. 16 points at the defaults, 18 at most.
 NinjaTrader 8 indicator, NinjaScript
A plain range filter marks every turn the same way. FXB Confluence Engine scores each turn on the closed bar across ten layers, from the EMAs and the 5 to 240 minute timeframes to RSI and volume, and prints BUY or SELL only when the anti-chop gate, the confirmations you have on and your Minimum Signal Strength all pass. The dashboard shows what each layer gave and which gate is holding. It draws pivot levels, and it draws no stop or targets.
$77one payment, lifetime licence
Get the lifetime licence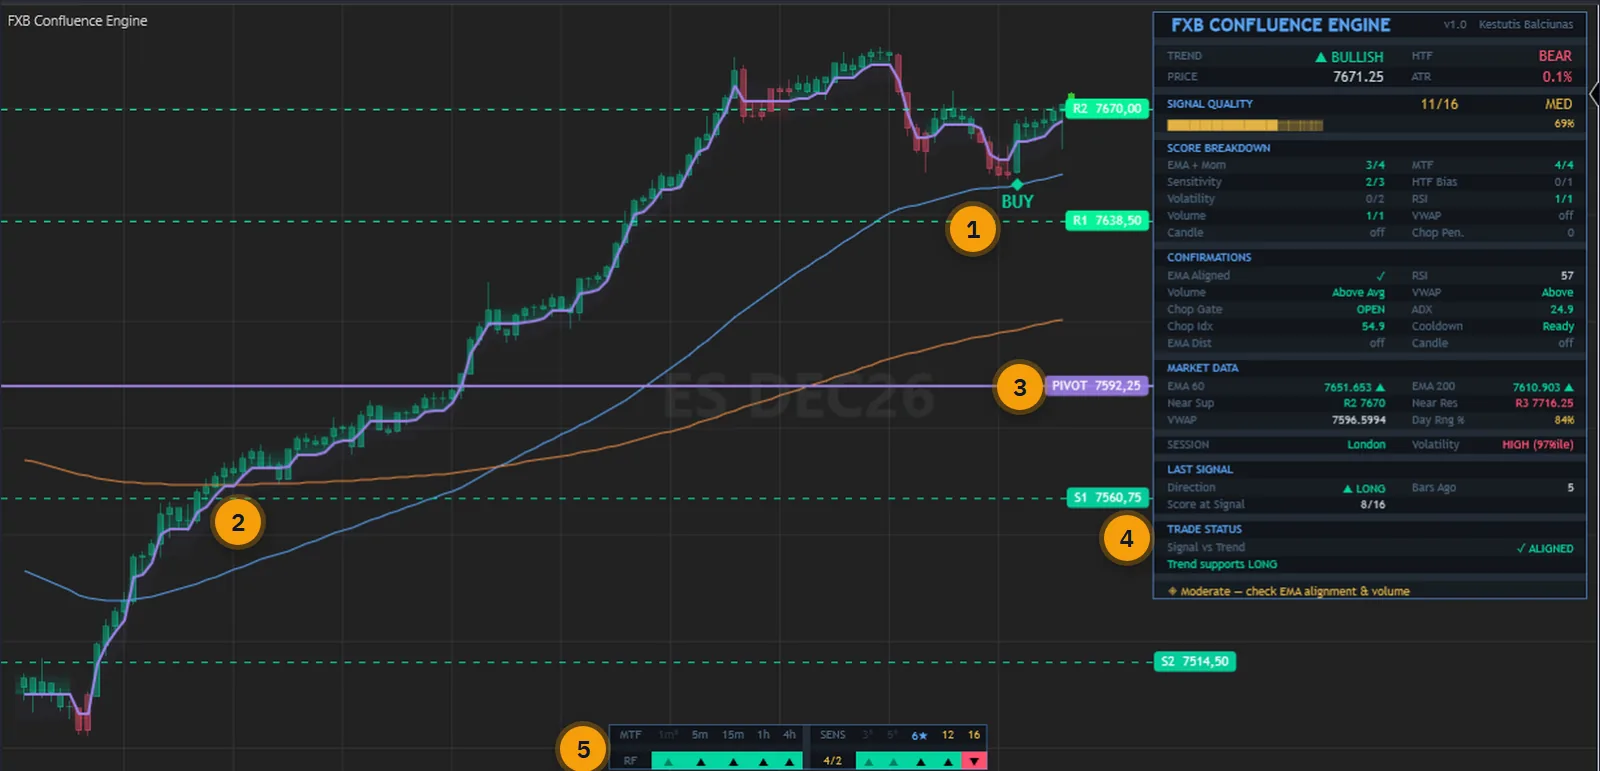
A range filter gives you a line and its turns. It says nothing about whether the higher timeframe agrees, whether the market is trending or chopping, or whether the volume was there. A turn in a flat hour looks the same as a turn in a clean trend, and you do the weighing on every bar.
Sensitivity alone does not solve it. Lower it and the line turns more often, raise it and the line turns less often, but either way every turn still looks the same.
FXB Confluence Engine does the weighing on the closed bar and prints it as a score, with each layer's points in the dashboard. A turn becomes a marker only if it also clears the anti-chop gate, the confirmations you have on and your Minimum Signal Strength. So expect stretches with no marker at all: the GC chart below holds none on its loaded bars.
The user guide is public: every parameter and the verification are in it. Read it before you pay.
One indicator in the price panel: the line, the score, the gates, the levels and the dashboard together.
EMA and momentum, the timeframes, a cross-check at sensitivity 12 and 16, higher-timeframe bias, volatility, RSI, volume, VWAP and candle, less a chop penalty. 16 points at the defaults, 18 at most.
By default a signal needs the ADX at or above 20, the Choppiness Index at or below 61.8 and a cooldown of 5 bars. Each one has its own switch and its own level.
RSI side and volume are on by default. VWAP, candle pattern and EMA distance are off until you switch them on. Only show signals when EMA aligned is a real gate, not a display option.
Turns scoring below it are suppressed. The default is 8, so a marker can print at 8/16. Score at Signal in the dashboard tells you which one you are looking at.
The trend on 1, 5, 15, 60 and 240 minutes from each one's last closed bar, and the same filter at five sensitivities. The dimmed 1-minute cell does not enter the score.
The score breakdown, the state of every gate, both EMAs, the nearest pivots, VWAP, the session, the last signal and whether it still agrees with the trend. Corner and text size are settings.
The pivot, R1 to R4 and S1 to S4 from the previous period, in three formulas. A resistance with the close above it and a support with the close below it change colour.
Signals, strong signals, EMA-confirmed signals, trend change, chop gate, HTF bias, RSI extremes, volume spike, score threshold and trade invalidated. In realtime only, on closed bars. There is no webhook.
EmaFast, EmaSlow, RangeFilter, SignalStrength, Signal and Trend can be read by a NinjaScript strategy and shown as Market Analyzer columns. A strategy has to add the same seven data series itself.
Every picture below is a NinjaTrader 8 capture with numbered notes added. Nothing on the charts is drawn by hand. Click any image to enlarge it.
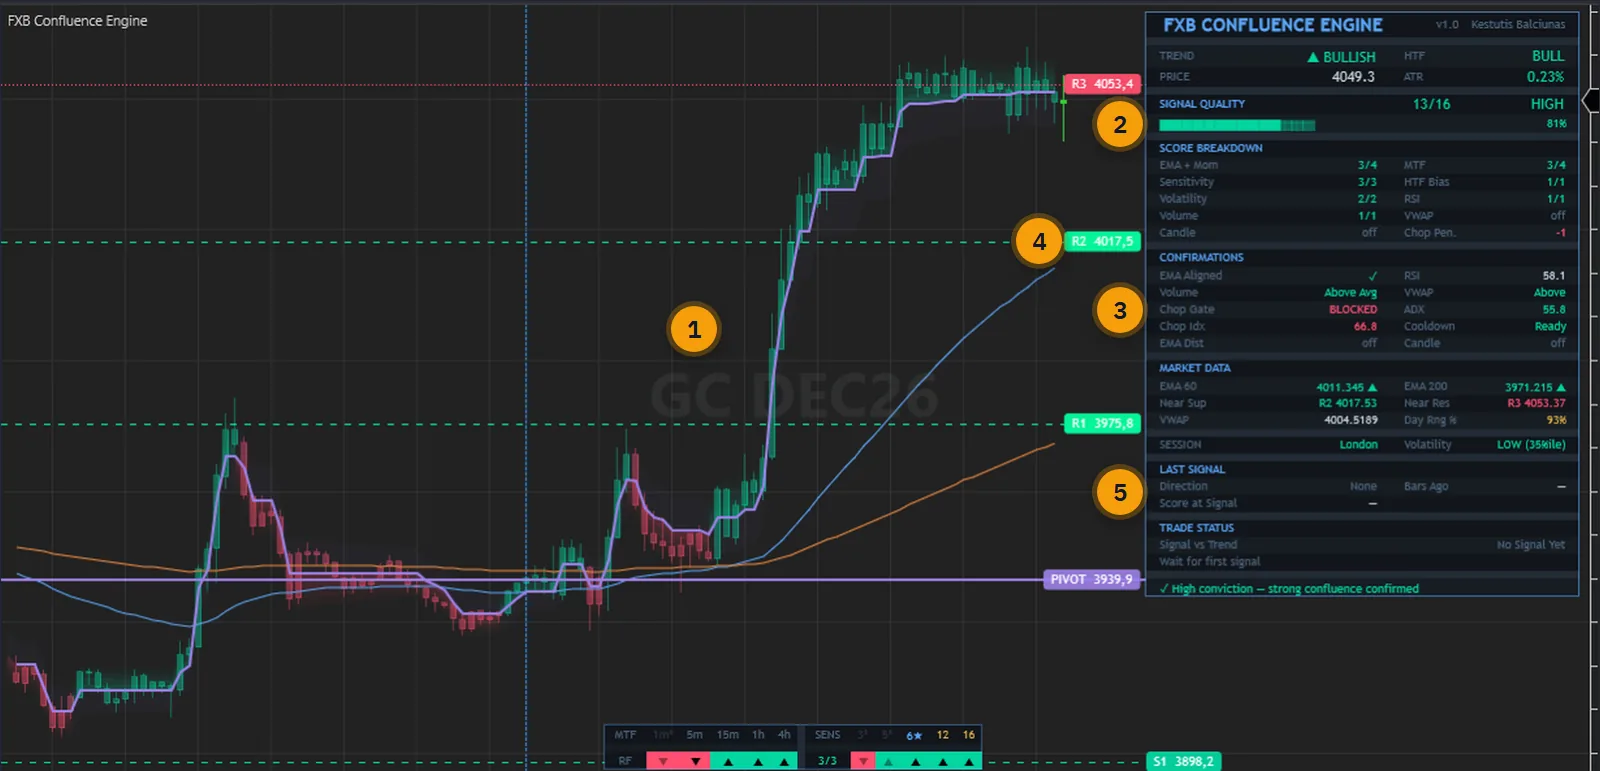
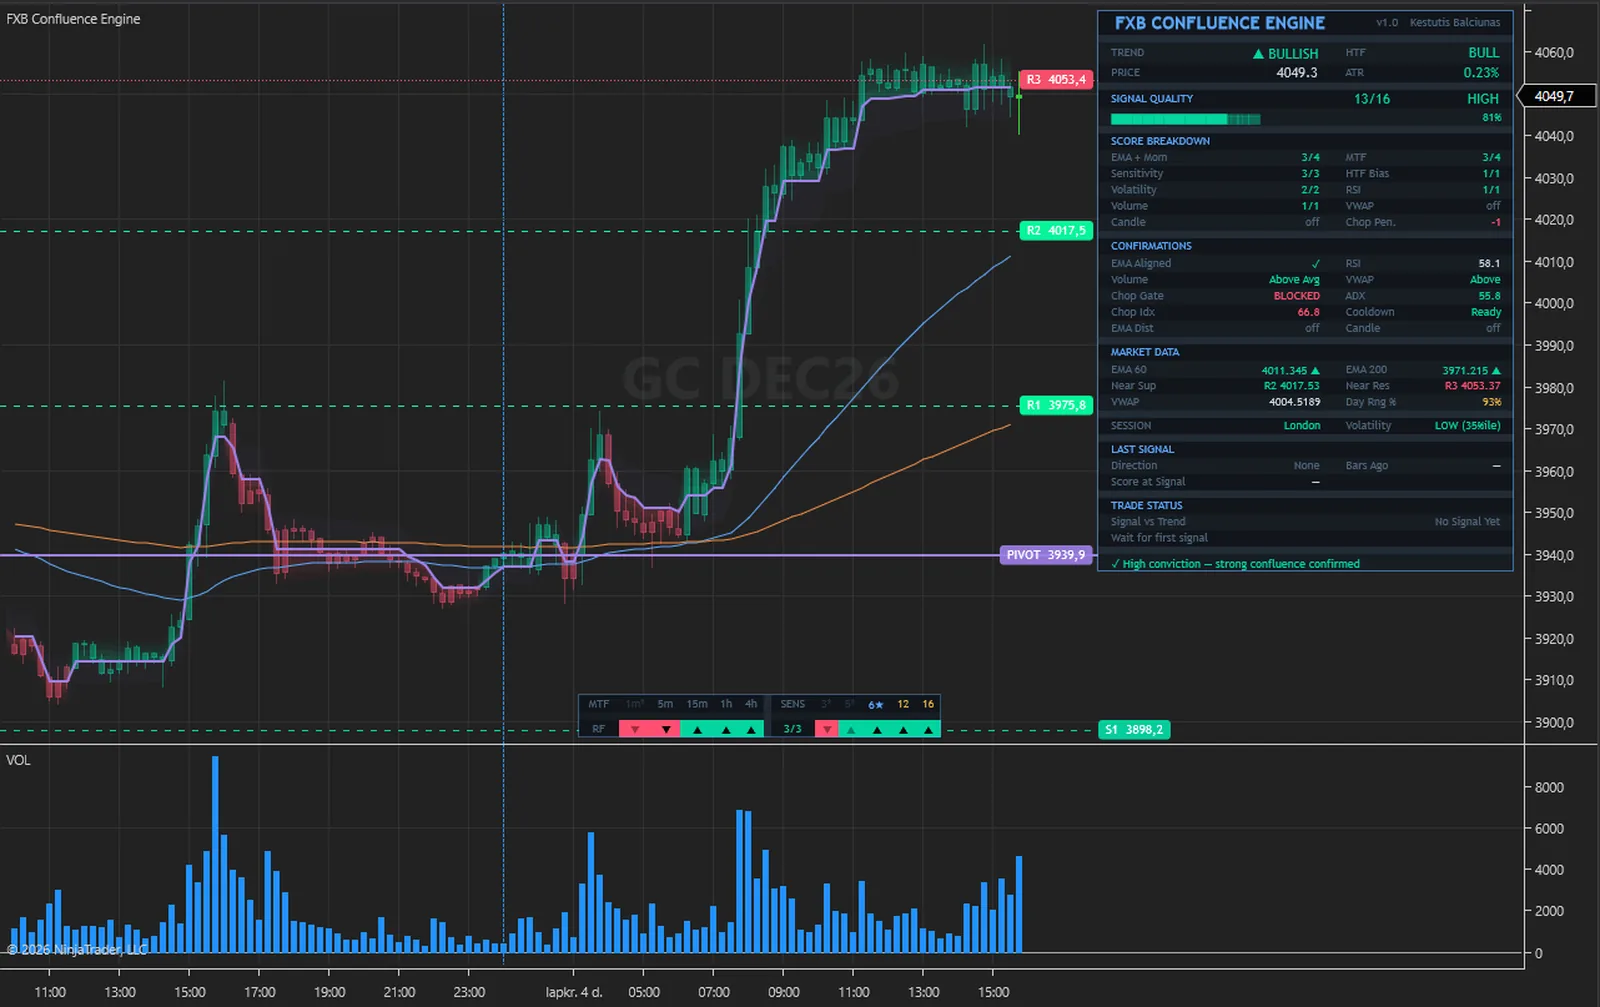
This GC chart climbed through R1 and R2 and the dashboard reads 13/16, HIGH, yet there is no BUY on it. The score describes the newest bar. A marker needs a filter turn on a closed bar that passed every gate at that moment, and on these loaded bars none did.
Chop Gate reads BLOCKED here, and Chop Idx 66.8 is over the default 61.8, so the dashboard names what is holding it. Gates remove turns you might have wanted as well as turns you would not. That is a real cost, and you should weigh it before you buy.
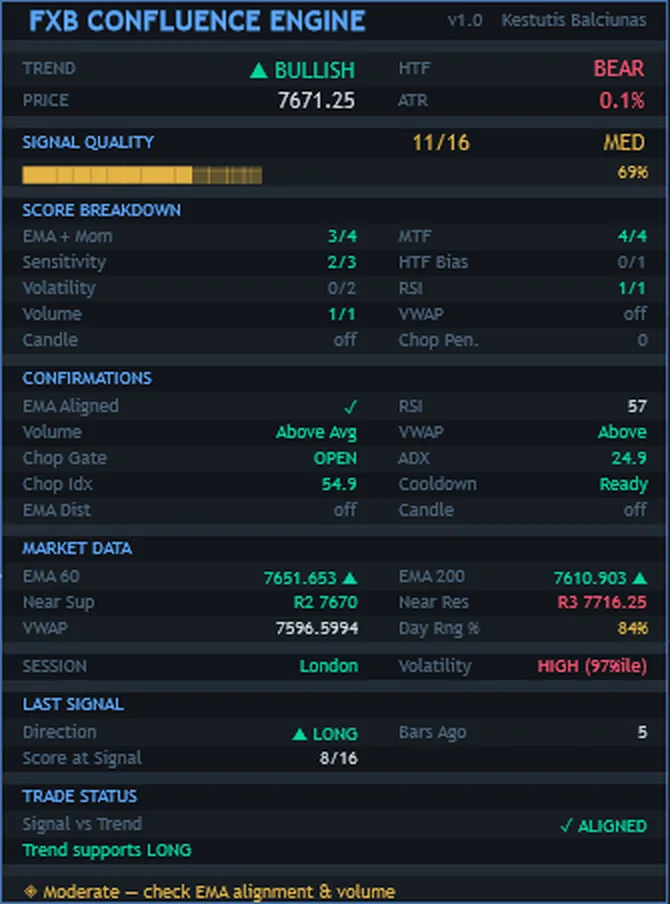
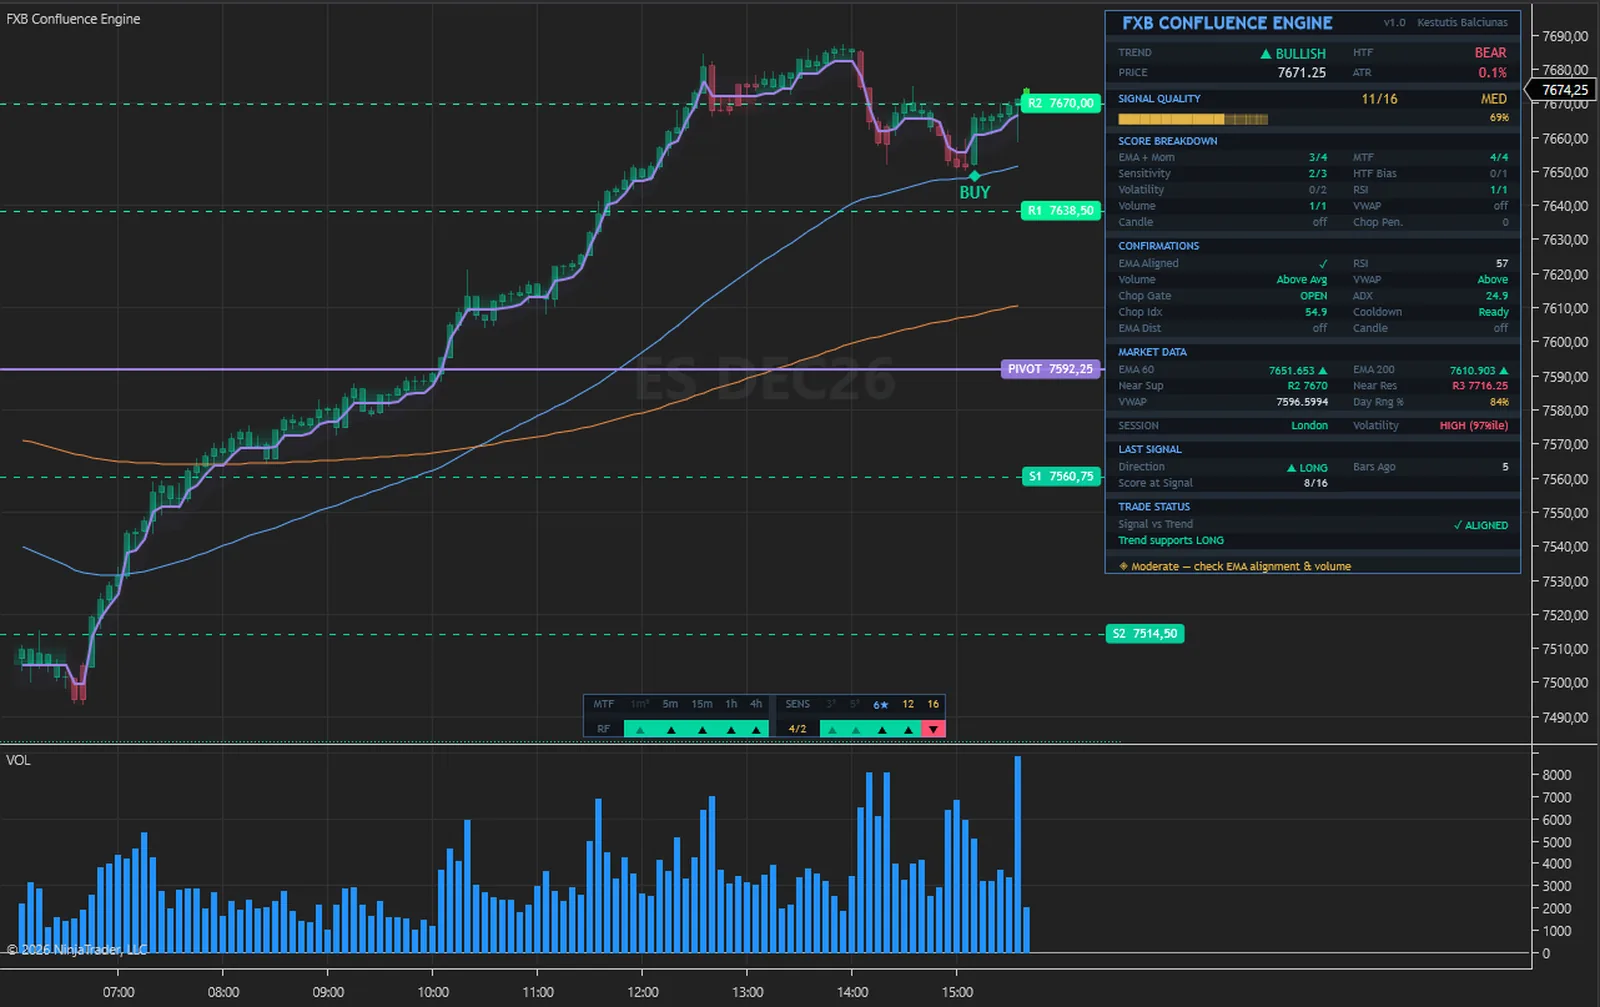
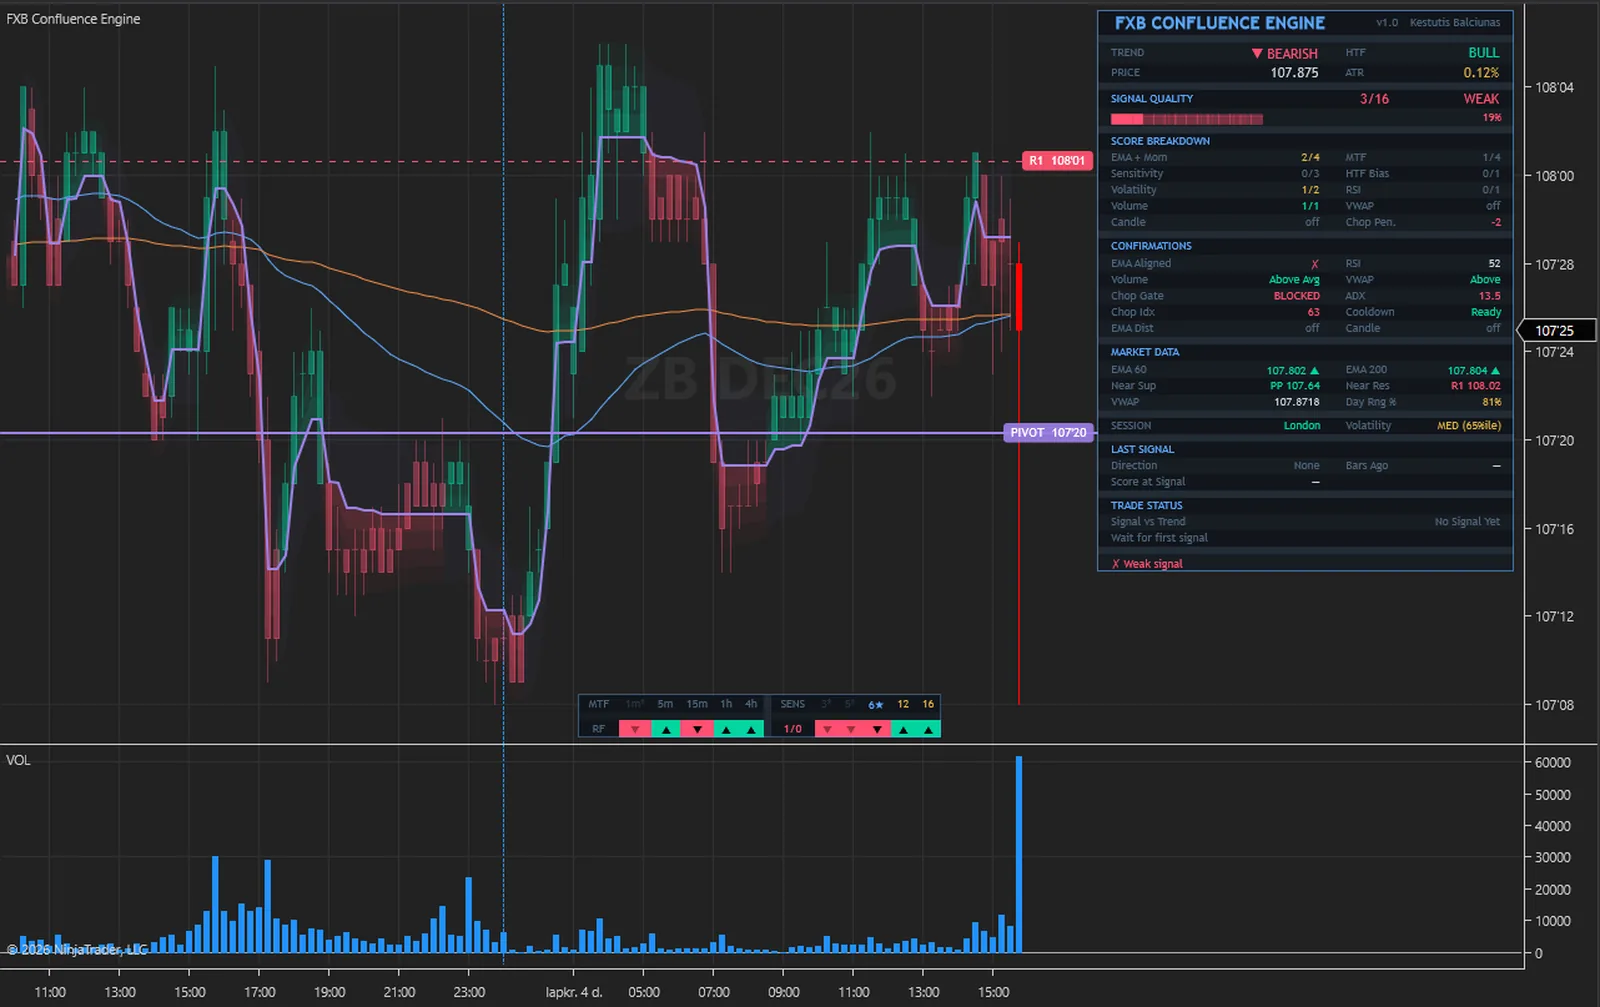
SCORE BREAKDOWN lists each layer's points and CONFIRMATIONS the state of each gate. If Chop Gate reads BLOCKED, the ADX and Chop Idx rows name the filter that holds it and Cooldown shows the bars left. On this ES chart the score is 11/16: EMA and momentum, the timeframes, sensitivity, RSI and volume gave points, volatility and the higher-timeframe bias gave none, and VWAP and candle are off.
The score, the HIGH, MED, LOW and WEAK bands and the TRADE STATUS lines describe the state of the indicator on the bars of this chart. They are descriptions, not probabilities, forecasts or instructions. TRADE STATUS says only whether the last signal still agrees with the confirmed trend, and the short phrase in the last row is chosen from the score alone.
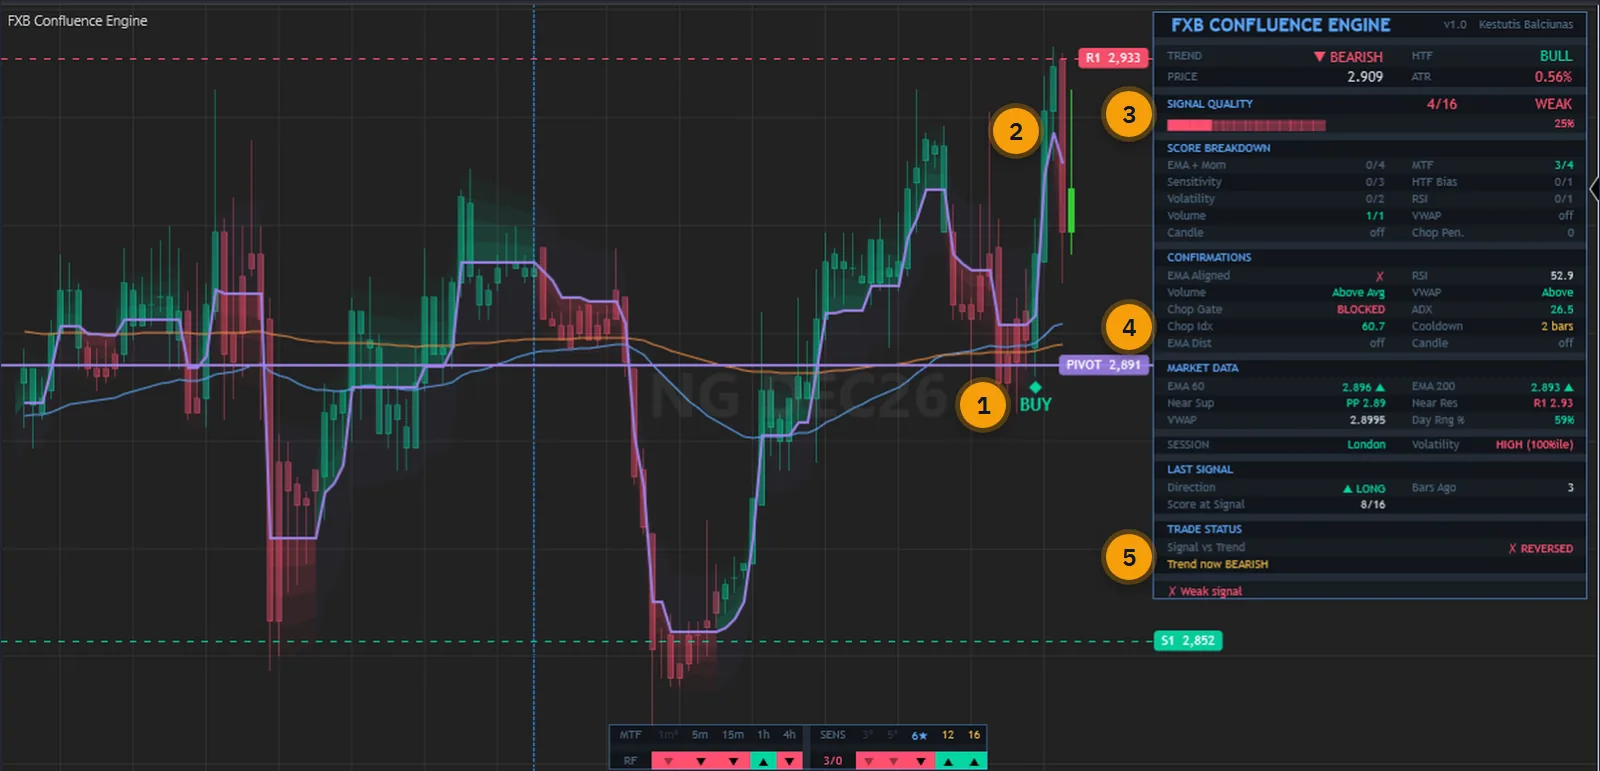
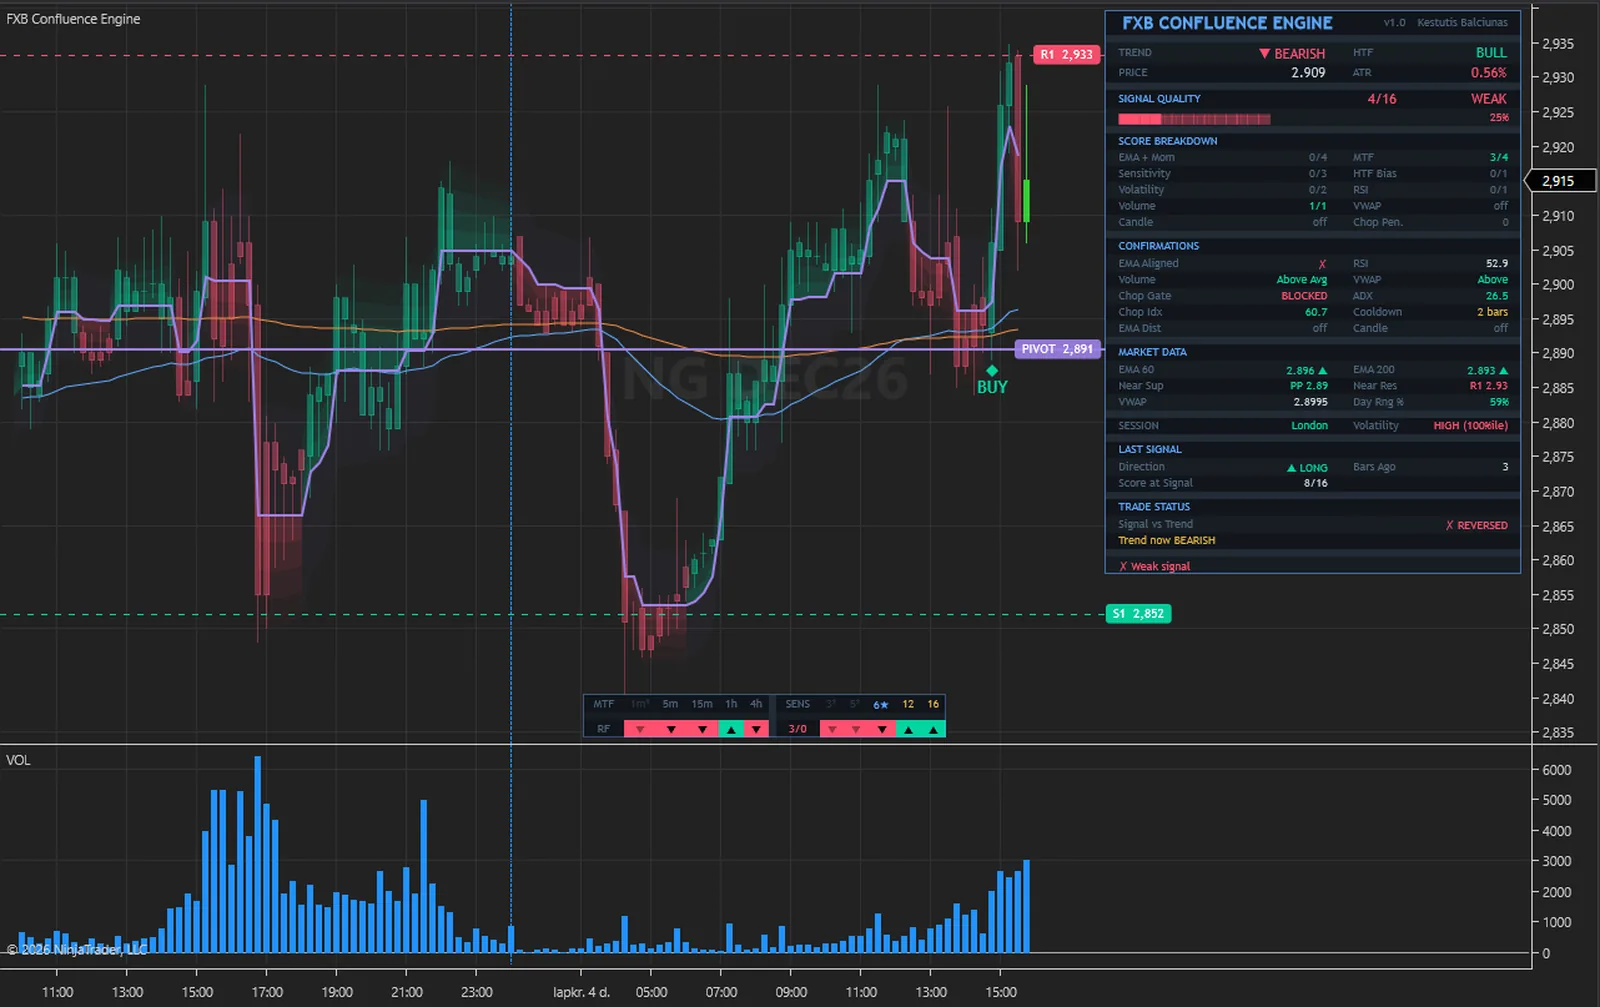
On this NG chart a BUY printed at 8/16, the default minimum. Three bars on the confirmed trend is bearish, TRADE STATUS reads REVERSED and the line under it reads Trend now BEARISH, and the score of the newest bar is 4/16, WEAK. A chart that showed only the signals that worked would tell you nothing.
This indicator draws no stop and no target, so no level on the chart marks a signal as failed. The status row is all it gives you there, and what you do about it is up to you. Alert: Trade Invalidated can tell you when the trend reverses against the last signal; like every family but Alert: Signals, it starts off.
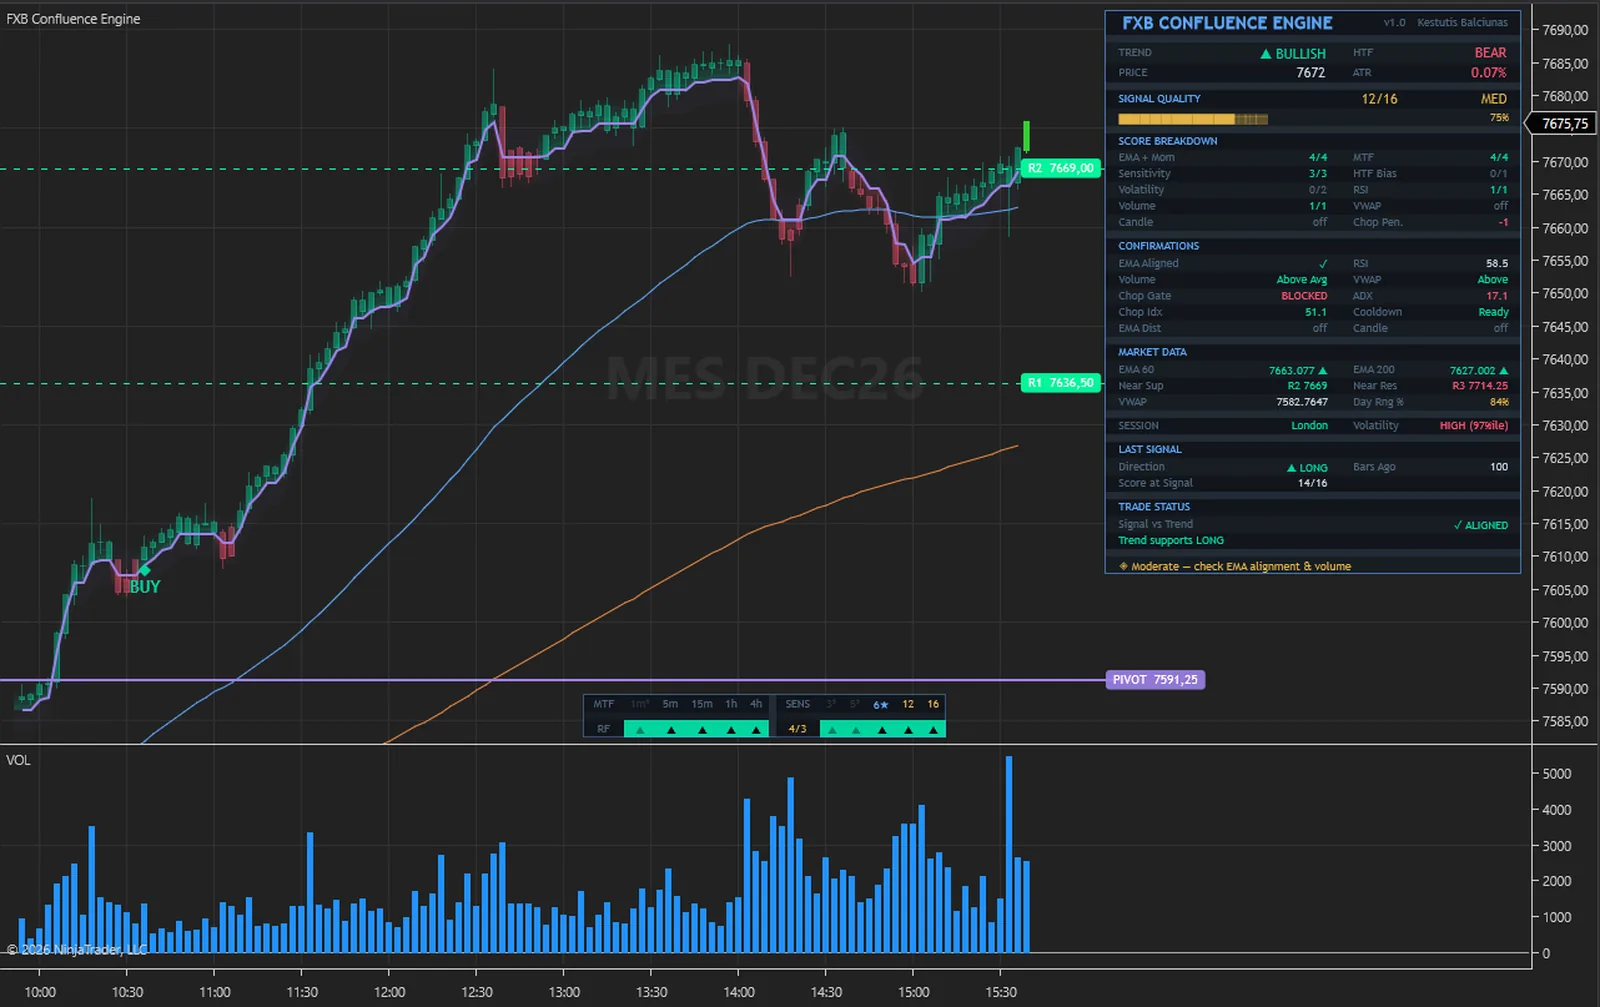
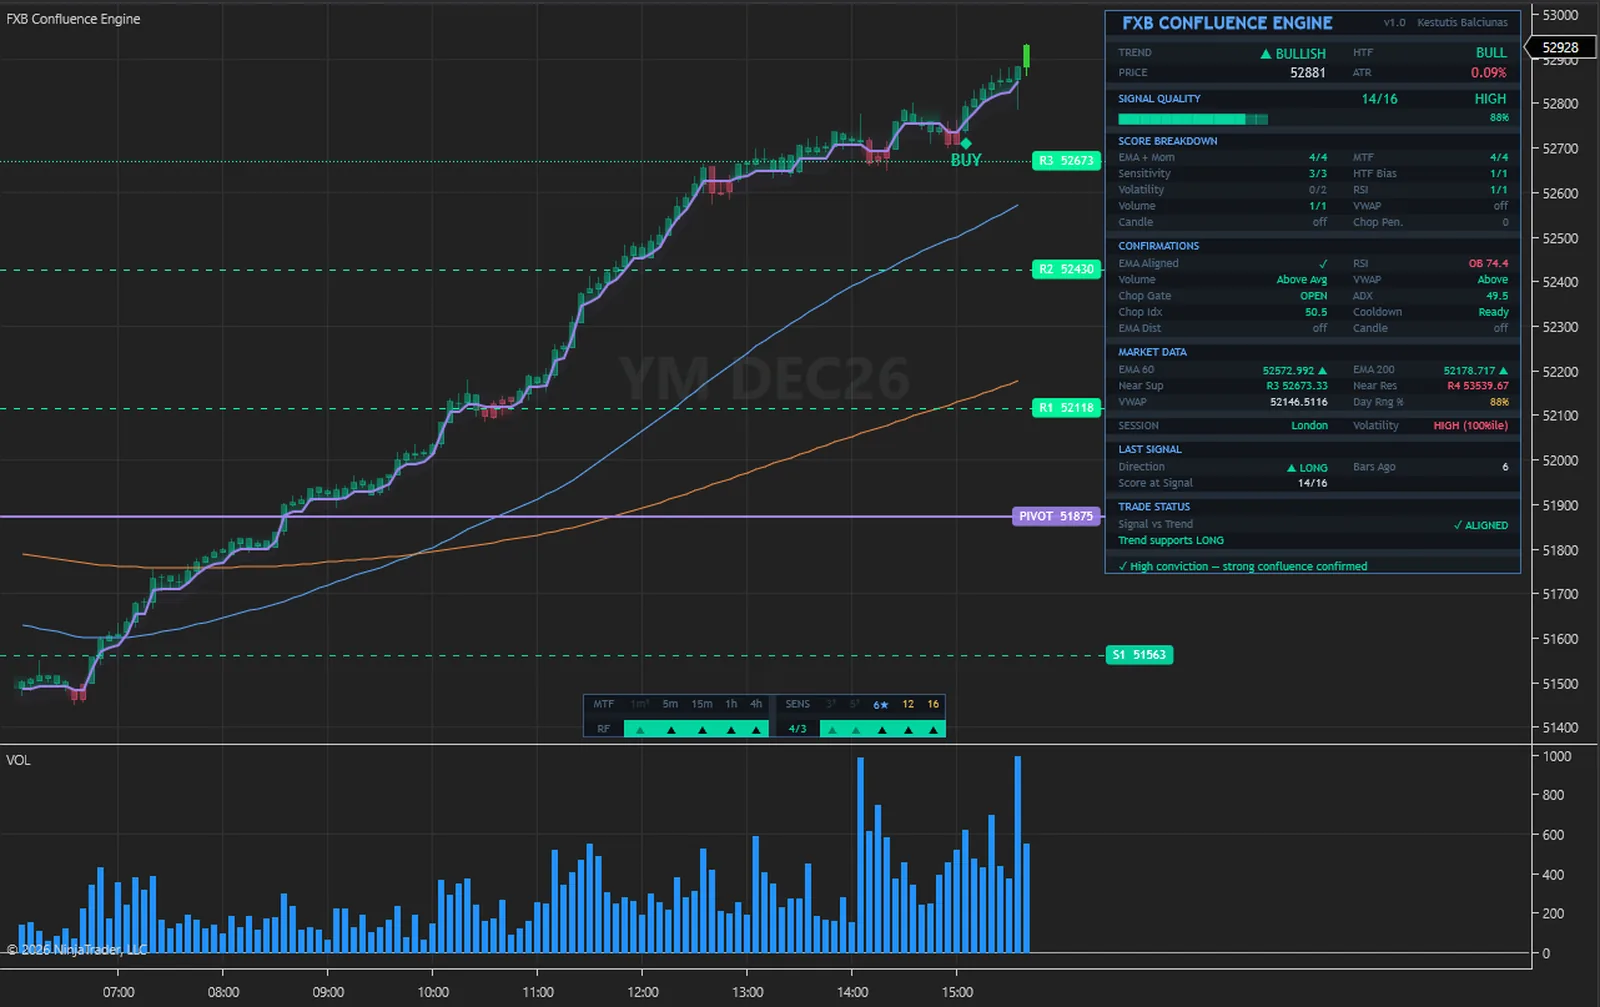
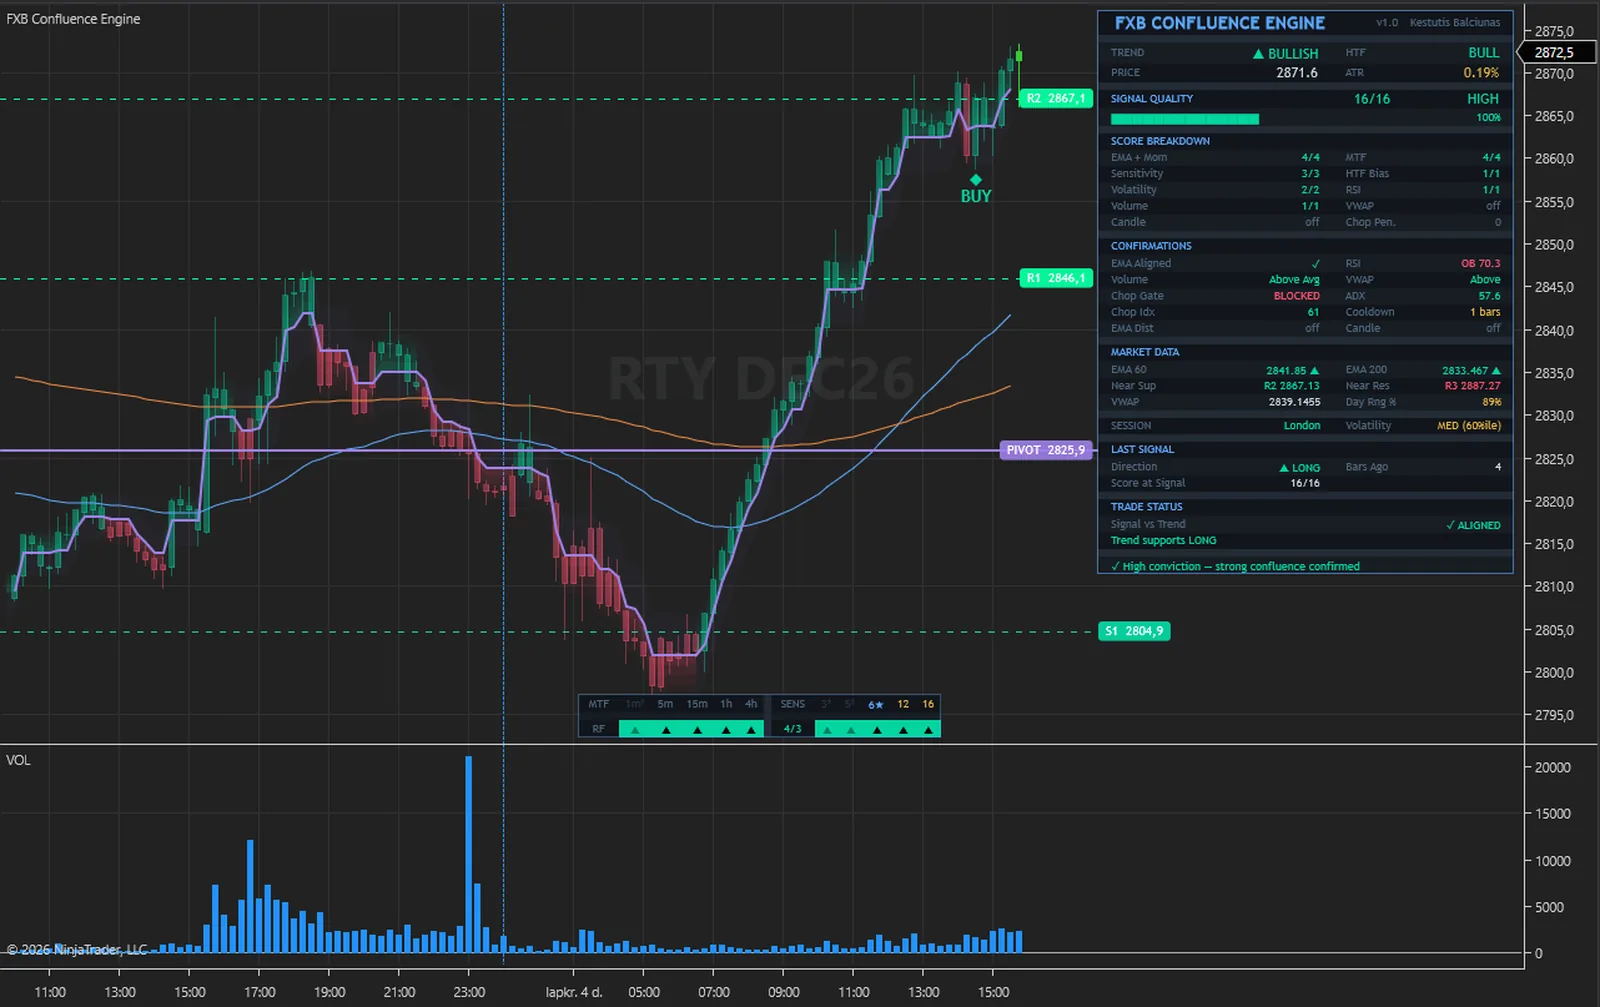
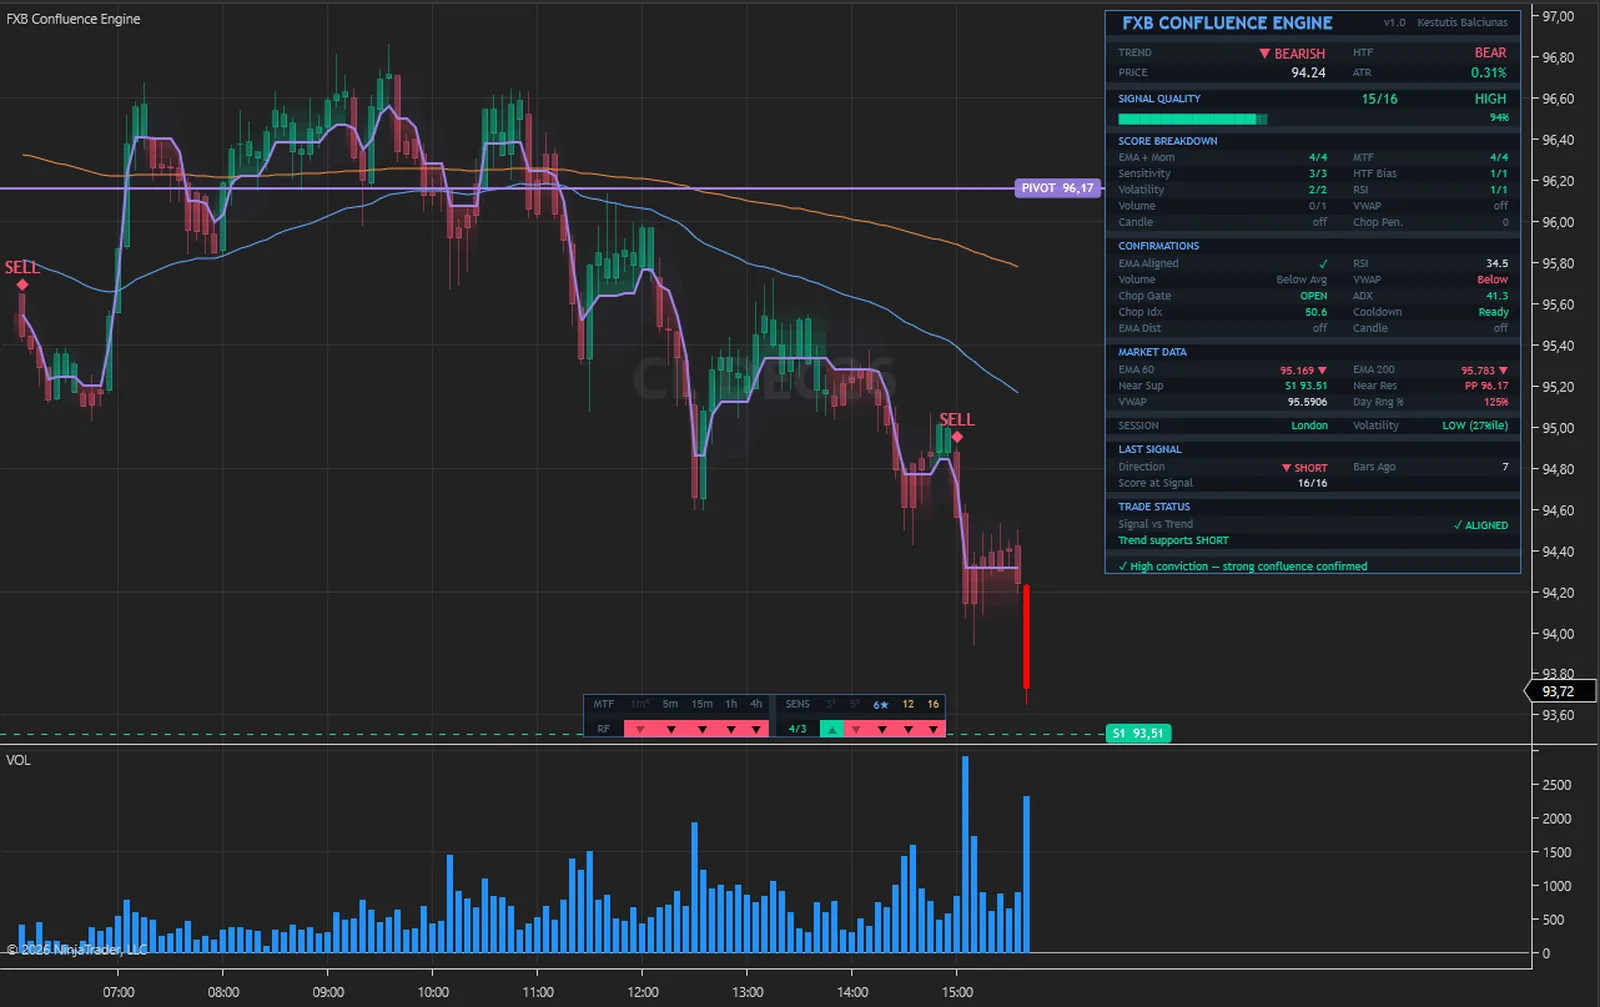
The calculations are not tied to an instrument. The captures below were taken in NinjaTrader 8 on the free simulation feed: index, energy, metal, currency and rate futures, from 1-minute to 15-minute bars, with the indicator at its default settings on every one.
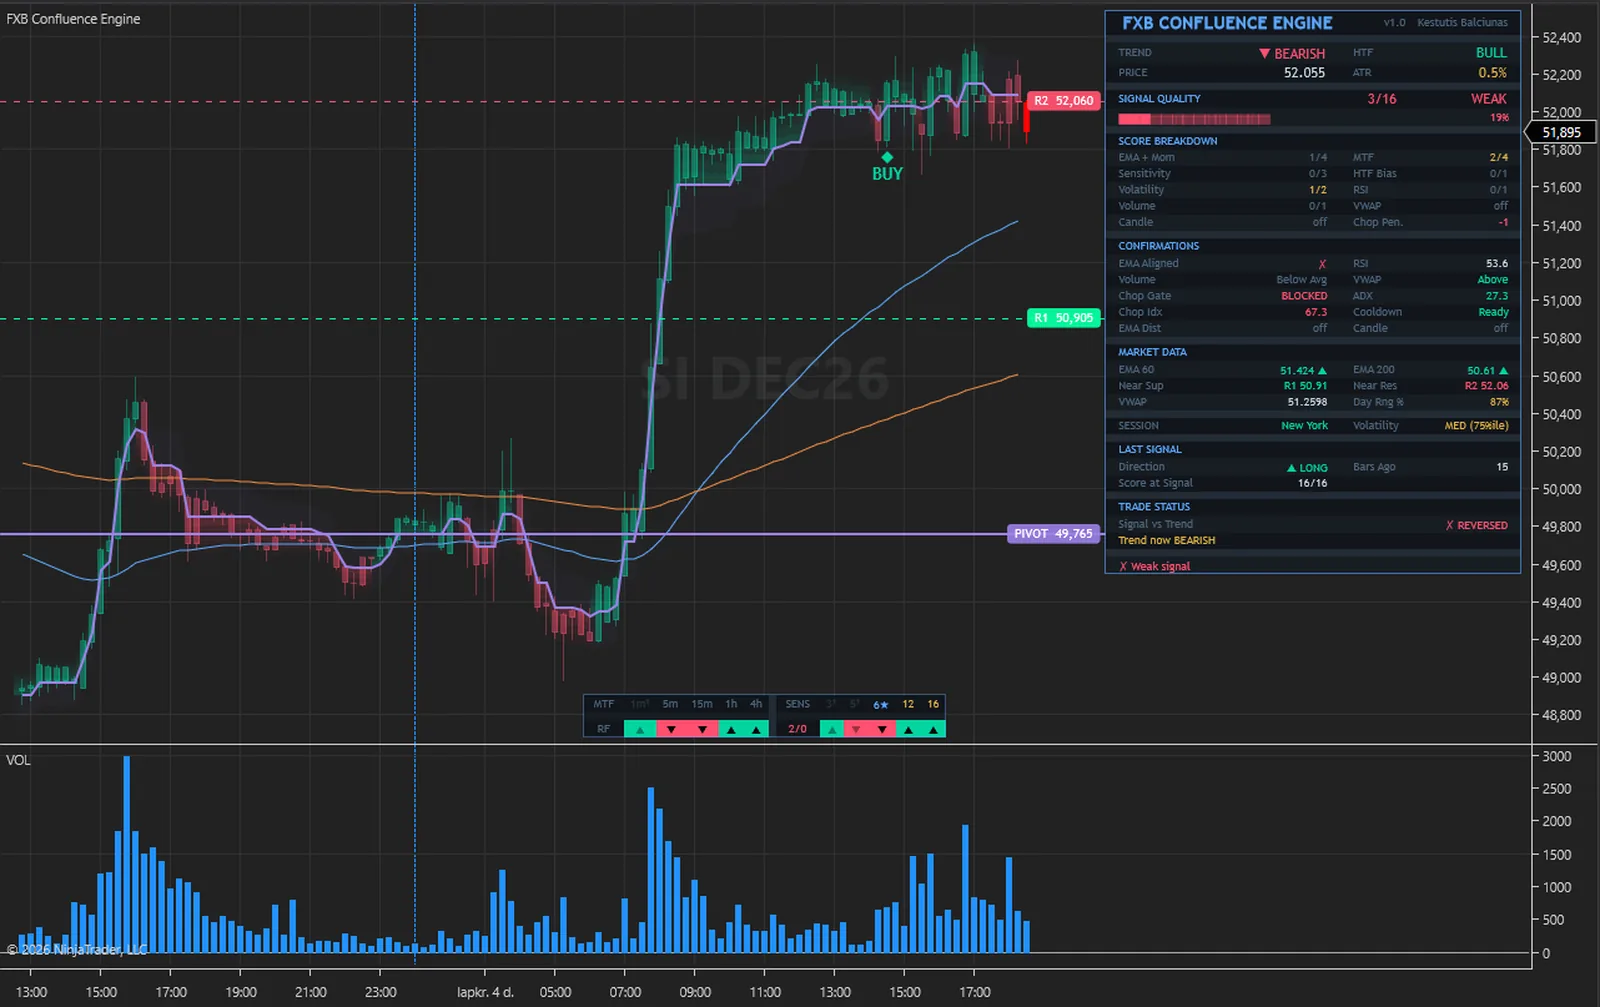
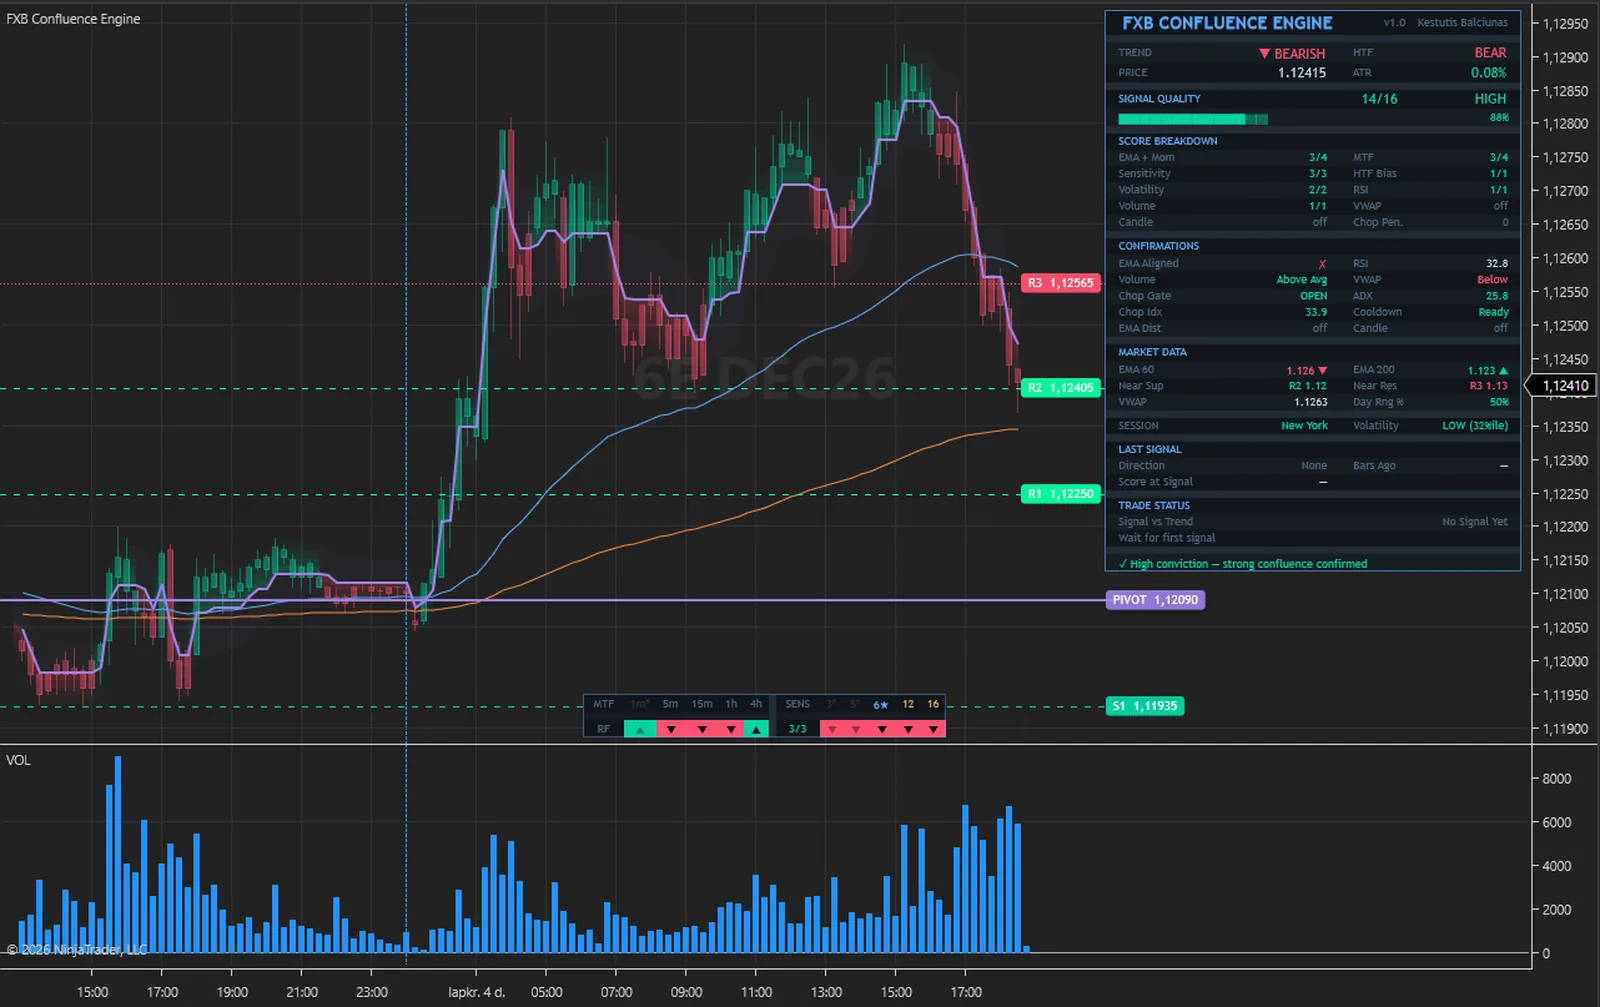
On a futures chart the Volume layer, the volume-spike alert and VWAP read real contract volume, and VWAP is an estimate from bars, not from ticks. The SESSION row reads fixed London, New York and Tokyo windows, so on a CME future it still names the FX sessions; it is information only and does not enter the score. The SI and 6E captures at 30 minutes show a chart with too little history: EMA 200 reads NaN, there is no slow EMA line and LAST SIGNAL reads None, because the slow EMA needs 200 bars before a signal can pass the EMA gate.
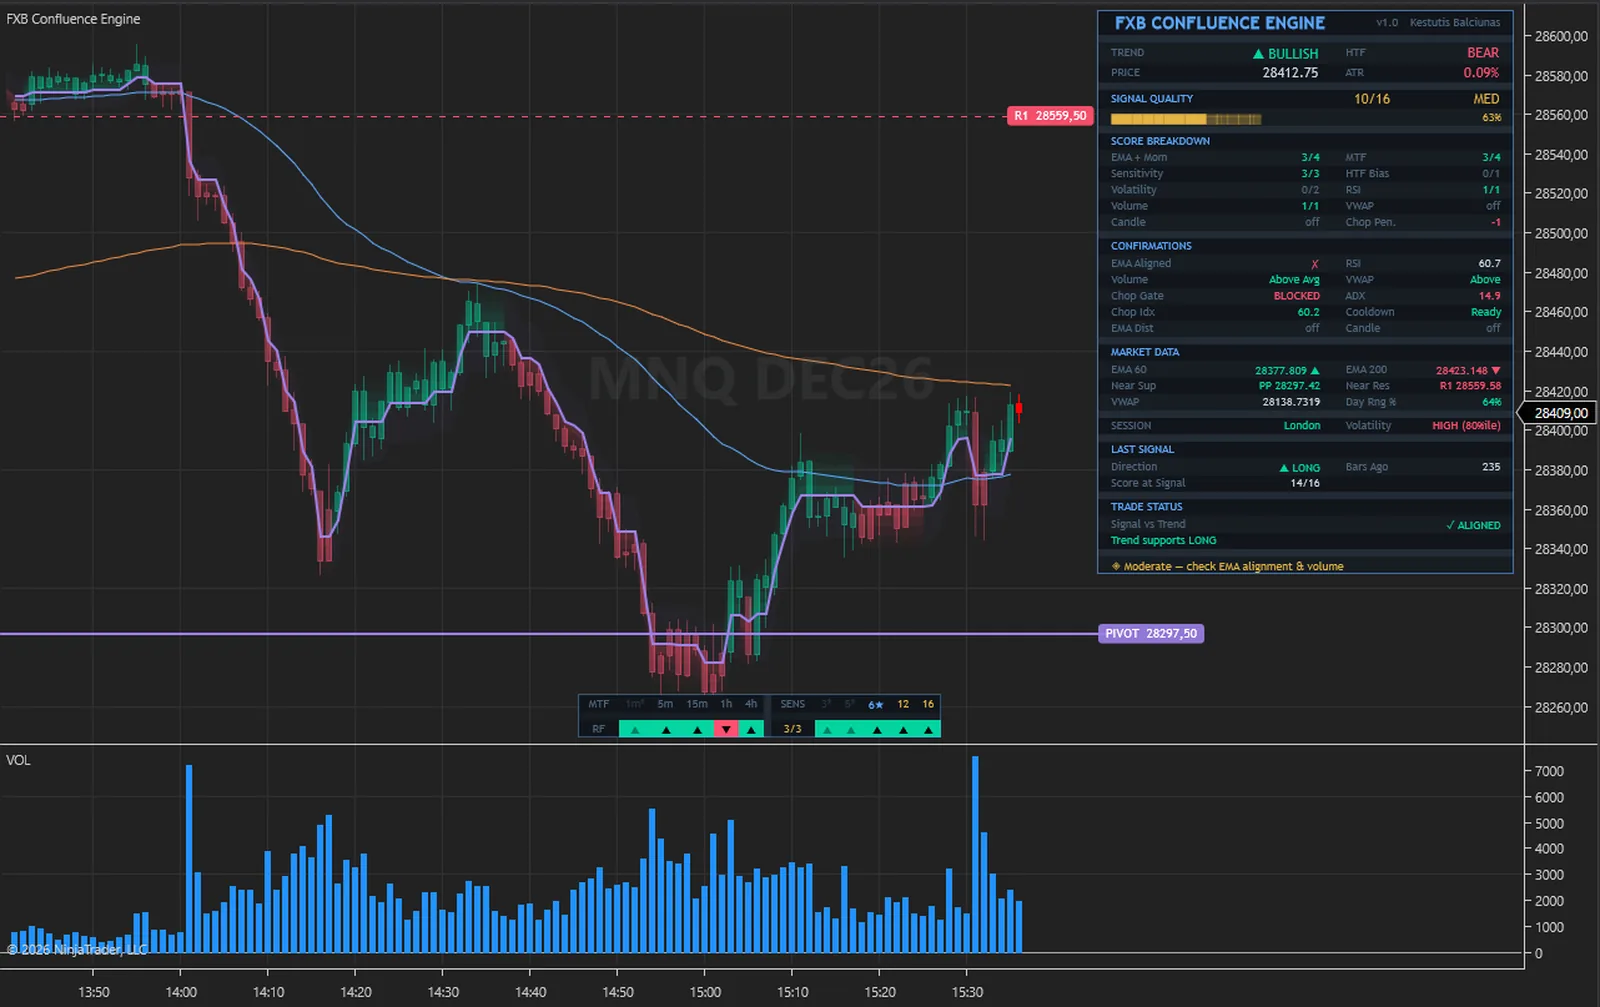
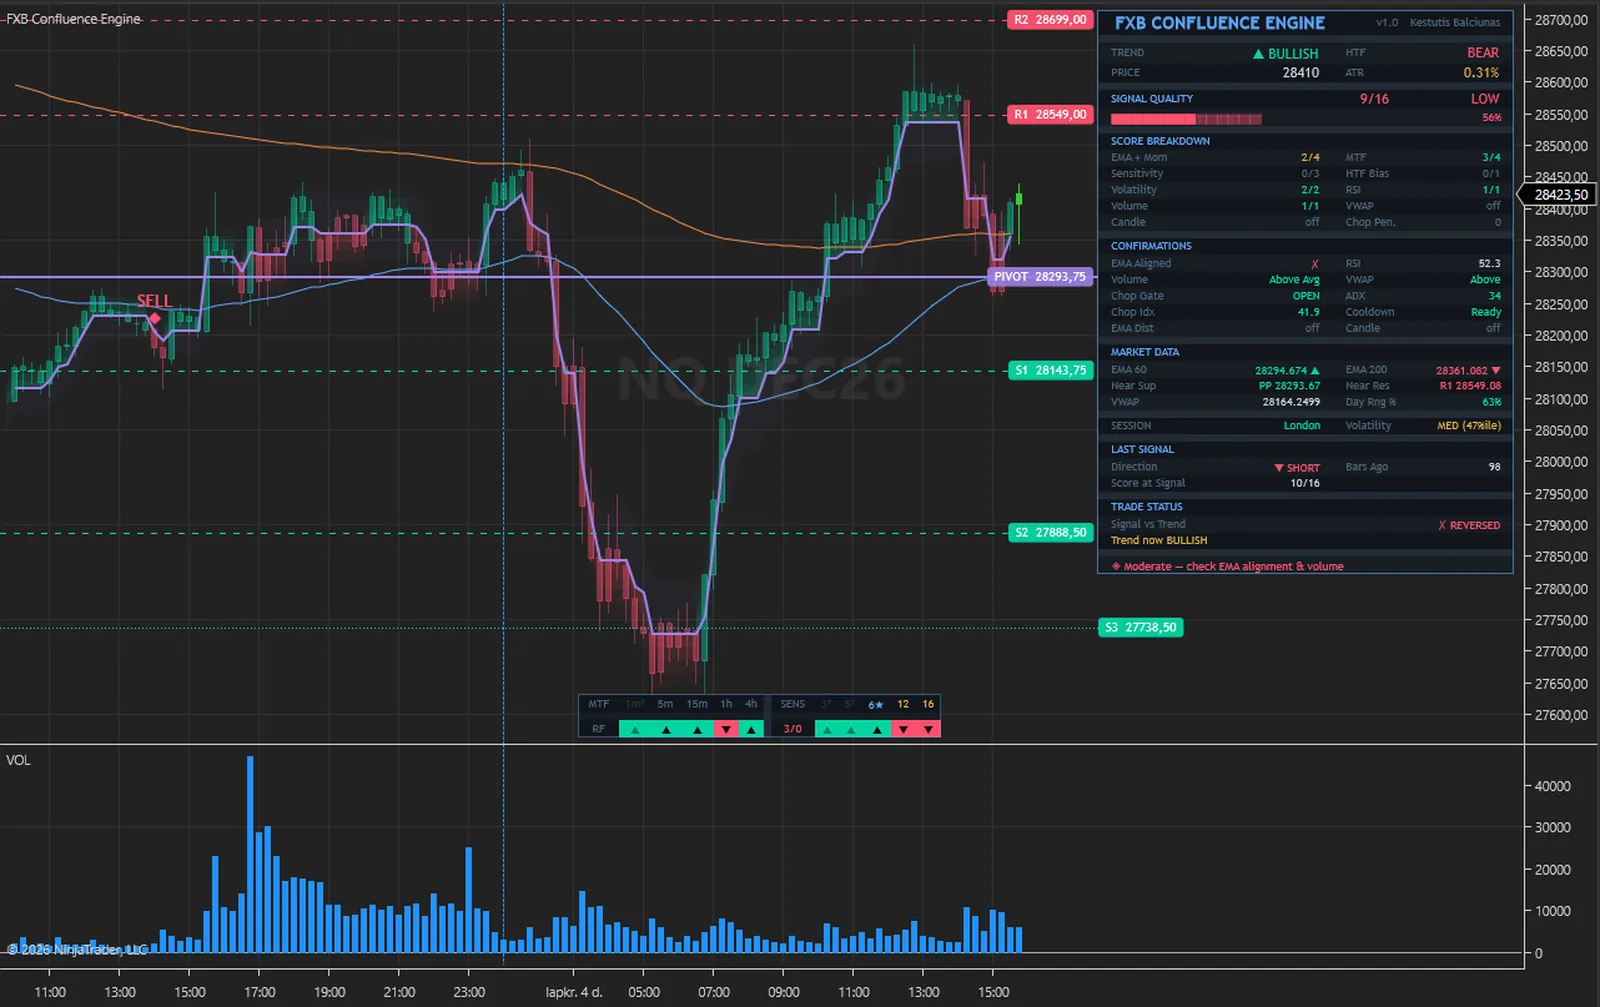
The same steps on every closed bar, in this order. Nothing hidden and nothing exotic.
The line moves only when the price gets further from it than its range, ATR x multiplier x sensitivity / 8. A change of direction on a closed bar is a candidate signal.
Each one counts from its last closed bar. A higher-timeframe value reaches a chart bar only after the higher-timeframe bar has ended.
EMA and momentum, the timeframes, the cross-check at sensitivity 12 and 16, HTF bias, volatility, RSI, volume, and VWAP and candle if they are on, less a chop penalty of 0 to 2.
ADX, Choppiness Index and the cooldown, then the confirmations that are on and the EMA alignment. The score must also reach your Minimum Signal Strength.
BUY or SELL appears at the first tick of the next bar, the Signal series reads +1 or -1, and any alerts you have on fire once.
| Plain range filter | FXB Confluence Engine | |
|---|---|---|
| Signals | Every turn of the line | A turn on a closed bar that passed every gate |
| Signal strength | None | A score with each layer's points shown |
| Choppy markets | It keeps turning | ADX, Choppiness Index and cooldown gates |
| Bigger picture | One chart at a time | HTF bias in the score, five timeframes in the strip |
| Levels | You draw them | Pivots in three formulas, from the previous period |
| Stop and targets | You work them out | You still work them out: none are drawn |
| For your strategies | The line | Six series including Signal and Trend |
The engine that computes everything also runs outside NinjaTrader. With its diagnostic dump switched on, the NinjaTrader edition writes every committed bar with the values it drew; those bars are replayed through the engine outside the platform, and the two files are compared value by value.
On 4,923 MNQ 1-minute bars every one of the 138 series compared was equal on every bar. A second run, with Calculate set to each tick and the chart left live across the switch from history to live bars, gave the same result on 4,213 bars.
What that proves: the indicator receives exactly one closed bar per chart bar with the right open, high, low, close and volume, never double-feeds or skips a bar, and shows the values the engine produced. What it does not claim: it is a test of correct calculation, not of trading results, and it says nothing about future performance.
The full method is in the user guide: User Guide (PDF) and Installation and Quick Start (PDF).
No subscription and no renewal. Pay once and the indicator stays licensed to your NinjaTrader account, updates included.
FXB Confluence EngineNinjaTrader 8 indicator
$77one payment, lifetime licence
The licence is issued to your NinjaTrader account through NinjaTrader's Vendor Licensing, by hand, normally within a few hours and always within 24 hours of your form arriving. You get an email with the download link when it is done.
Because a licence cannot be handed back once it is on your account, a sale is final once the licence has been issued. If you paid and the licence has not been issued yet, email me and I will refund you in full. The user guide is public, so you can read exactly what the indicator does before you pay.
The full terms of sale and the privacy notice for buyers are one page each, in plain language.
Trading carries risk of loss. This is an analysis tool, not financial advice, and no indicator can promise a profit.
Signals, alerts and the Signal series exist on closed bars only and do not repaint. The filter line, the band and the bar colour of a forming bar follow its price until it closes, by design. A higher-timeframe value reaches a chart bar only after the higher-timeframe bar has ended, and pivot levels come from the previous period's high, low and close and stay fixed for the period.
At least 300 bars of the chart's interval. The slow EMA needs 200 bars before a signal can pass the EMA gate, and the volatility rank needs 60. A 5-day chart of 60-minute bars has too few: raise Days to load in the Data Series dialog. Seven more data series load with the indicator, so the first load takes longer while they download.
Usually the gates at work. Read the dashboard's CONFIRMATIONS block: if Chop Gate reads BLOCKED, the ADX and Chop Idx rows name the filter. A signal also needs at least 300 bars on the chart and a score of at least Minimum Signal Strength. On a closed market the session's last bar waits for the reopen.
A phrase chosen from the score alone, in four steps from High conviction down to Weak signal. It adds nothing the score does not say, and it can read High conviction on a bar with no signal, as on the GC chart above with Chop Gate BLOCKED. Treat it as a label for the score, not as advice.
Yes. A strategy can read the plots, and SignalStrength, Signal and Trend are the useful ones. It has to add the same seven secondary series itself in State.Configure. A Market Analyzer column loads the seven series as well, and the indicator is not advertised as a scanner.
NinjaTrader 8.1 Desktop for Windows; the build is tested on 8.1.9.0. Any data connection that delivers bars works, including the free simulation connection.
No. NinjaTrader 8 is free to download and use for charting and simulation, with free real-time futures data for the simulator. A live account with a broker of your choice is a separate step that this indicator does not need. NinjaTrader is the platform it runs inside, not a broker.
No. The licence is tied to your NinjaTrader account login through NinjaTrader's Vendor Licensing, not to a PC. Log in on any installation and the indicator runs; a new PC needs no transfer.
I issue it by hand in the NinjaTrader Vendor Dashboard. It is normally done within a few hours and always within 24 hours of your form arriving, including weekends.
No. It is one payment of 77 USD for a lifetime licence on one NinjaTrader account, with future updates included.
Once the licence has been issued the sale is final, because a licence on your account cannot be handed back. That is why the user guide is public: read it first. If you paid and the licence has not been issued yet, email me and I will refund you in full.
Yes. Email me from the address you bought with and I will move the licence to your new account login.
No indicator can promise that, and this one does not. It gives you a score for each filter turn, the state of every gate and pivot levels to plan around. What you do with that, and how you size positions, decides the outcome.
Each one is a compiled NinjaScript Add-On, 77 USD once, with its own page, charts and public user guide.
A range filter whose regime flips on closed bars print BUY and SELL plates, with a stop in one of three modes, three targets at multiples of the risk, an EMA cloud and a dashboard.
$77 one payment, lifetime licence
A fast and a slow EMA with a trend band, three signal families on closed bars, swing support and resistance rays, and an entry, a stop and two ATR targets for each signal.
$77 one payment, lifetime licence
The closes that would print your RSI levels, drawn as bands with a midline, a trend regime, signals scored in five layers, a stop, three targets and a dashboard.
$77 one payment, lifetime licence
77 USD once. A lifetime licence on your NinjaTrader account, updates included, and the licence issued within 24 hours.


