Bins that lean
The session's volume goes into bins that lean with the channel, 30 by default and 5 to 100 by setting. Each bin's length shows its volume against the busiest one. The profile is green when the channel rises and red when it falls.
 NinjaTrader 8 indicator, NinjaScript
Helix Volume Profile fits a log-regression channel to each higher-timeframe session, sorts that session's volume into bins that lean with the channel and carries the busiest bin forward as a Point of Control line. Around it you get the session high, low and mid lines, forward extensions for the live session and a label with buy volume, sell volume and delta. The chart interval picks the session length, the contract volume of your bars fills the bins, and 10 finished sessions stay on the chart by default. It only draws: it places no orders and raises no alerts, and everything on the live session keeps moving until that session closes.
$77one payment, lifetime licence
Get the lifetime licence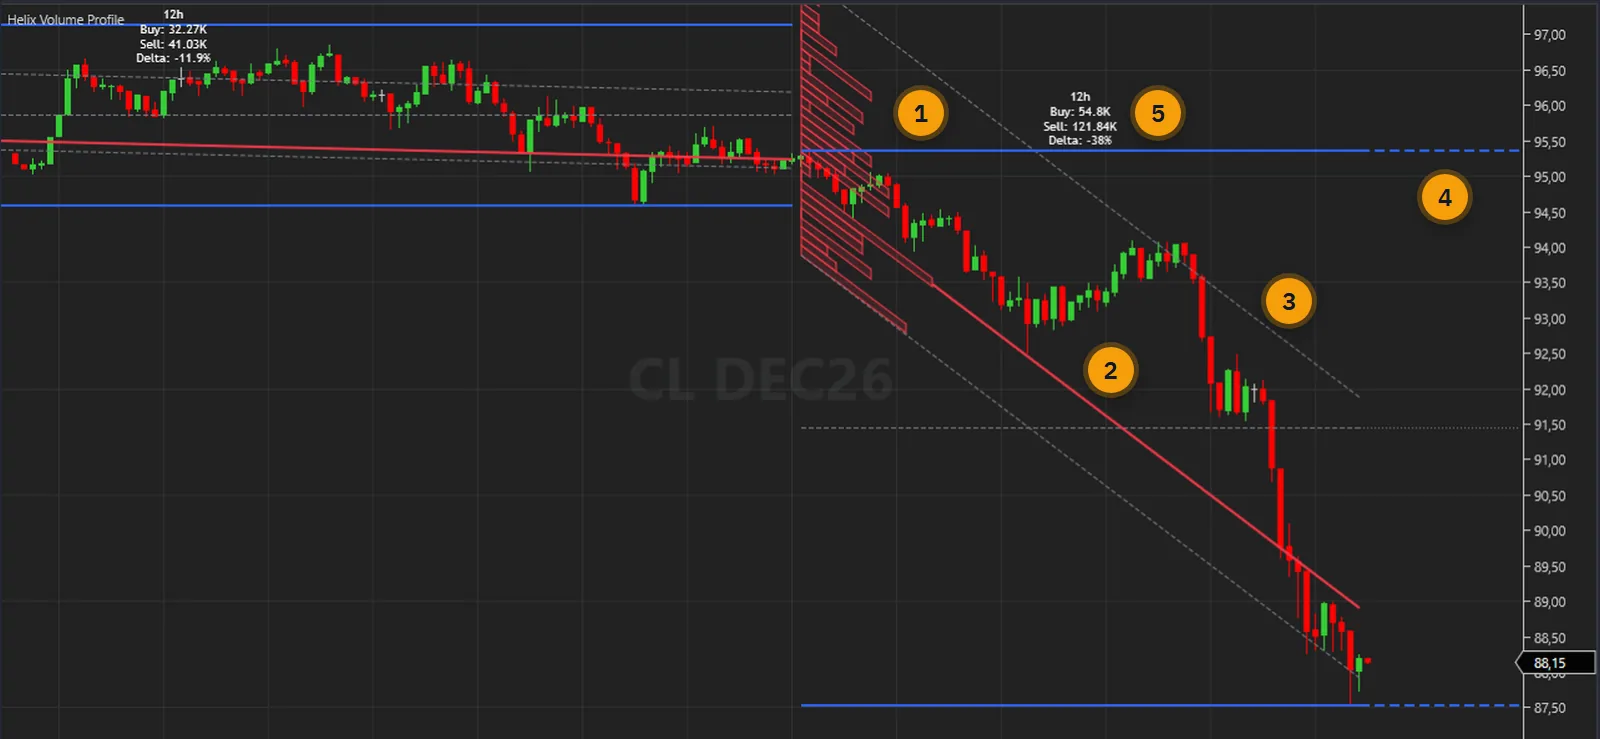
A plain session profile stacks volume on flat price rows. When a session trends, price keeps moving through those rows, so the stack tells you where volume traded in price and nothing about where it sat against the move itself. The trend is yours to draw in by hand and to judge by eye.
A second piece of work comes with it. You mark the session high, low and middle, carry them forward, and work out whether the up bars or the down bars carried more volume. Then a new session starts and you do it again.
Helix Volume Profile fits a regression to the logarithm of each session's closes, draws a channel around the fit and sorts the volume into bins that lean with it. The busiest bin becomes the Point of Control line, and the levels, the extensions and the Buy, Sell and Delta label are drawn for you. All of it moves as bars arrive until the session closes, and then the finished session stays as it was.
The user guide is public: every parameter and the verification are in it. Read it before you pay.
One indicator in the price panel: one profile, one channel and one set of levels per higher-timeframe session.
The session's volume goes into bins that lean with the channel, 30 by default and 5 to 100 by setting. Each bin's length shows its volume against the busiest one. The profile is green when the channel rises and red when it falls.
The centre of the busiest bin, drawn as a solid line in the profile's colour and parallel to the channel. It starts 15 bars into the session.
A regression of the logarithm of the session's closes, with dashed lines at plus and minus Channel Width standard deviations, 1.0 by default. Closes outside it do not enter the profile.
Solid blue lines at the session's high and low so far, and a dashed grey line at their midpoint. Colours, line width and the mid line are settings.
The live session's high and low (dashed) and mid (dotted) run 25 bars past the newest bar by default. Raise Right side margin in chart Properties to see them, or they are cut off at the edge of the chart.
White text over each session: its length, buy volume, sell volume and delta. It has no colour or size setting, so it suits a dark chart background, and one switch turns it off.
Auto HTF picks 4h on 1 minute, 12h on 2 to 14 minutes, 2D on 15 to 59, weekly on 60 to 239 and monthly on 240 to 1439. Switch it off to set 240, 720, D, 2D, W, M, 3M or 12M yourself.
A finished session keeps the drawing it had when it closed. 10 stay on the chart by default, and you can keep from 1 to 50.
SessionHigh, SessionLow, SessionMid and Poc can be read by NinjaScript strategies and shown as Market Analyzer columns. The bins and the label text are not exposed as series.
Every picture below is a NinjaTrader 8 capture with numbered notes added. Nothing on the charts is drawn by hand. Click any image to enlarge it.
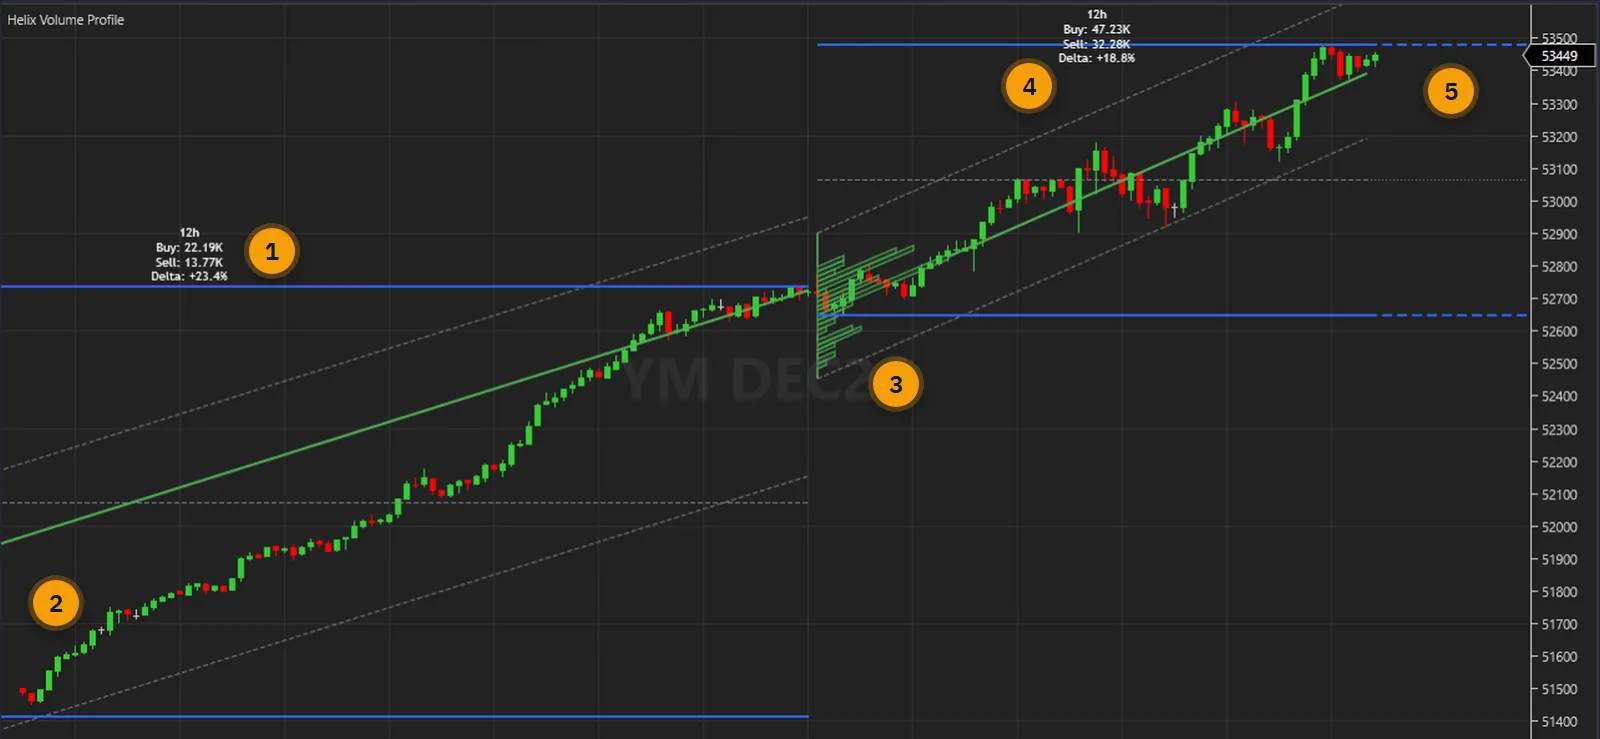
Auto HTF resolves a 5-minute chart to 12h sessions, so this YM chart holds two: a finished one on the left and the live one on the right. A finished session keeps the drawing it had when it closed. The live session's high, low, regression, channel and bins all change as bars arrive until it closes. That is how the calculation works, not a fault, so read the live shape as the session so far.
Only the live session has forward extensions. They run past the newest bar, so they need room: raise Right side margin in chart Properties, as on this chart, or they are cut off at the edge. Extend Levels Forward and Extension Bars, 25 by default, are the settings behind them.
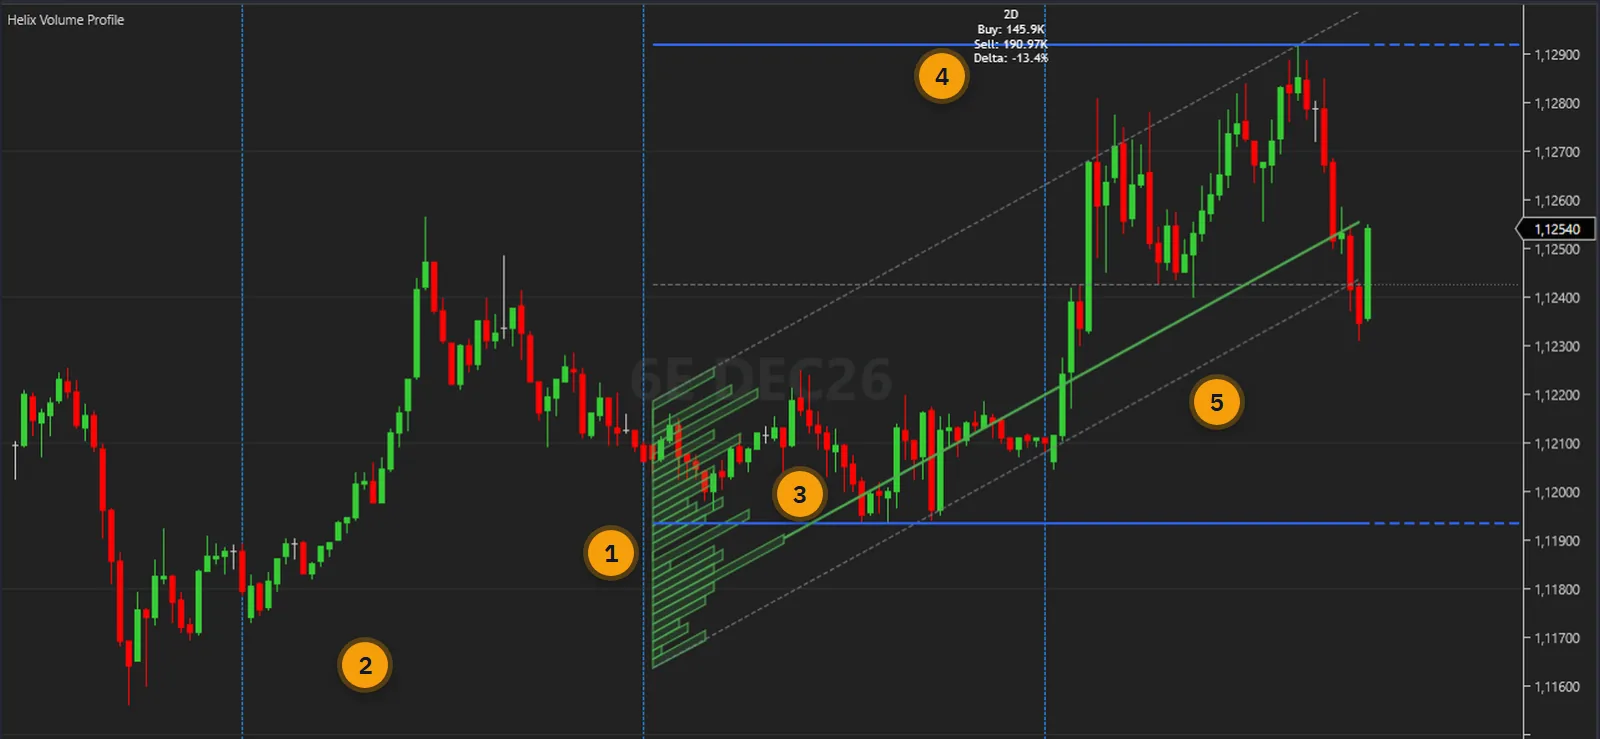
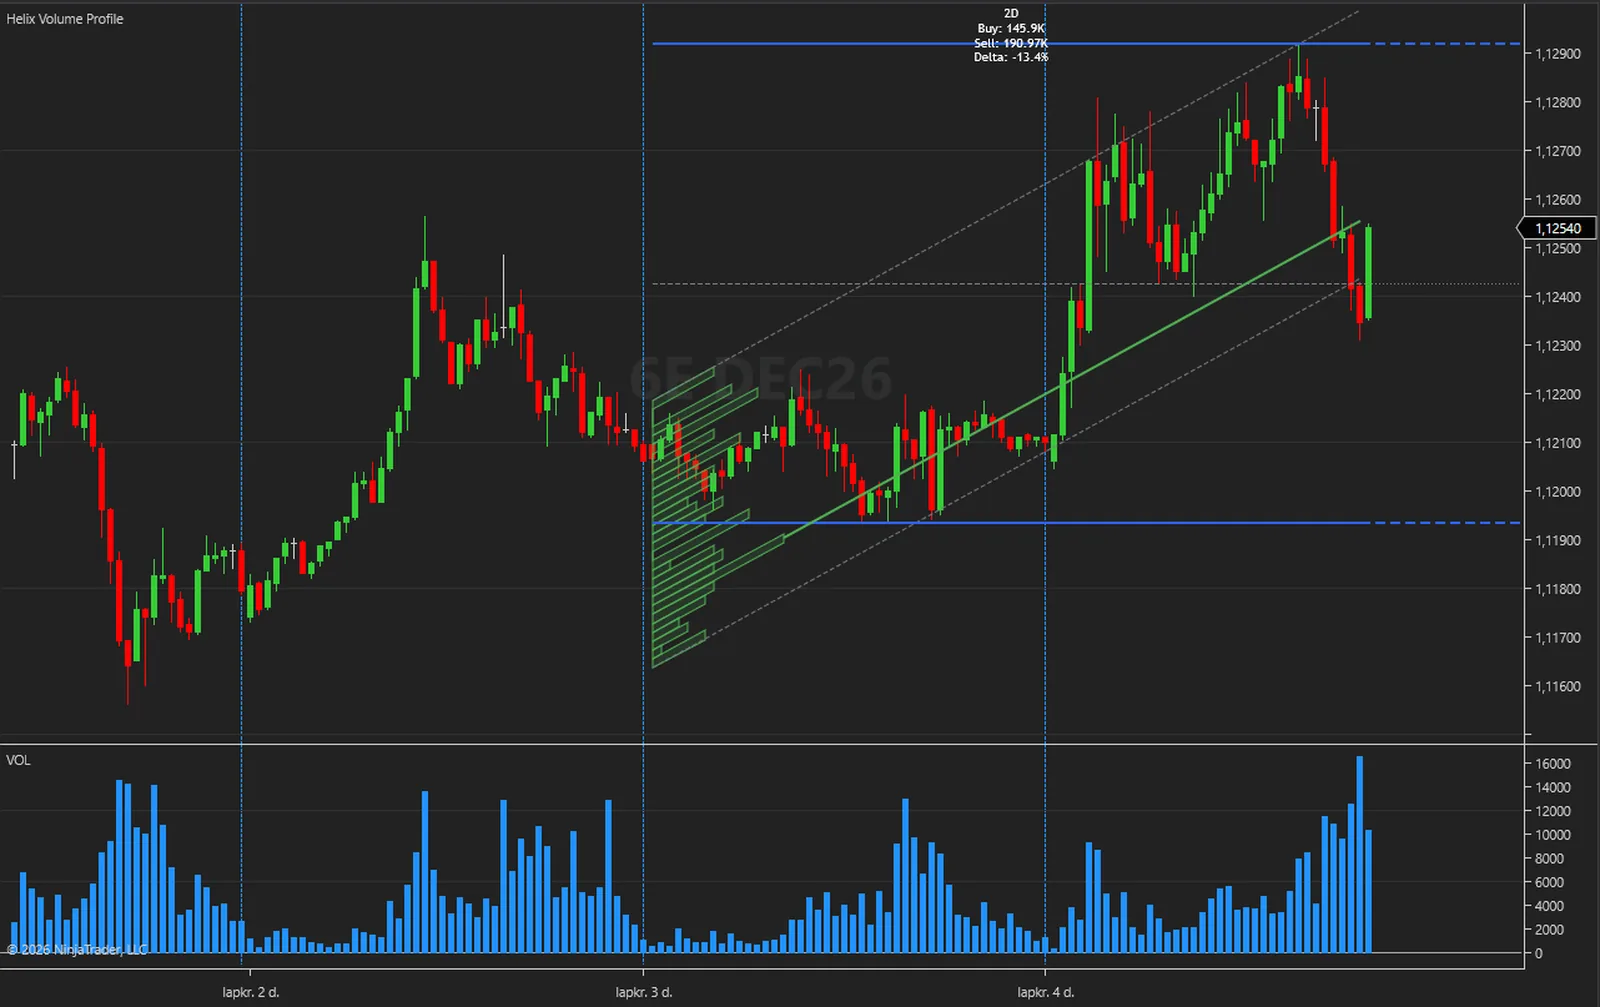
The profile starts at the session's first bar and grows to the right, so a chart shows it only when that bar is in view. On a 15 or 30-minute chart Auto HTF picks a 2D session that runs for days, so scroll back to where the session began, as on this 6E chart, or set a shorter session with Auto HTF off. A chart holding less than one session shows nothing, because drawing starts at the first session boundary: raise Days to load in the Data Series dialog.
The colour and the label answer different questions. The bins and the POC are green here because the channel rises over the session. The Delta of -13.4 % says the down bars of this session so far carried more volume than the up bars. It describes what those bars did. It is not a probability of anything.
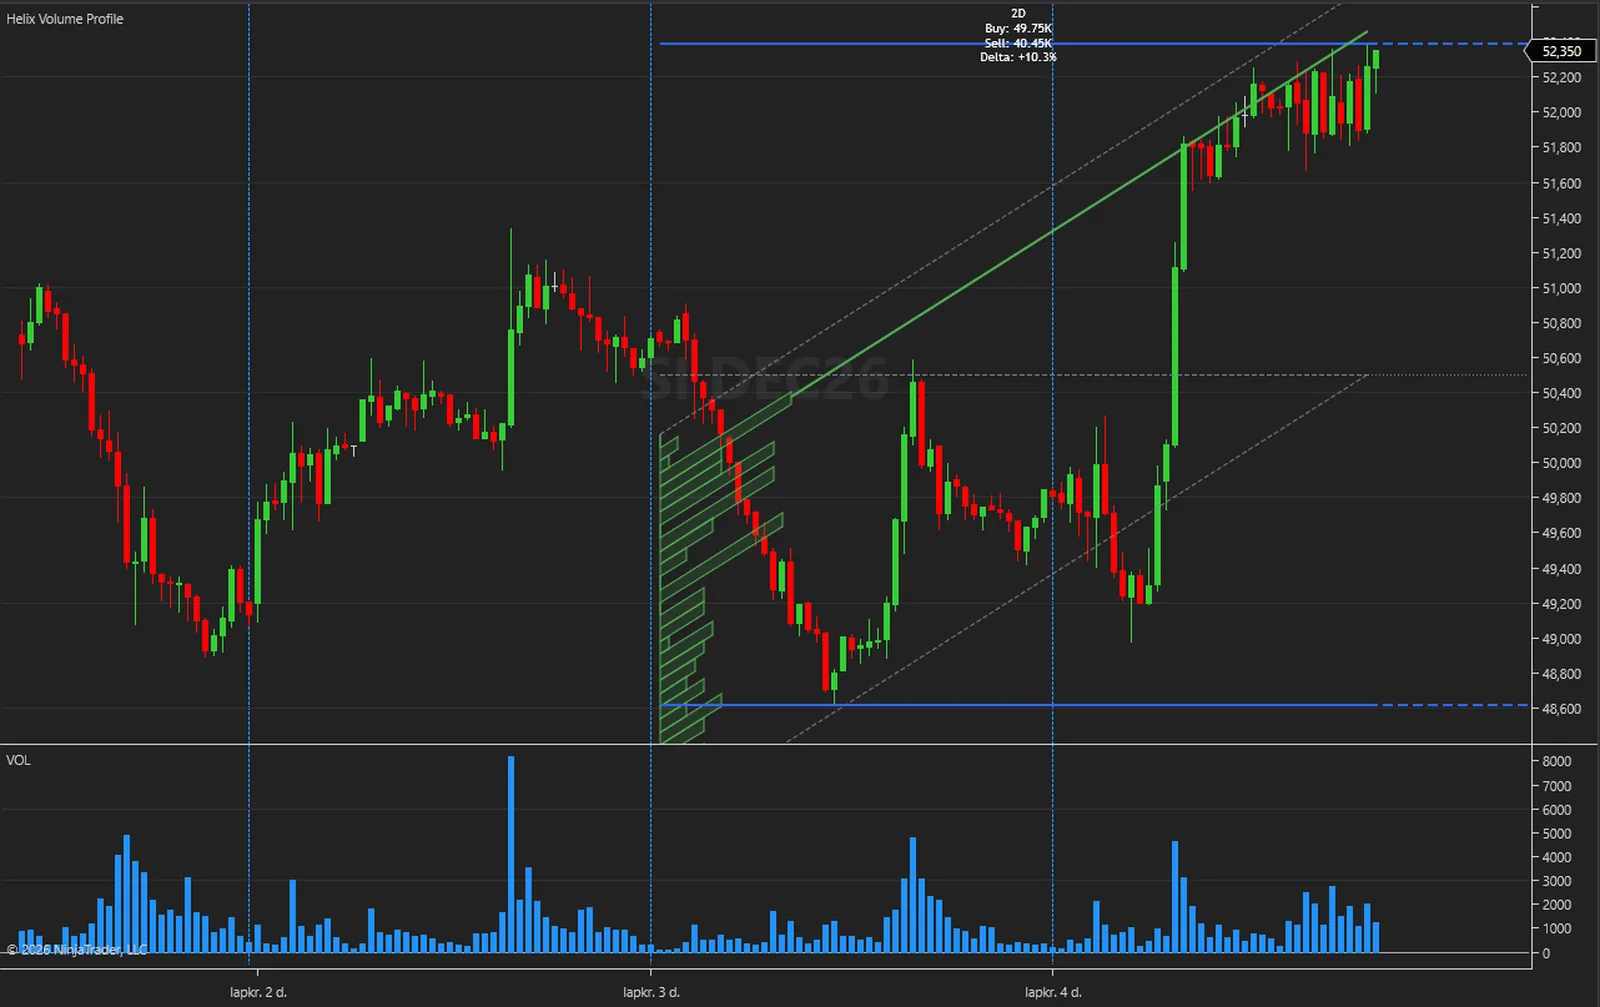
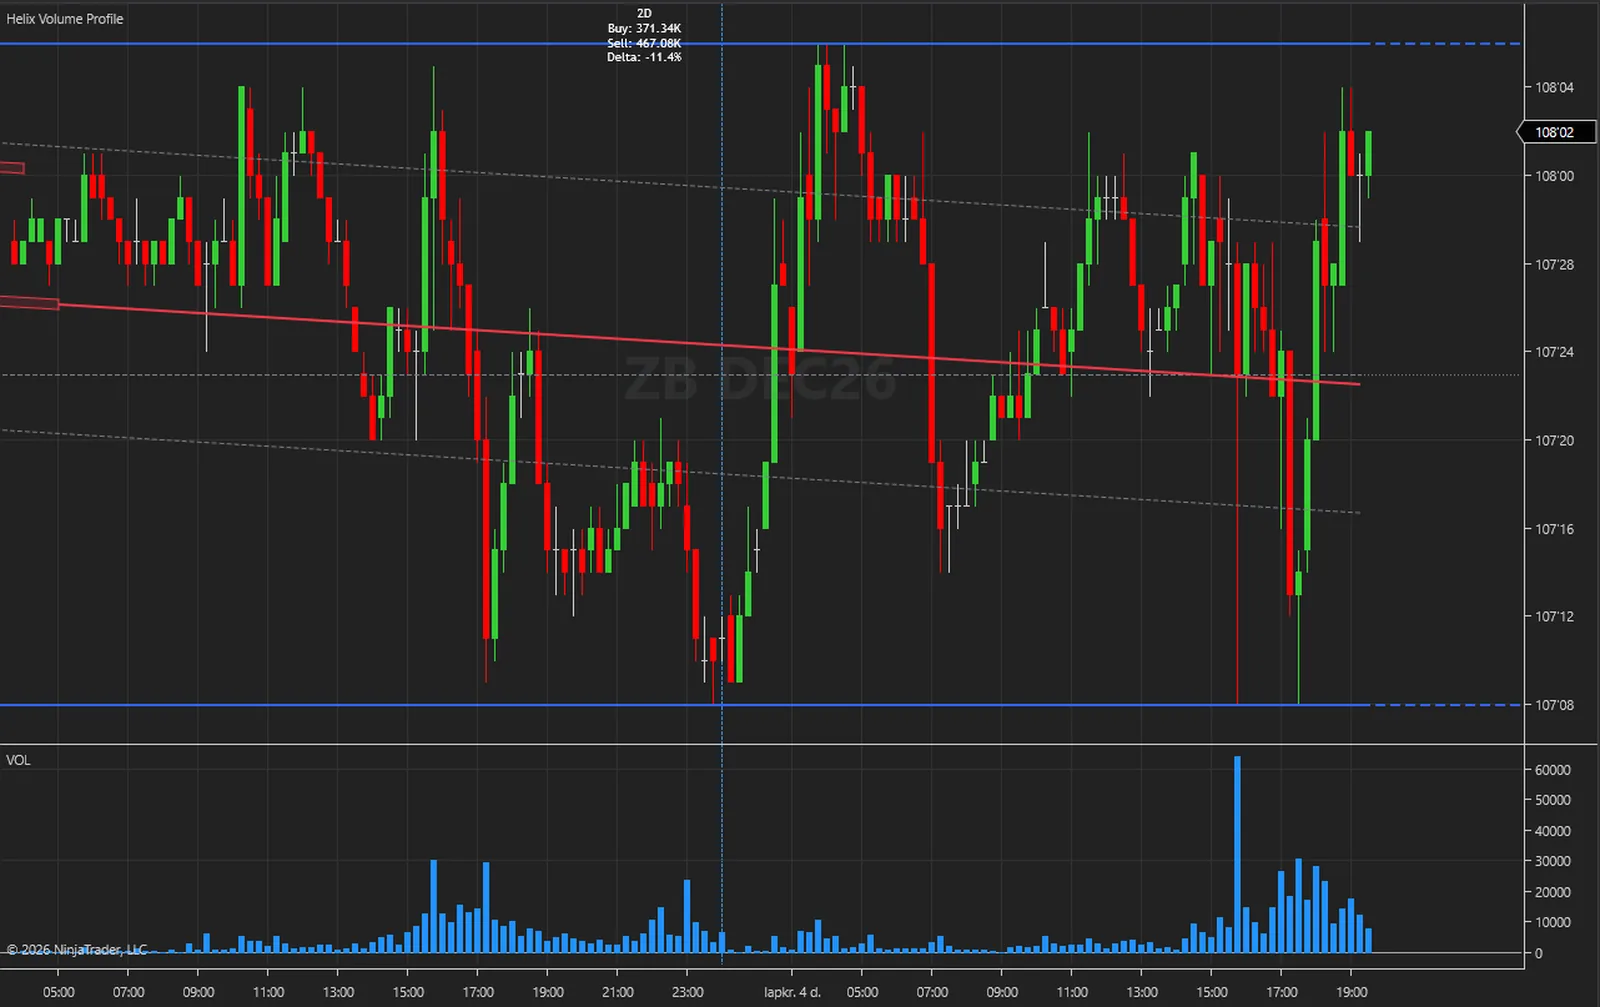
The calculations are not tied to an instrument. The captures below were taken in NinjaTrader 8 on the free simulation feed: index, energy, metal, currency and rate futures, from 1-minute to 30-minute bars, with the indicator at its default settings on every one.
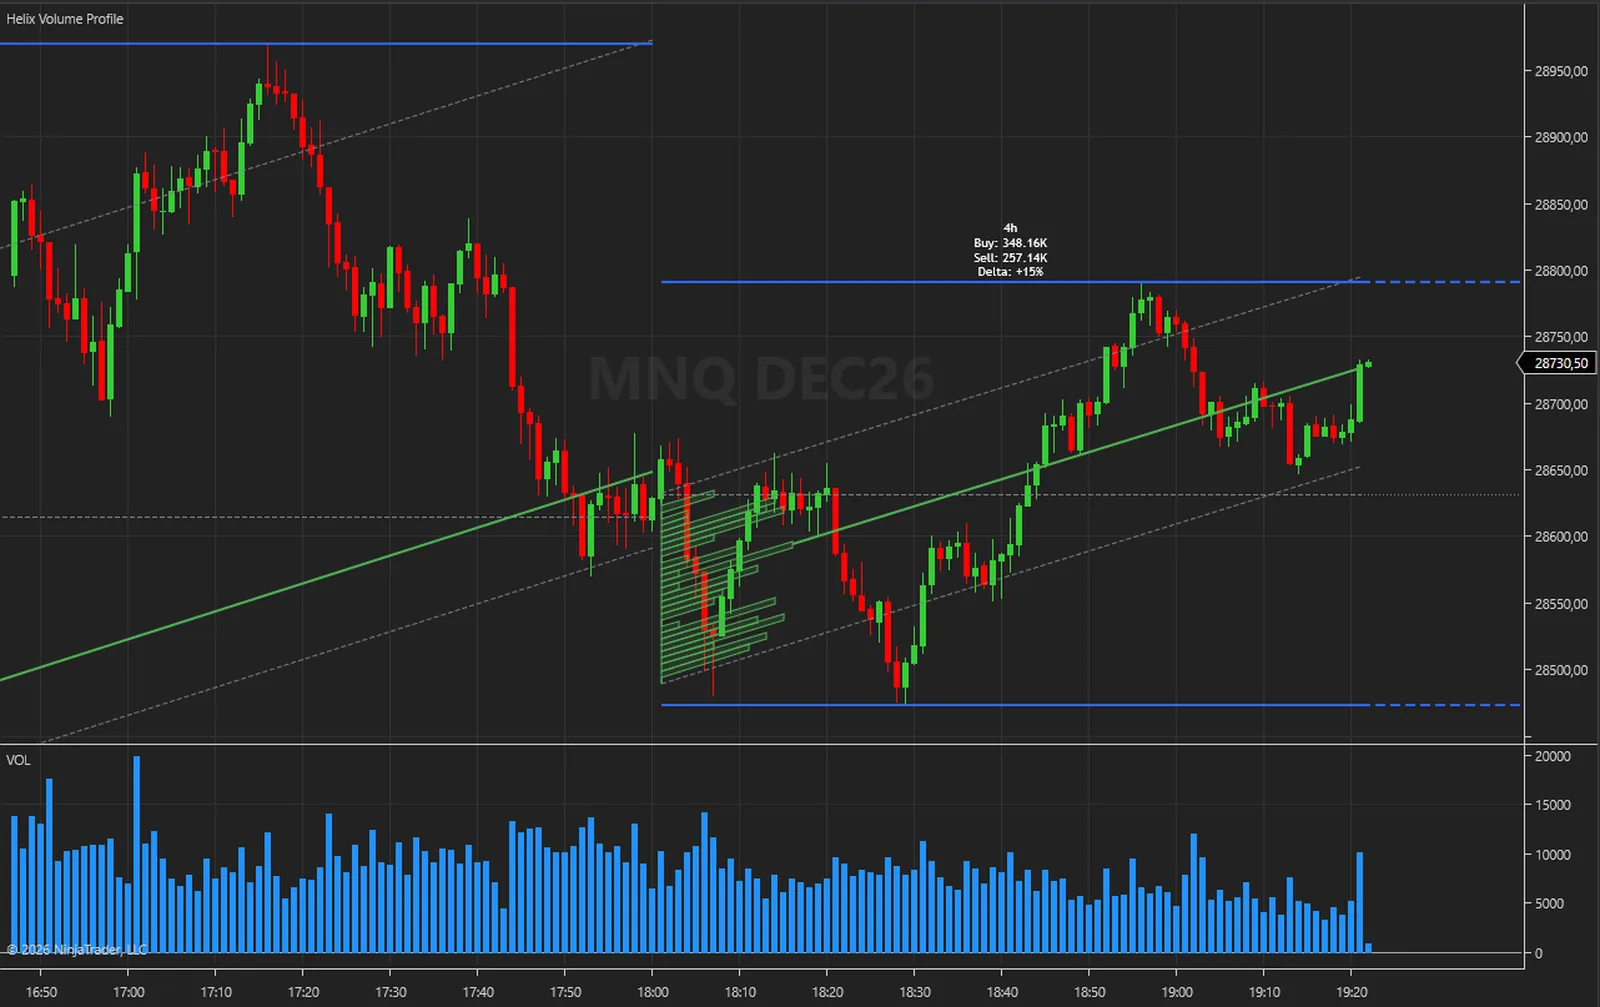
On a futures chart the bars carry real contract volume, and the indicator works from those bars, not from tick data or the order book. A bar's whole volume goes to the one bin that holds its close, and a close outside the channel enters no bin, so the bins can add up to less than the session's volume. On a feed with no volume the profile, POC and channel stay absent and the label reads 0. On the 15-minute pictures below only the tips of the bins show at the left edge, because a 2D session's first bar sits further back: the profile is there when that bar is in view.
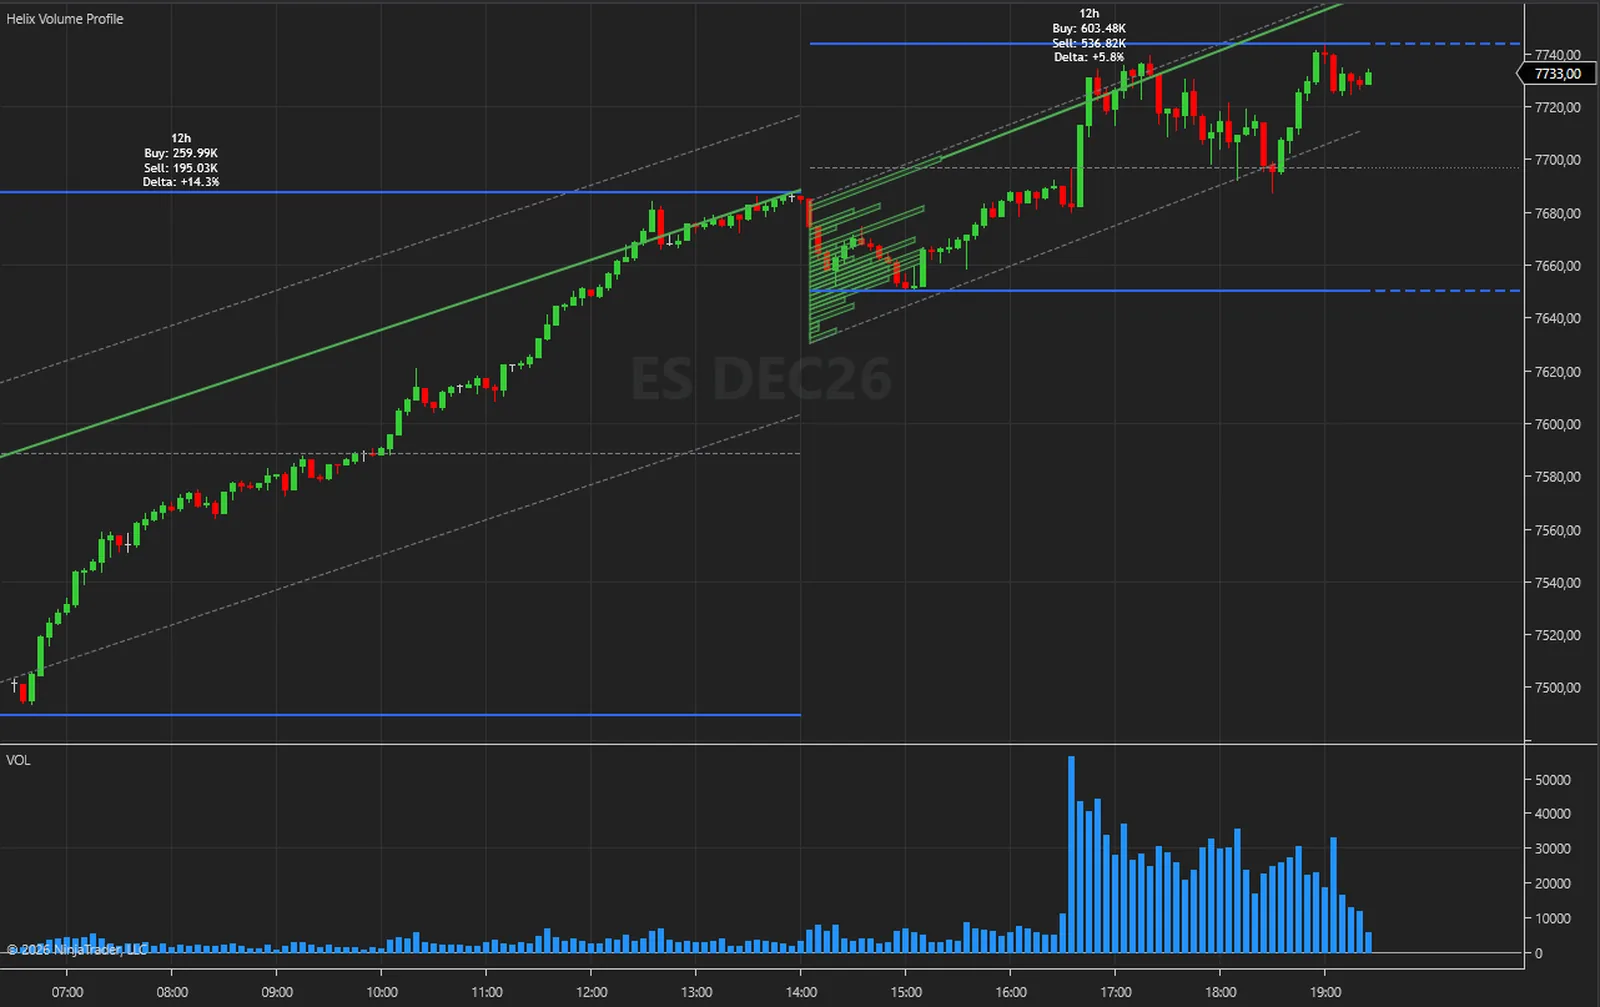
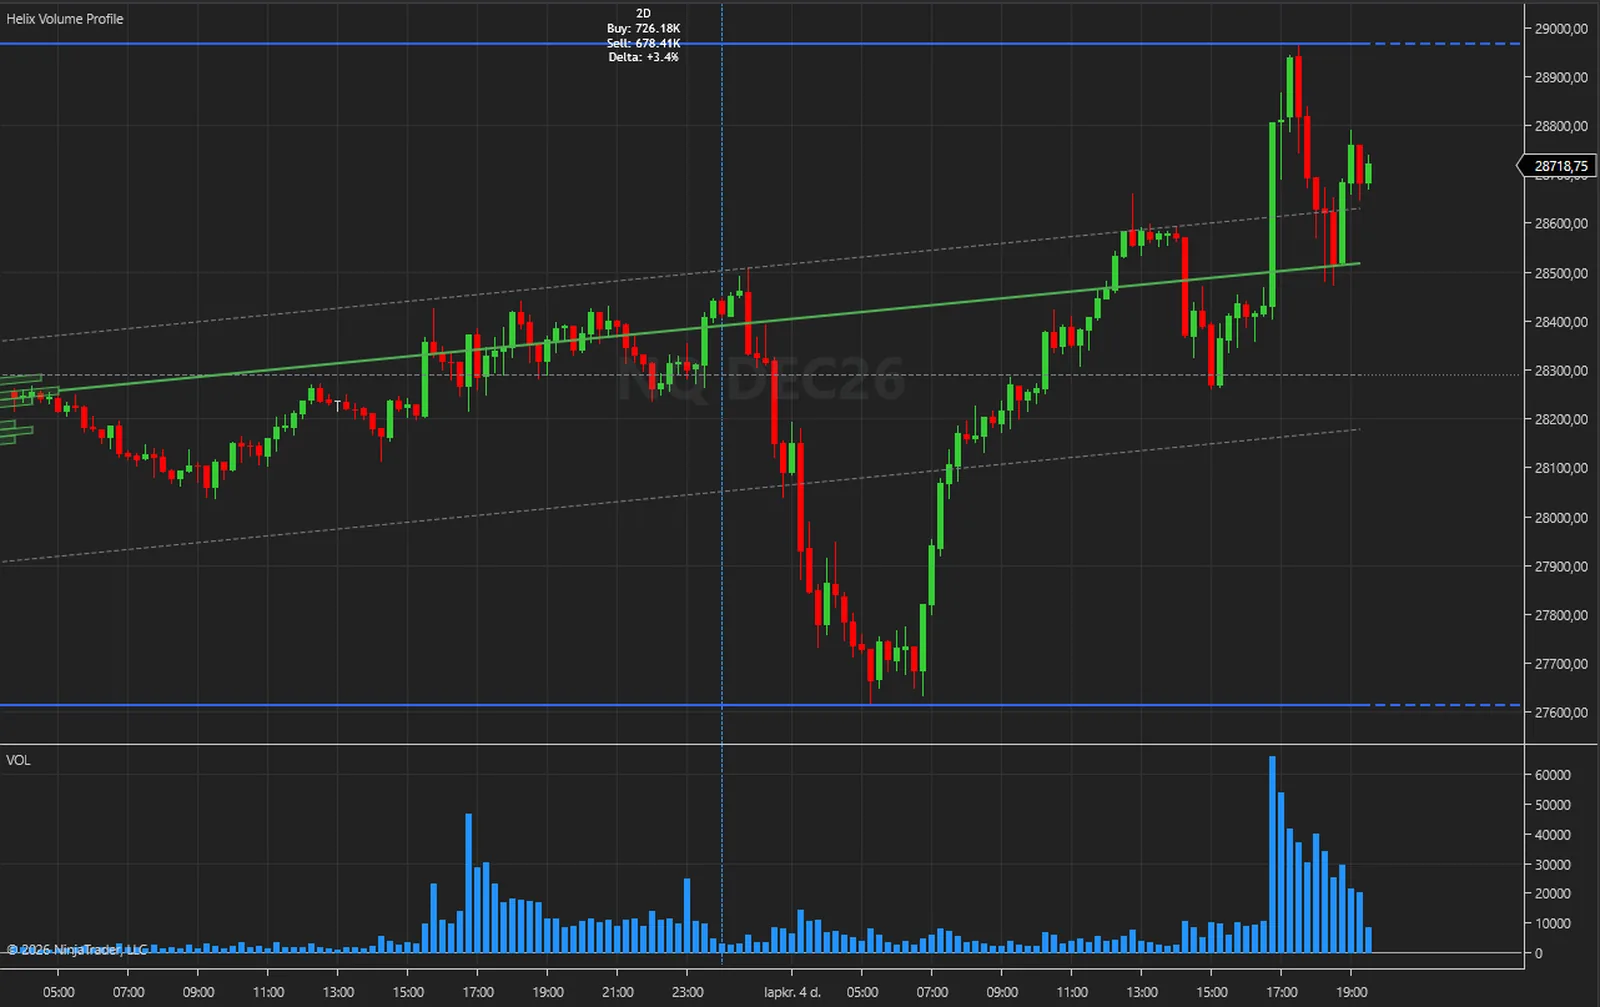
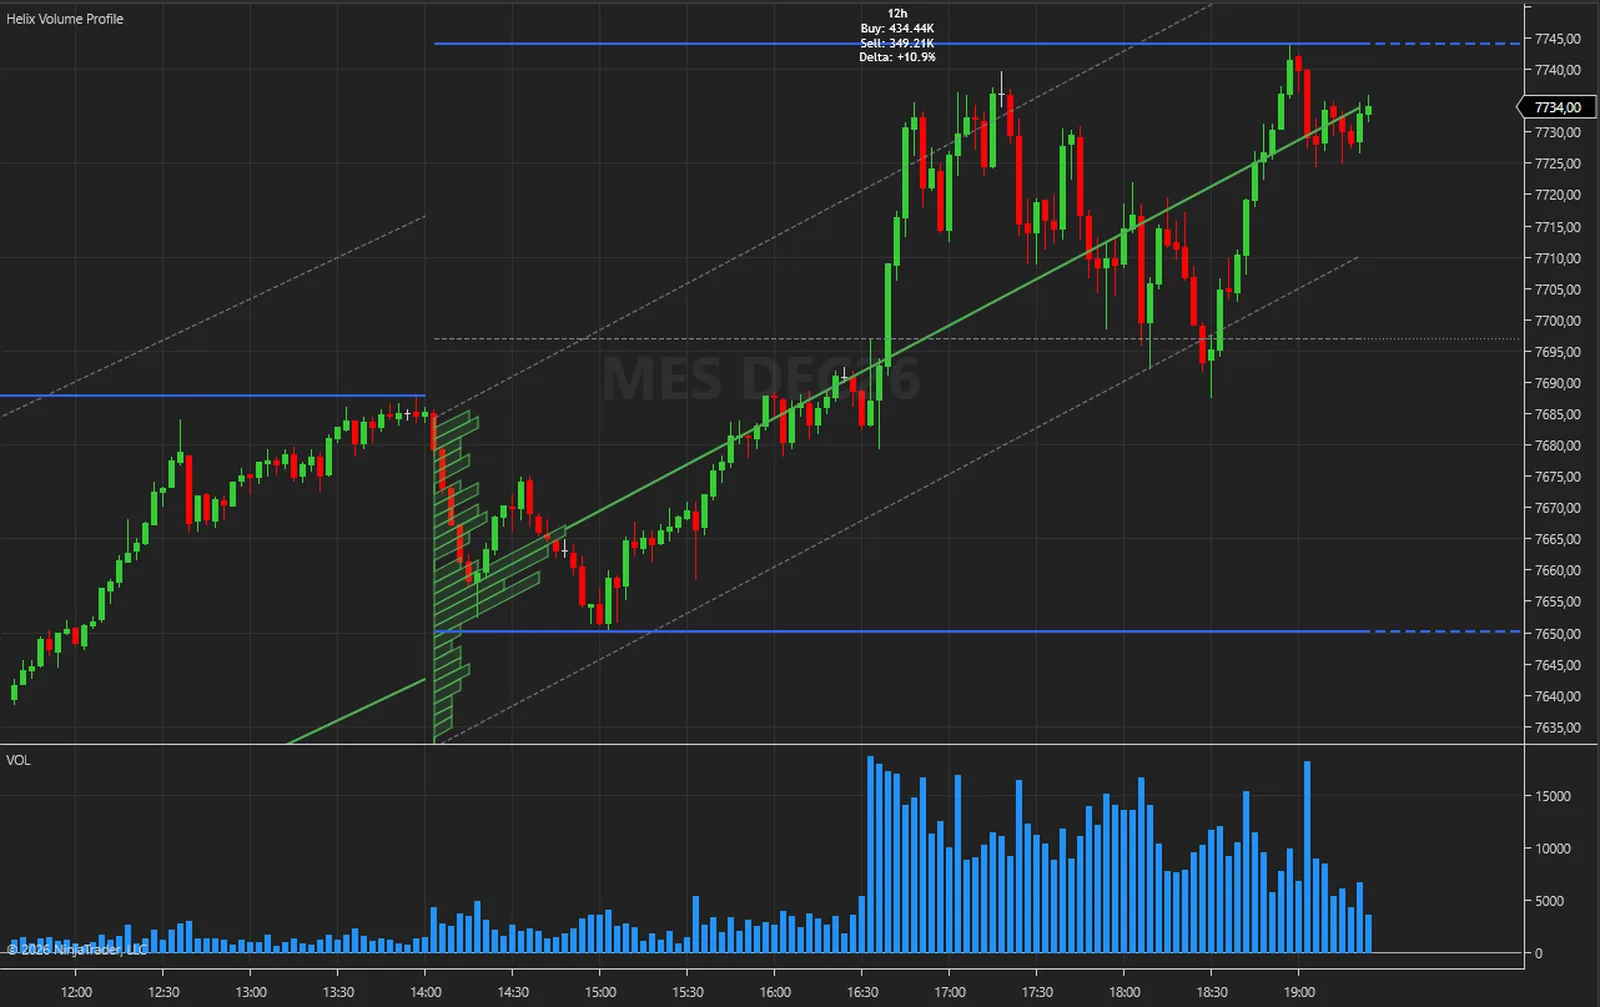
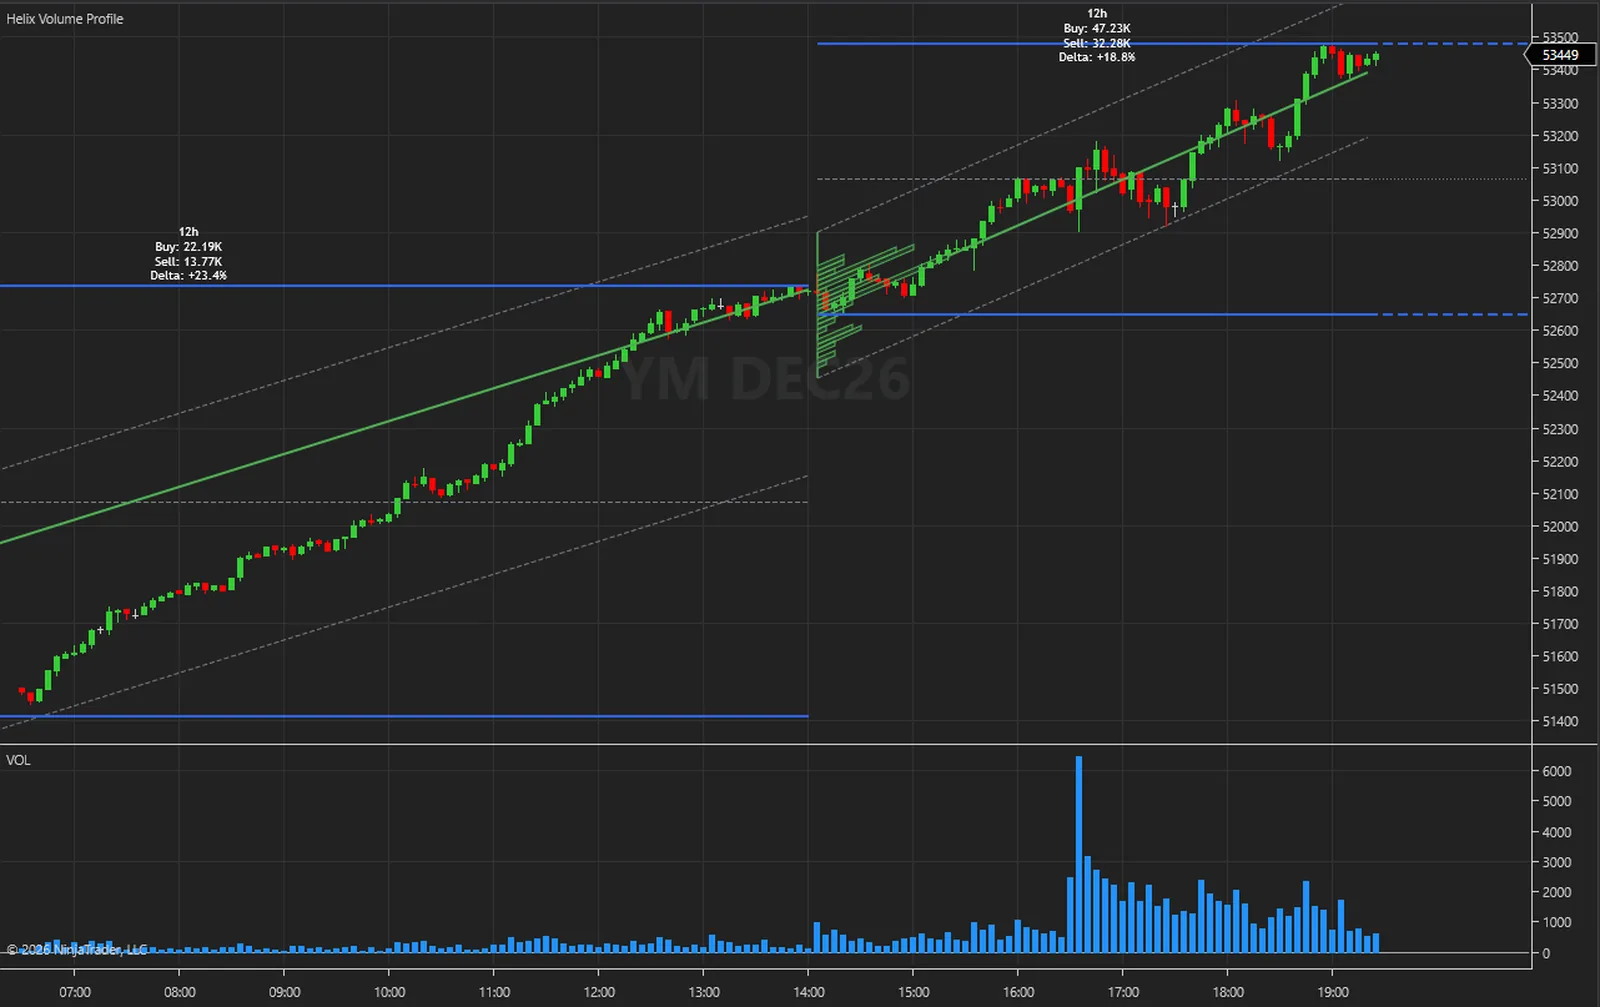
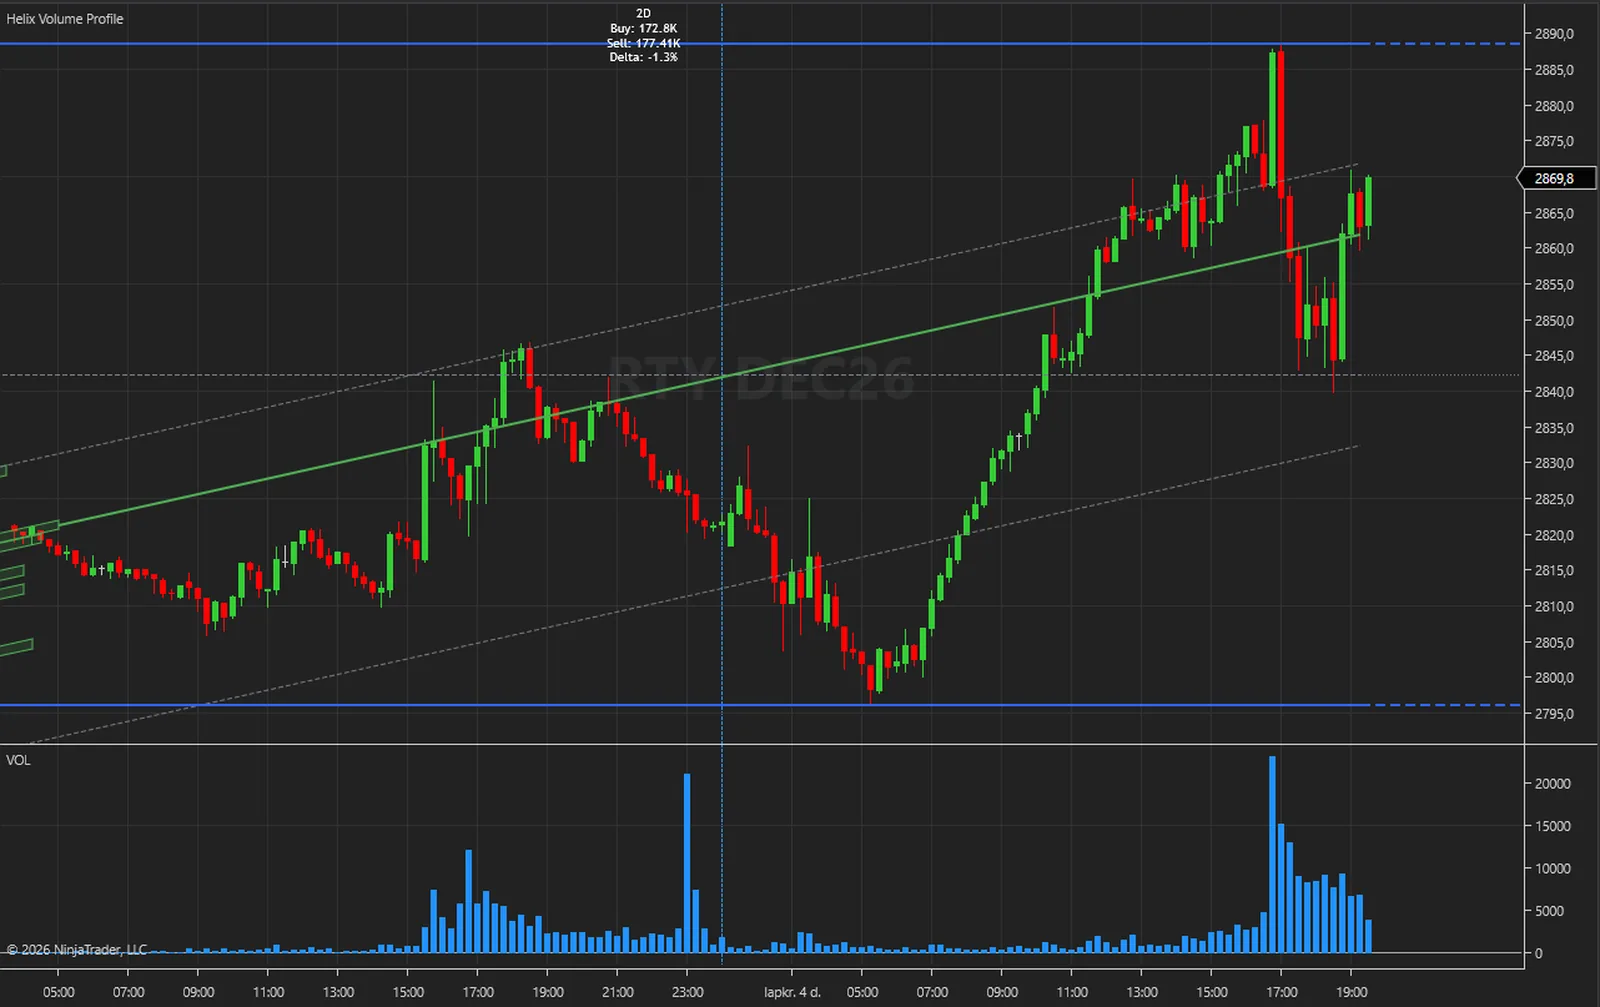
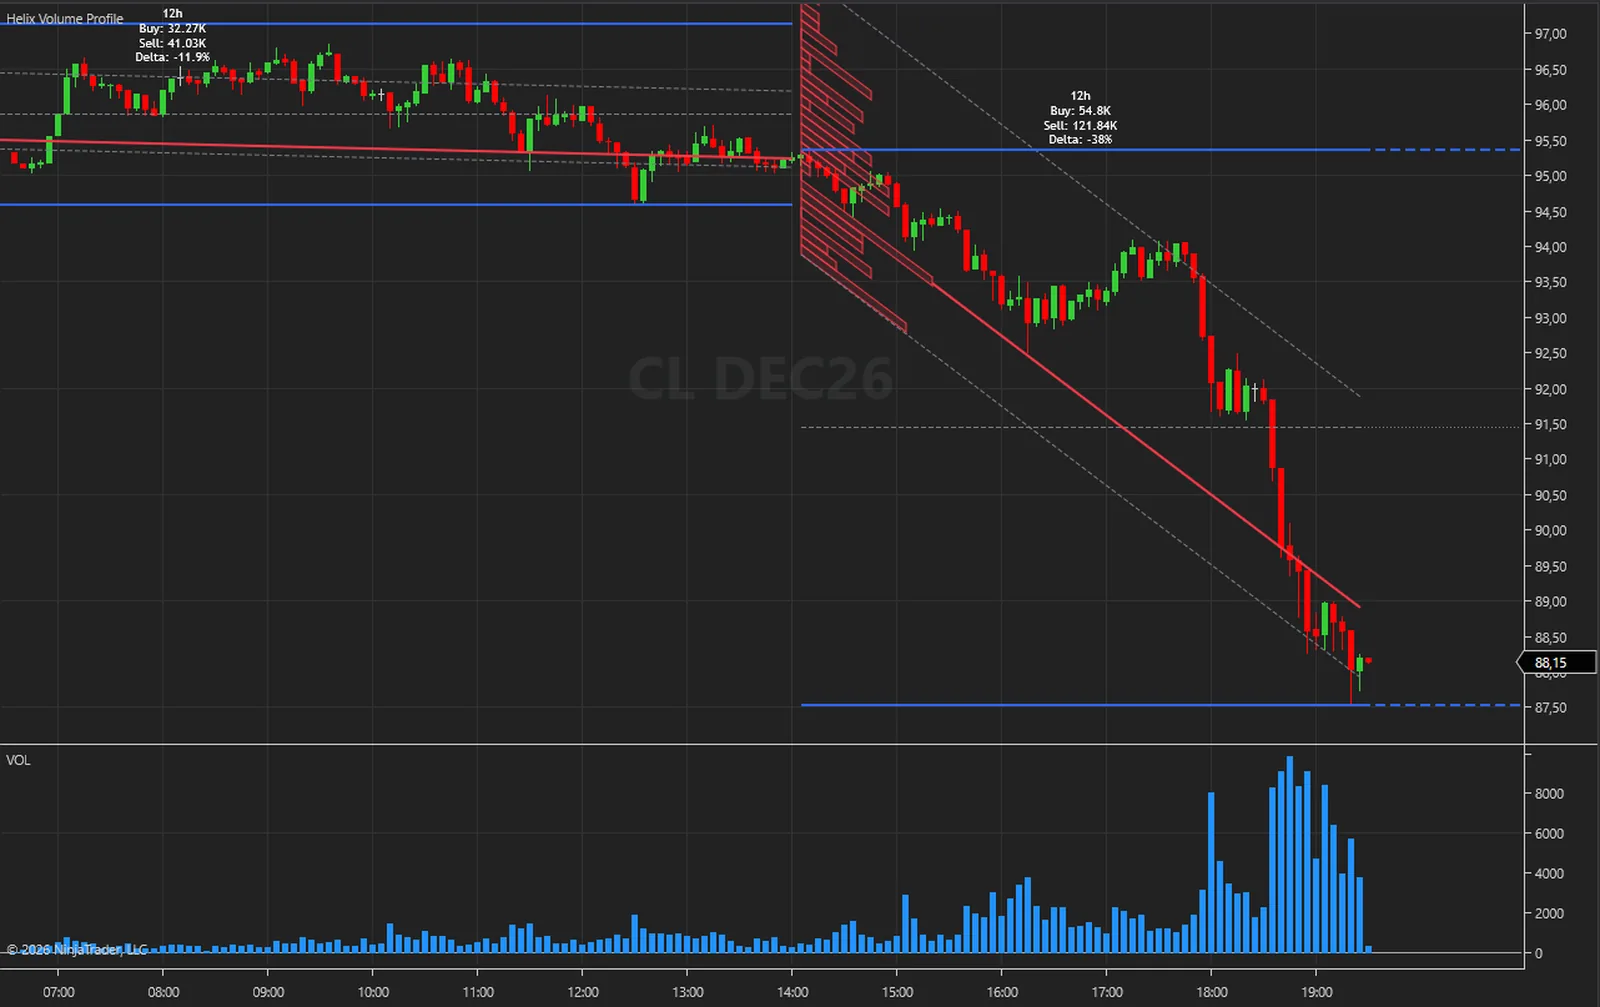
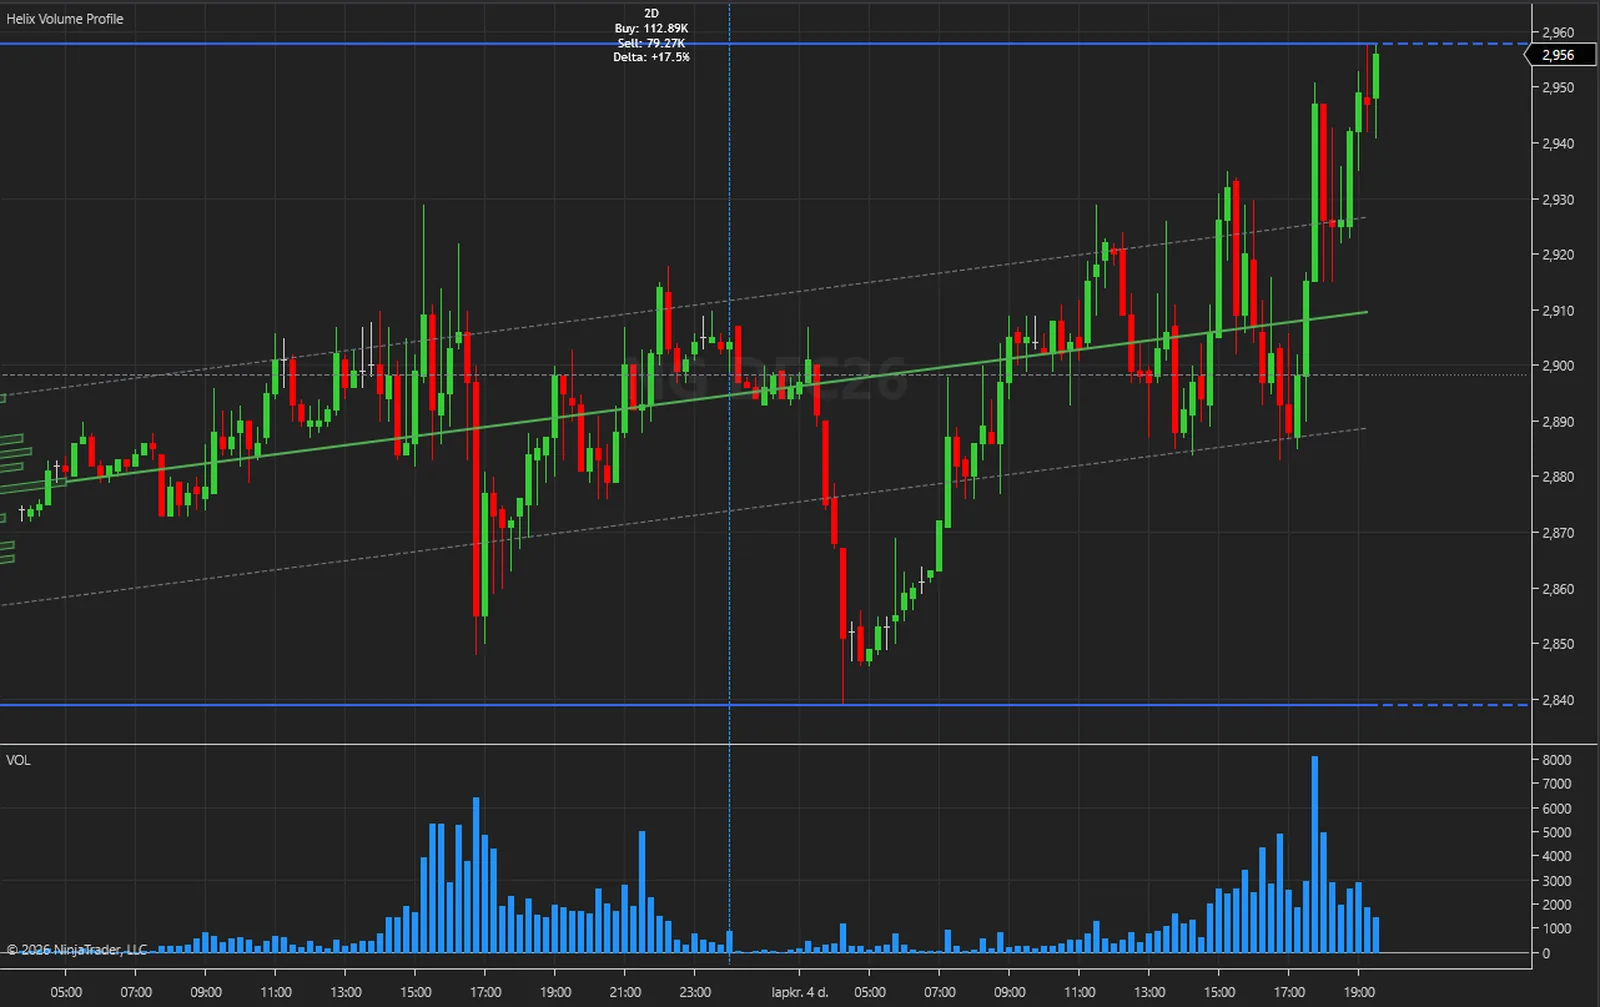
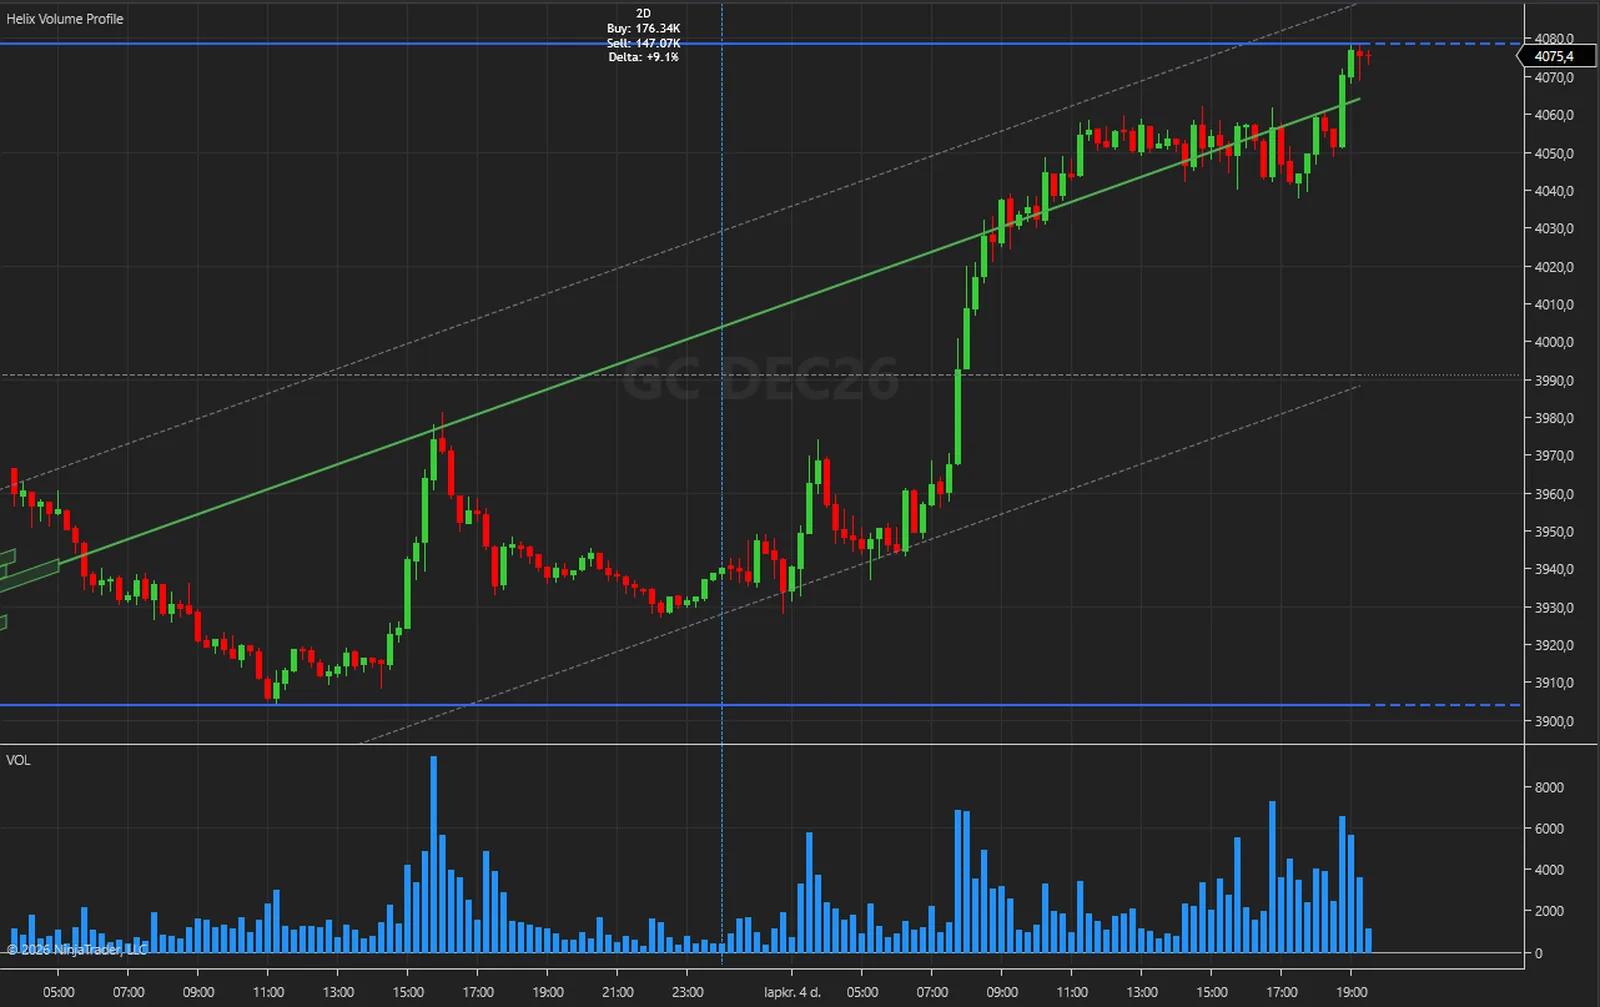
The same steps each time a bar is calculated, walking the whole session so far.
A new session starts on the first bar whose open time falls in a new block. Auto HTF picks the length from the chart interval, or you set it. The first bar of a session has no channel, POC or profile yet; they appear on the next bar.
A regression runs through the logarithm of the session's closes, and the channel sits at plus and minus Channel Width standard deviations of those closes.
A bar's whole volume goes to the one bin that holds its close. A bar whose close lies outside the channel enters no bin, so the bins can add up to less than the session's volume.
The bin with the most volume gives the POC, the lowest of them on a tie. The session high, low and mid follow the bars so far, and the live session gets its forward extensions.
Up bars count as buy and down bars as sell, and delta is their difference as a percentage of their sum. When the session closes its drawing stays as it was and a new session begins.
| Plain volume profile | Helix Volume Profile | |
|---|---|---|
| Bins | Flat, at fixed prices | Lean with the session's channel |
| Point of Control | A flat price | A line parallel to the channel |
| Trend context | You draw your own | A log-regression channel per session |
| Session length | You choose it | From the chart interval, or you choose it |
| Session levels | You mark them | High, low and mid, extended for the live session |
| Buy and sell | Varies by tool | Up and down bars with a delta, no tick data |
| For your strategies | Varies by tool | Four series: high, low, mid and POC |
The engine that computes everything also runs outside NinjaTrader. With its diagnostic dump switched on, the NinjaTrader edition writes every committed bar with the values it drew; those bars are replayed through the engine outside the platform, and the two files are compared value by value.
On 5,280 MNQ 1-minute bars every one of the 156 series compared was equal on every bar. A second run, with Calculate set to each tick and the chart left live across the switch from history to live bars, gave the same result on 4,213 bars.
What that proves: the indicator receives exactly one closed bar per chart bar with the right open, high, low, close and volume, never double-feeds or skips a bar, and shows the values the engine produced. What it does not claim: it is a test of correct calculation, not of trading results, and it says nothing about future performance.
The full method is in the user guide: User Guide (PDF) and Installation and Quick Start (PDF).
No subscription and no renewal. Pay once and the indicator stays licensed to your NinjaTrader account, updates included.
Helix Volume ProfileNinjaTrader 8 indicator
$77one payment, lifetime licence
The licence is issued to your NinjaTrader account through NinjaTrader's Vendor Licensing, by hand, normally within a few hours and always within 24 hours of your form arriving. You get an email with the download link when it is done.
Because a licence cannot be handed back once it is on your account, a sale is final once the licence has been issued. If you paid and the licence has not been issued yet, email me and I will refund you in full. The user guide is public, so you can read exactly what the indicator does before you pay.
The full terms of sale and the privacy notice for buyers are one page each, in plain language.
Trading carries risk of loss. This is an analysis tool, not financial advice, and no indicator can promise a profit.
While a session runs, yes, by design. The calculation has no closed-bar gate: the session high and low, the regression, the channel and every profile bin change as bars arrive, and the whole drawing keeps moving until the higher-timeframe session closes. A finished session keeps the drawing it had when it closed. The four series behave differently: a closed bar's value comes from that bar and earlier ones and is not rewritten by later bars, and the forming bar holds a preview until it closes.
The profile starts at the session's first bar and grows to the right, so scroll back until that bar is in view; on a 15 or 30-minute chart the session is 2D and runs for days. A chart holding less than one session shows nothing, because drawing starts at the first session boundary, so raise Days to load in the Data Series dialog. A session at the left edge of the chart draws nothing either, because its first bar was never loaded. On a Daily chart Auto HTF makes every bar its own session, so no profile can form: switch Auto HTF off and set a longer session, such as M. A feed without volume, or closes at or below zero, leaves the profile, POC and channel absent.
Intraday sessions break on UTC multiples: a 240 session at 00:00, 04:00, 08:00, 12:00, 16:00 or 20:00 UTC and a 720 session at 00:00 or 12:00 UTC. For sessions that follow the chart's Trading Hours template, switch Auto HTF off and set Manual Higher Timeframe Session to D or 2D. 2D pairs count from the first session loaded, so changing Days to load can shift them by one trading day.
No. They are labels for up and down bars: a bar that closed above its open counts as buy, one that closed below it as sell, and the whole of that bar's volume goes to that side. The indicator works from bars, not tick data or the order book. Delta is their difference as a percentage of their sum. It describes what those bars did and is not a probability.
Yes, for the levels. SessionHigh, SessionLow, SessionMid and Poc can be read from a NinjaScript strategy and shown as Market Analyzer columns, and they run there with no drawing. A closed bar's value comes from that bar and earlier ones. Poc is unset on the first bar of a session and with Show POC Line or Show Volume Profile off. The profile bins and the label text are not exposed as series, and the indicator places no trades of its own.
NinjaTrader 8.1 Desktop for Windows; the build is tested on 8.1.9.0. Any data connection that delivers bars works, including the free simulation connection.
No. NinjaTrader 8 is free to download and use for charting and simulation, with free real-time futures data for the simulator. A live account with a broker of your choice is a separate step that this indicator does not need. NinjaTrader is the platform it runs inside, not a broker.
No. The licence is tied to your NinjaTrader account login through NinjaTrader's Vendor Licensing, not to a PC. Log in on any installation and the indicator runs; a new PC needs no transfer.
I issue it by hand in the NinjaTrader Vendor Dashboard. It is normally done within a few hours and always within 24 hours of your form arriving, including weekends.
No. It is one payment of 77 USD for a lifetime licence on one NinjaTrader account, with future updates included.
Once the licence has been issued the sale is final, because a licence on your account cannot be handed back. That is why the user guide is public: read it first. If you paid and the licence has not been issued yet, email me and I will refund you in full.
Yes. Email me from the address you bought with and I will move the licence to your new account login.
No indicator can promise that, and this one does not. It gives you a view of how a session's volume sat around its regression on the bars so far. What you do with that, and how you size positions, decides the outcome.
Each one is a compiled NinjaScript Add-On, 77 USD once, with its own page, charts and public user guide.
Swing highs and lows, BOS and CHoCH lines, order blocks, and a buy or sell arrow when a closed bar retests an active block, with an entry, a stop and two targets.
$77 one payment, lifetime licence
An eight-EMA ribbon with crossover signals, a drawn entry, a stop and up to four targets, shaded target and risk zones, a screener of up to nine instruments and a dashboard of five timeframes.
$77 one payment, lifetime licence
Order blocks, fair value gaps, equal highs and lows, liquidity sweeps and previous-period levels, with BUY and SELL plates on closed bars, an entry, a stop, two targets, a dashboard and a scanner.
$77 one payment, lifetime licence
77 USD once. A lifetime licence on your NinjaTrader account, updates included, and the licence issued within 24 hours.


