Order blocks
Each confirmed swing creates one: the high to low of the first opposite candle looking back from the swing. Three stay active per side by default, and the counts are settings.
 NinjaTrader 8 indicator, NinjaScript
Order blocks, fair value gaps, equal highs and lows, sweeps and yesterday's high and low usually mean several tools or a lot of marking up by hand. Smart Liquidity Matrix draws them all from closed bars, prints BUY and SELL plates from one fixed set of rules, and runs those rules on twenty-four timeframes of the chart's instrument. It draws and alerts, and that is all: the stars on its plates are fixed, so it does not grade signals, and it does not mark a line as reached.
$77one payment, lifetime licence
Get the lifetime licence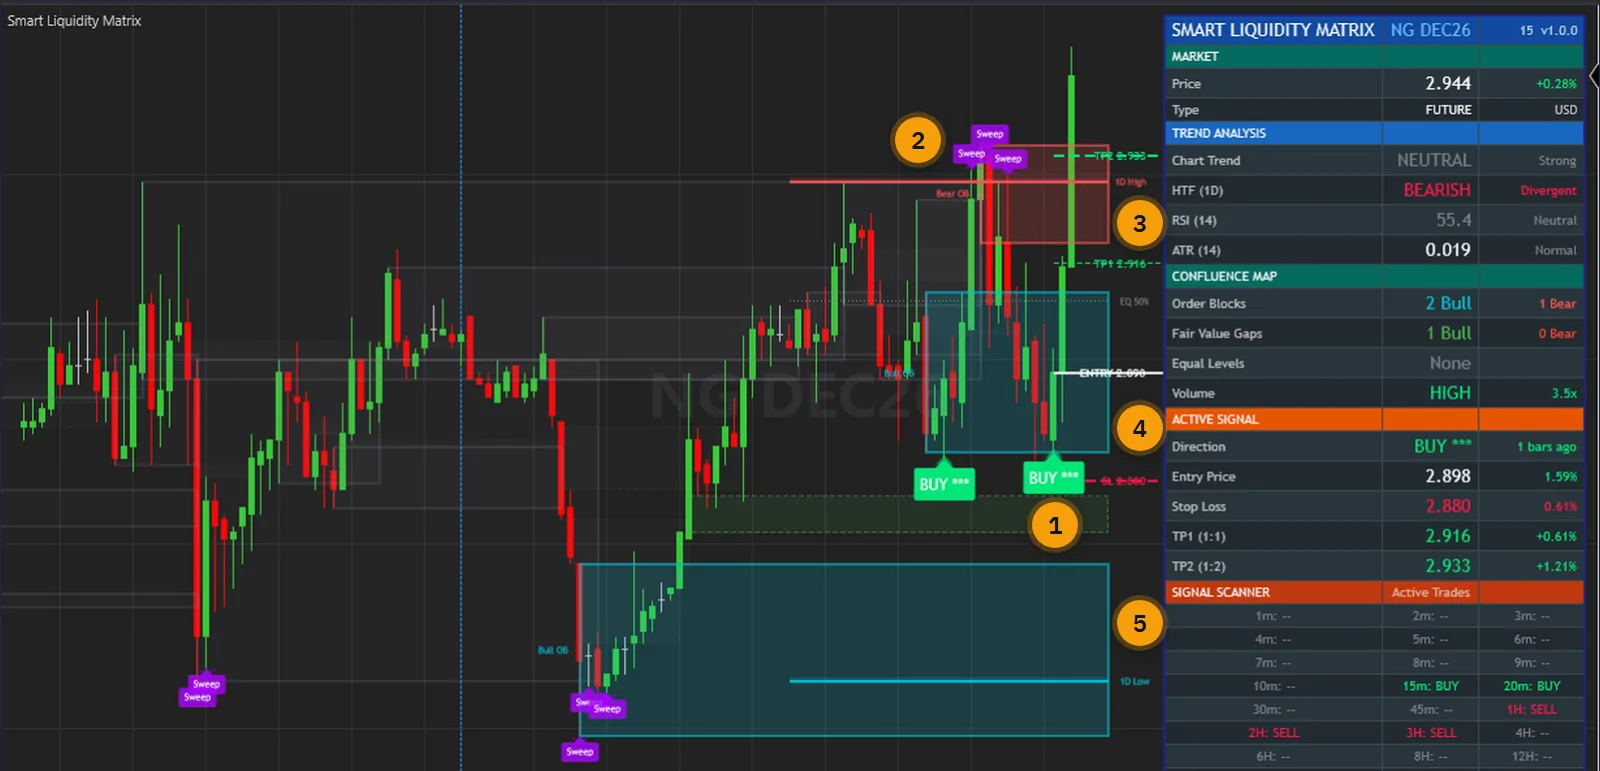
A liquidity chart done by hand means finding the swings, marking the candle behind each one, boxing the gaps, noting which zones a close has gone through and keeping yesterday's high and low in view. It goes stale as soon as the next swing confirms, and it has to be done again on every chart you watch.
Then comes the question of what to do with it. A zone on its own is not a signal, and a sweep on its own is not a plan. The rules for acting on them tend to stay in your head, where they can change from one day to the next.
Smart Liquidity Matrix does the marking on every closed bar with fixed rules, and adds one fixed signal rule with a stop and targets drawn at your settings. You still decide what to trade. The user guide writes the rules out, including what the indicator does not do: the three stars never change, and no break-of-structure line is ever drawn.
The user guide is public: every parameter and the verification are in it. Read it before you pay.
One indicator in the price panel: the zones, the sweeps, the levels, the signals and the dashboard together.
Each confirmed swing creates one: the high to low of the first opposite candle looking back from the swing. Three stay active per side by default, and the counts are settings.
A gap between a bar and the bar two back, green or red with a dashed border. Three stay active per side by default. A count of 0 creates none of that kind.
A purple plate and a small cross when a bar goes through a level and closes back. The level is an equal high or low on that bar, or the previous period's level.
EQH and EQL when the last two swings lie within 0.1 ATR, 1D High and 1D Low from NinjaTrader's own daily series, and an EQ 50 % line between the current swings. Previous Period TF takes other timeframes.
One fixed rule using EMA 20 and 50, a bar closing in the signal's direction, a swing test and RSI 14. The stars are always three: the score is fixed and does not grade a signal.
Drawn for the newest signal and removed when the signal state closes. They are a risk picture at your settings. The state keeps its own stop and target, so the two can differ.
30 rows: market, trend readings, active zones, the active signal and the scanner. About 615 pixels tall at Text Size Normal, about 510 at Small and about 780 at Large. Six positions.
Signals by default, sweeps if you choose, on live bars only and once per kind and bar: the Alerts Log, the Output window, a sound or an email. There is no webhook, and it makes no network call of its own.
Signal, ActiveDirection, ActiveStop, ActiveTp1, ActiveTp2, Sweep, PreviousHigh and PreviousLow are exposed. Calling the indicator from a strategy or the Market Analyzer has not been tested yet.
Every picture below is a NinjaTrader 8 capture with numbered notes added. Nothing on the charts is drawn by hand. Click any image to enlarge it.
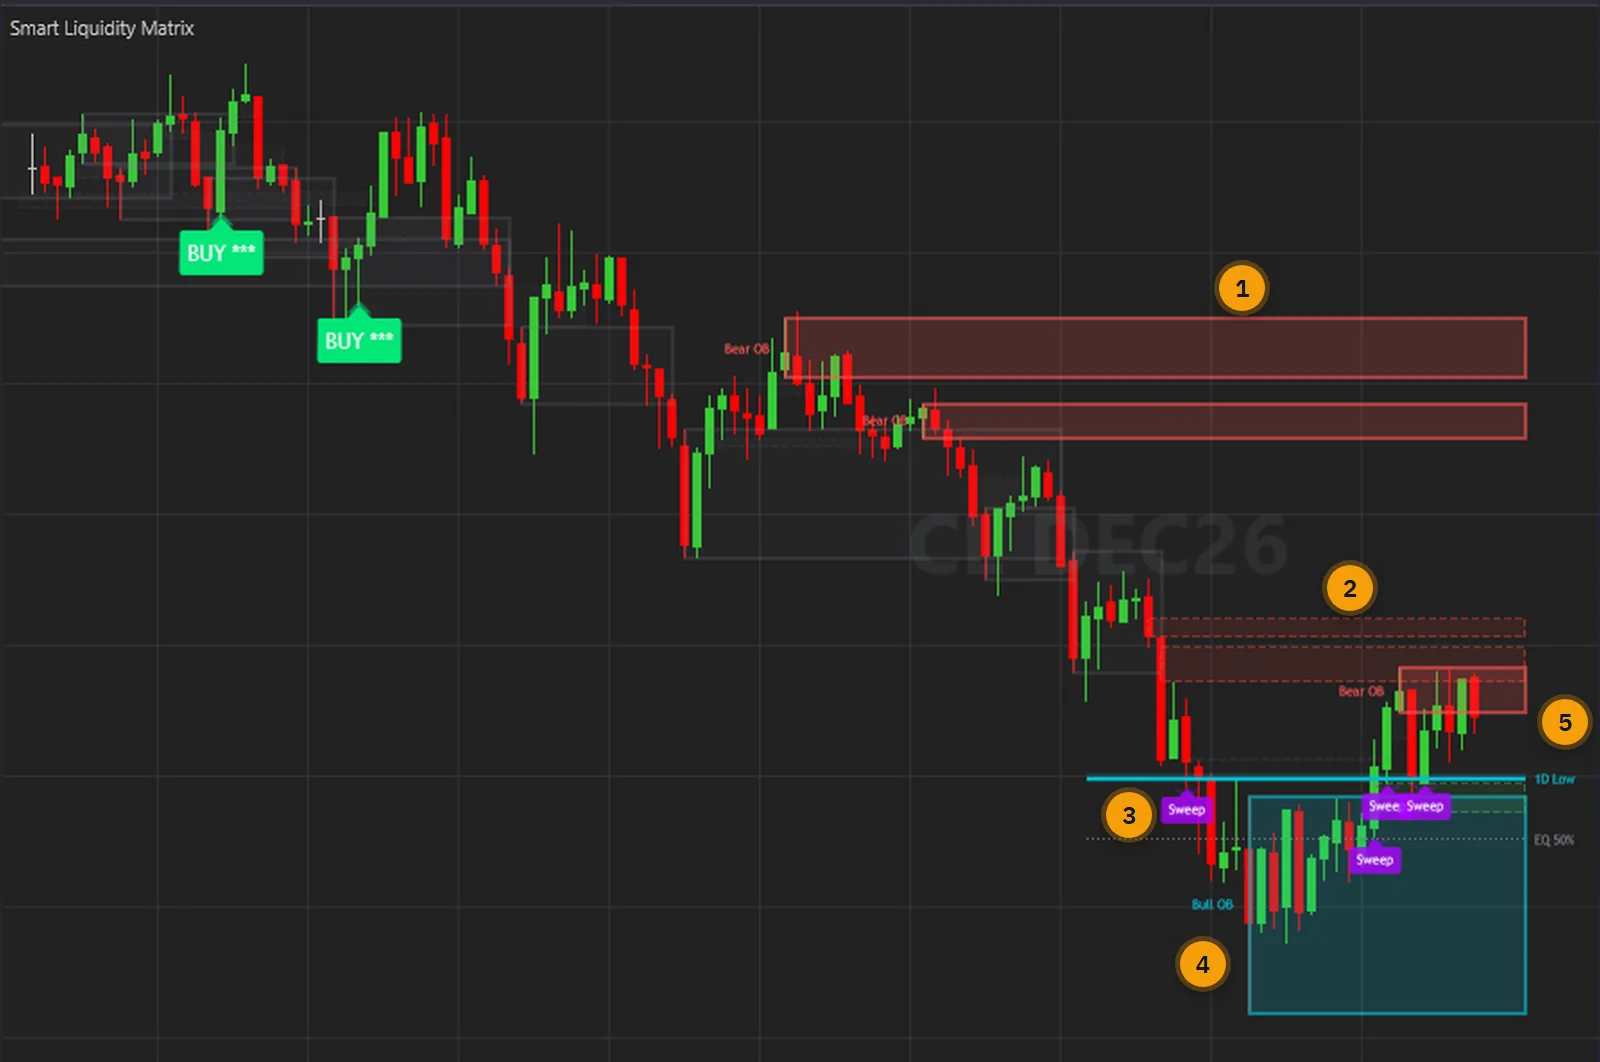
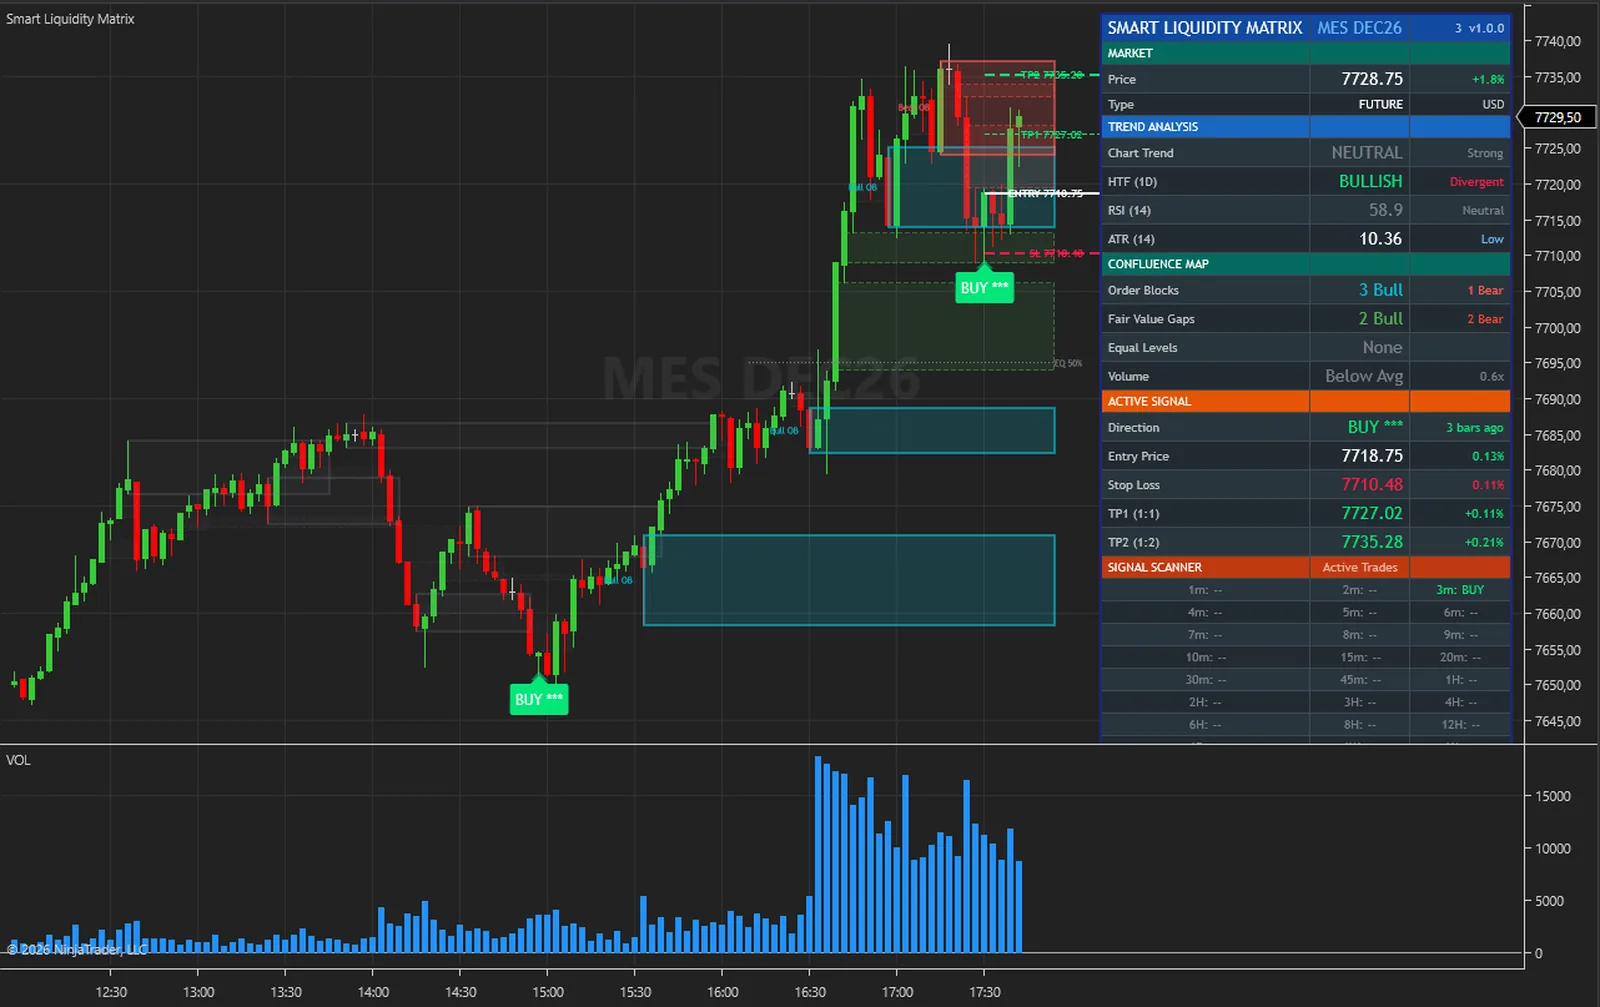
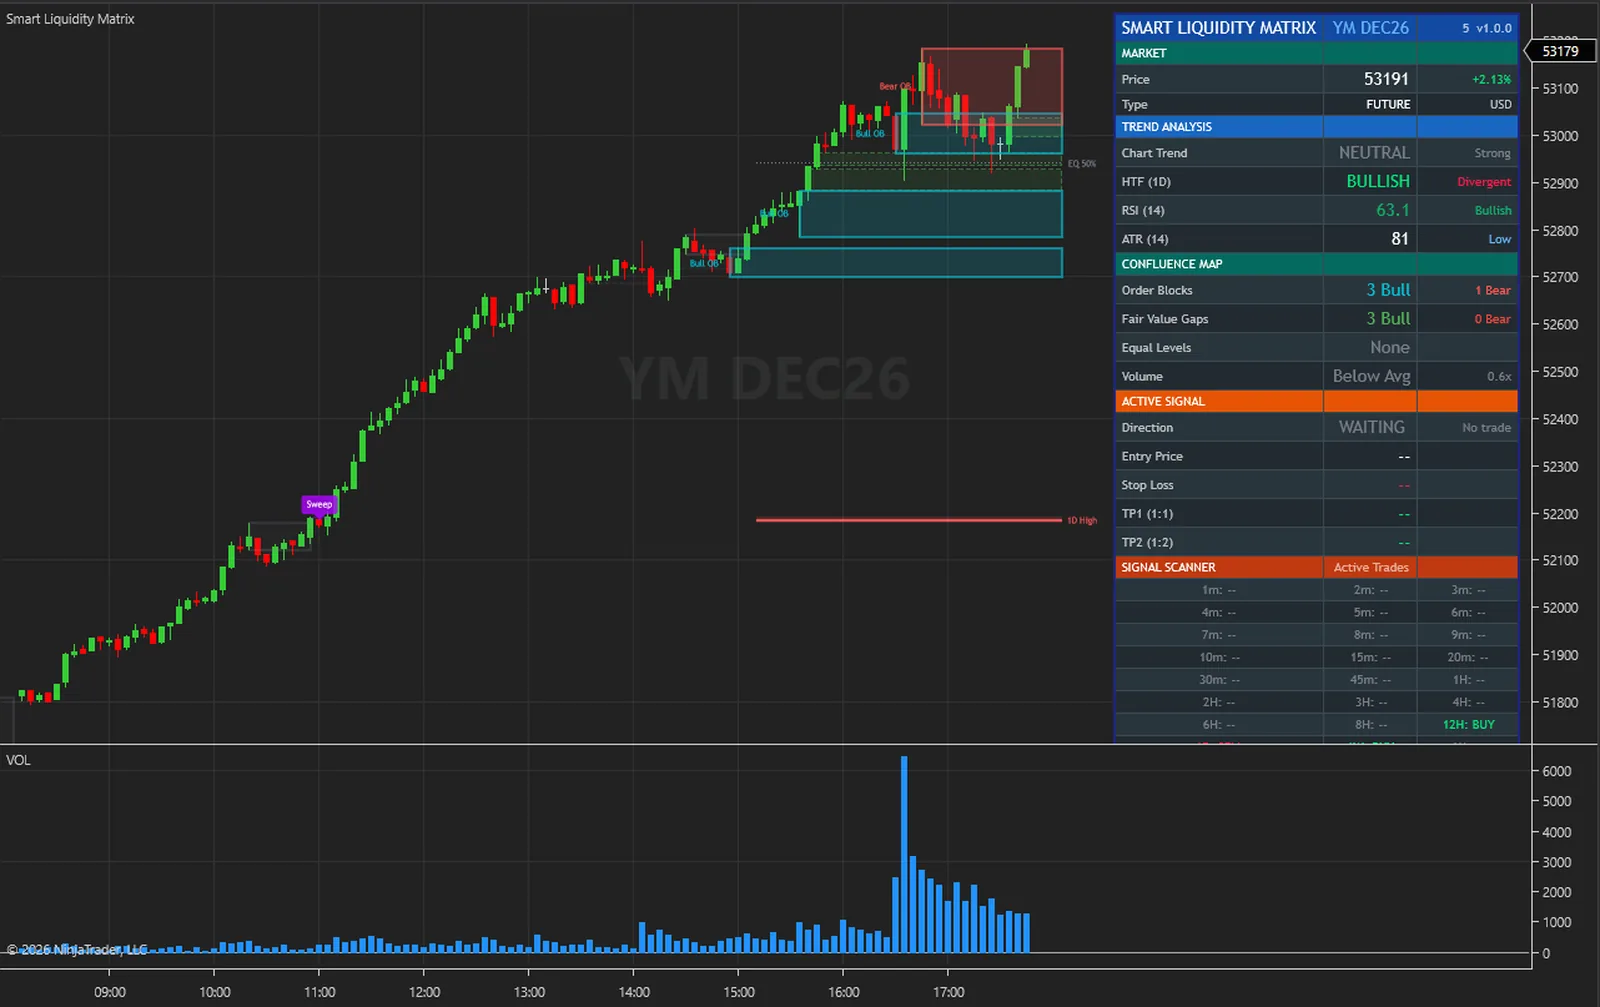
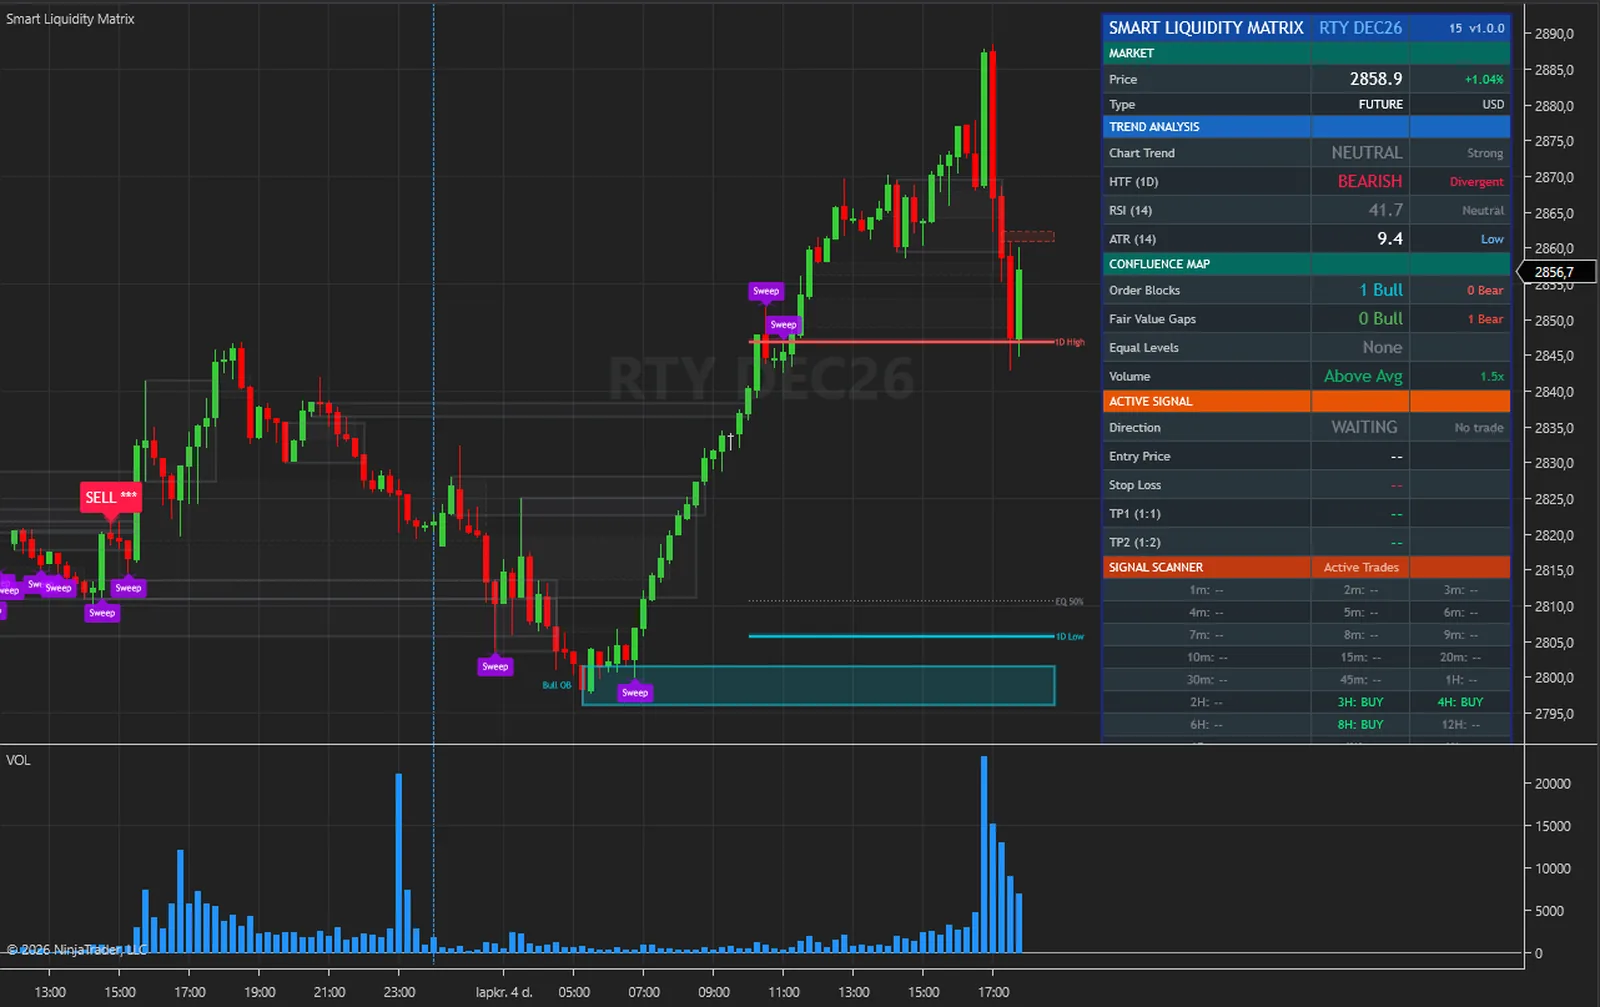
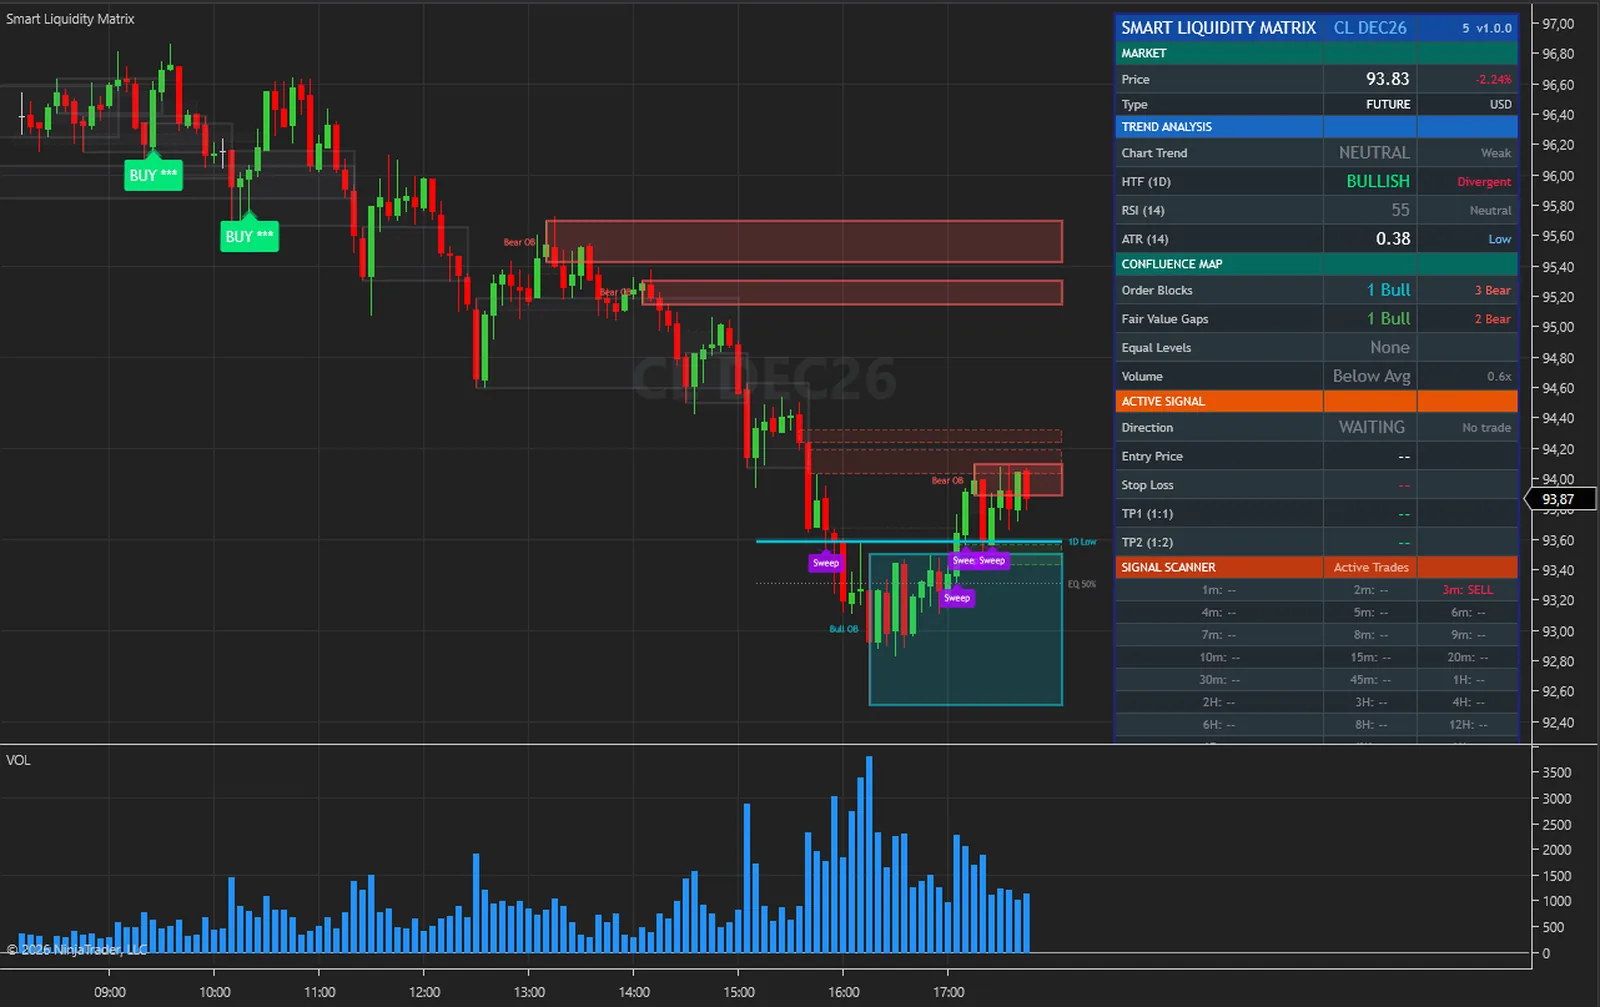
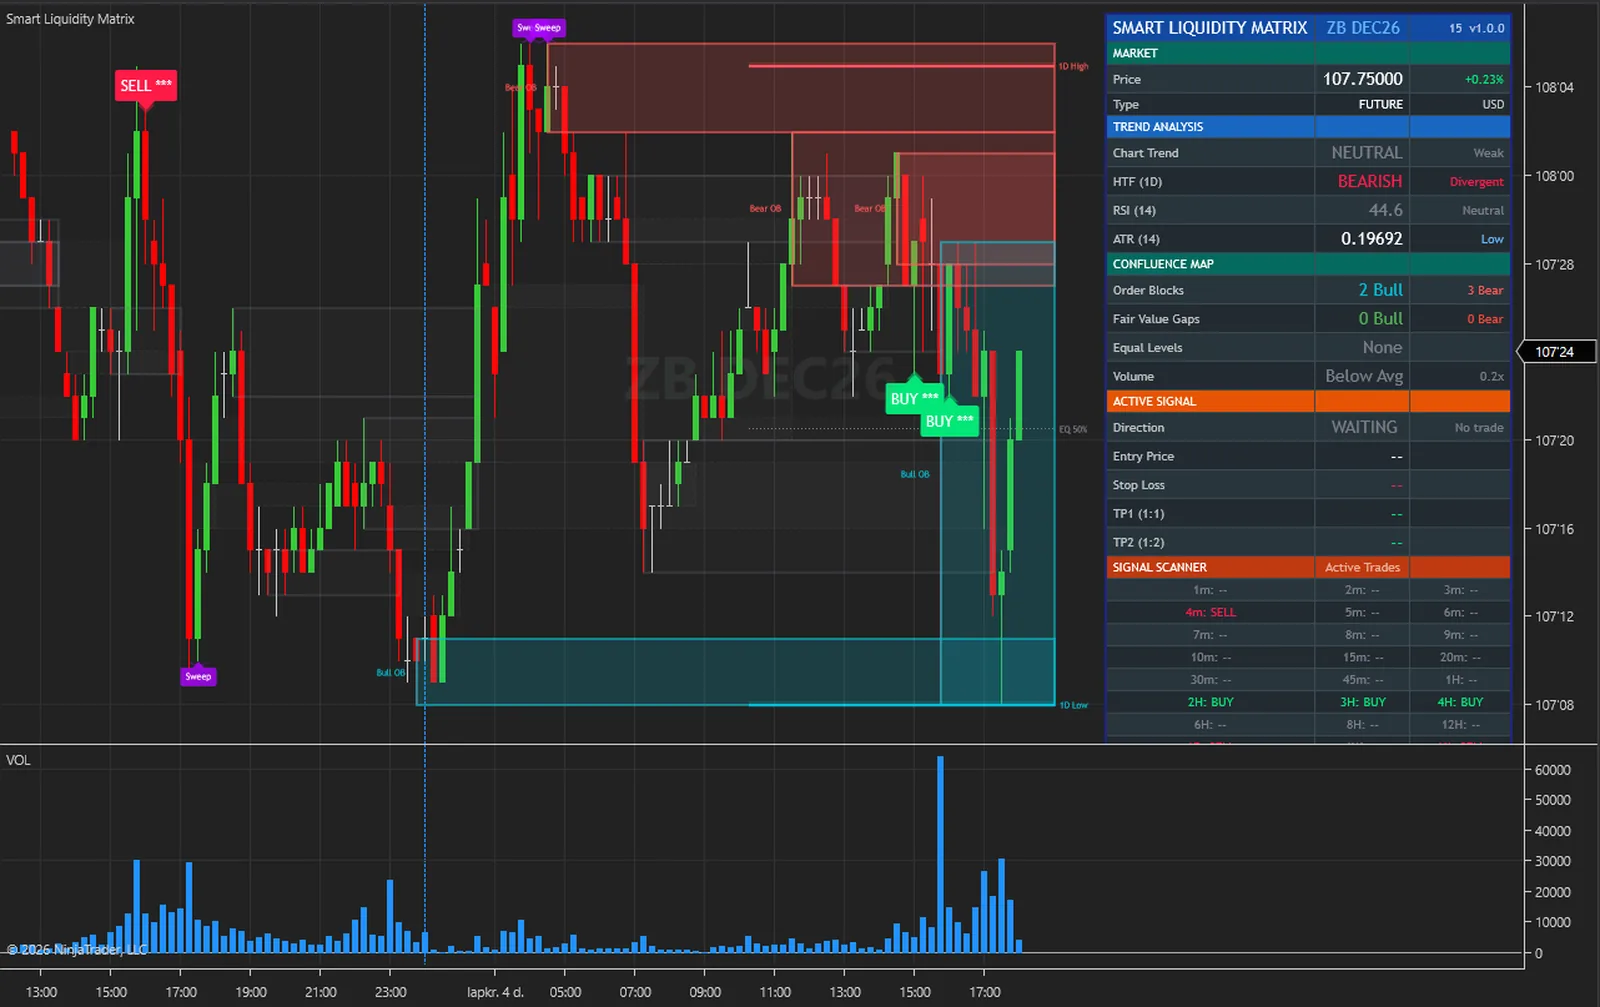
Each kind of zone has its own mark: solid boxes with a Bull OB or Bear OB tag for order blocks, dashed borders for fair value gaps, purple plates for sweeps. A zone that a close has gone through turns grey, stops at that bar, loses its tag and stays on the chart, taking no further part in anything. The faint boxes at the left of this chart are those.
The zones on screen are built from the bars before them, so the amount of history matters. Aim for at least 5,000 bars where your feed allows it. The indicator does not extend the chart's data: Days to load in the Data Series dialog decides, and two charts that loaded different amounts of history can differ for a while.
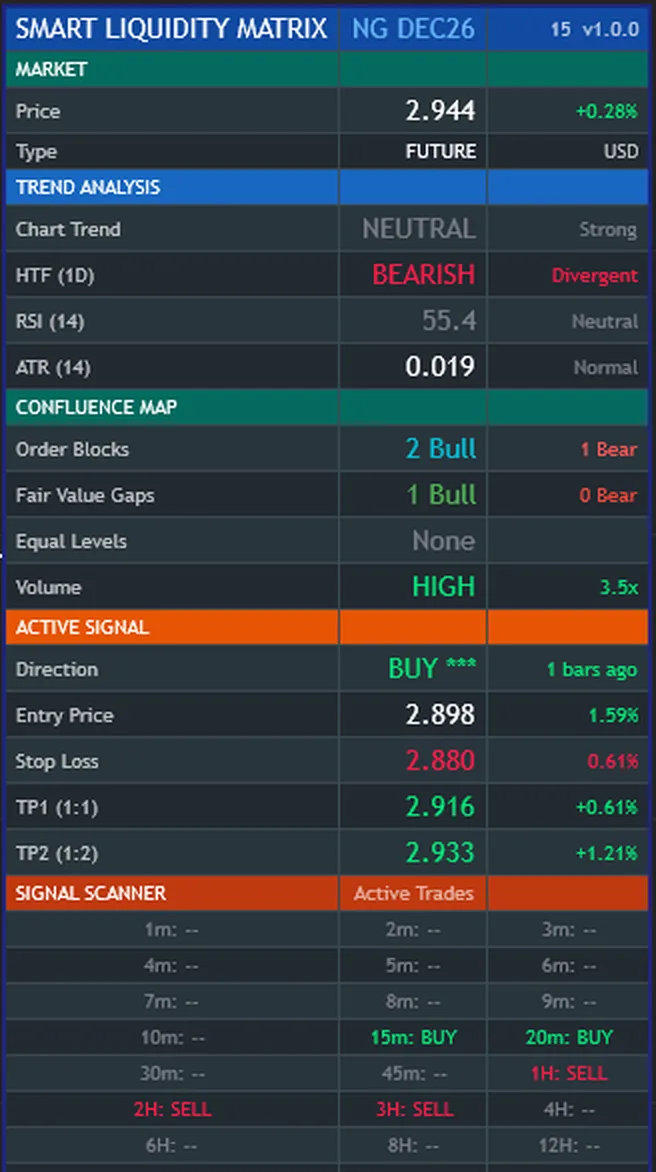
At the default Text Size Normal the dashboard is about 615 pixels tall at 100 % display scaling, plus an 8-pixel margin. That is why its last scanner row is cut off in these pictures: this price panel is shorter than that. Text Size Small brings it to about 510 pixels and Large takes it to about 780, and the sizes grow with the Windows display scaling. The percentages under ACTIVE SIGNAL describe this one signal on this chart. They are not a probability of profit.
Each scanner cell runs the same signal state on that timeframe's own closed bars. A double dash means flat, or a row that has not delivered yet, which needs at least 50 closed bars of its timeframe. At the defaults the scanner adds 24 data series that every tick updates. Scanner Rows Off drops that to the series the levels need, one at the defaults, and leaves every row at a double dash.
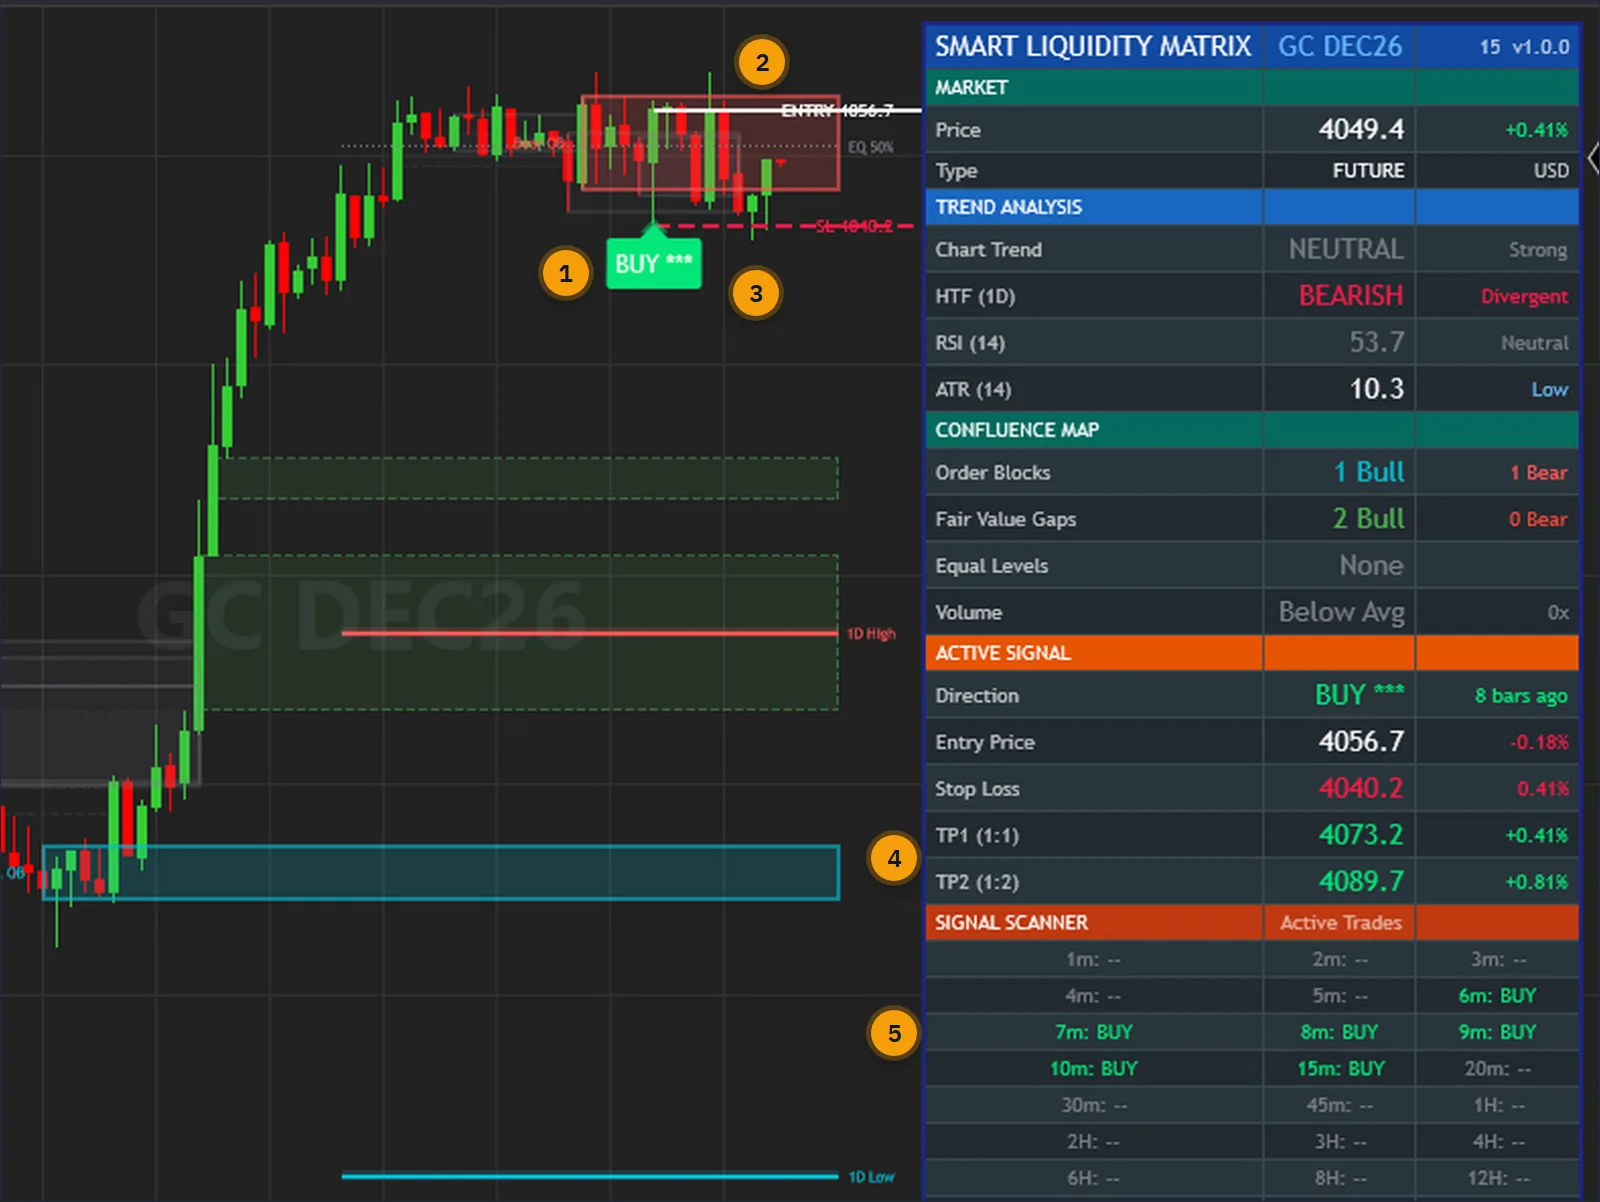
A signal draws a white entry line, a red dashed stop and two green dashed targets, each running 30 bars from the signal bar. Only the newest set exists, and it is removed when the signal state closes. On this chart two wicks went below the drawn stop and the dashboard still reads BUY. That is how it is built: the line sits at the swing minus SL Padding x ATR, and the state closes on its own stop, its 5-bar swing minus 0.5 x ATR.
So a drawn line can be crossed while the dashboard still shows the trade, or the trade can close with its line untouched. The indicator does not mark a line as reached and does not count outcomes, so there is no tally here. A closed state removes its lines, so no chart on this page can show a stop as hit.
The calculations are not tied to an instrument. The captures below were taken in NinjaTrader 8 on the free simulation feed: index, energy, metal, currency and rate futures, from 1-minute to 30-minute bars, with the indicator at its default settings on every one.
Volume takes no part in the signals, zones, sweeps or levels at the defaults, which come from open, high, low and close alone. On a futures chart the dashboard's Volume row sets the newest bar's contract volume against its 20-bar average, and with the default OnBarClose it usually reads below average because that bar has only just started. A continuous contract that is not back-adjusted shows a price jump at the roll, which can produce false zones, a sweep and an oversized ATR for a while.
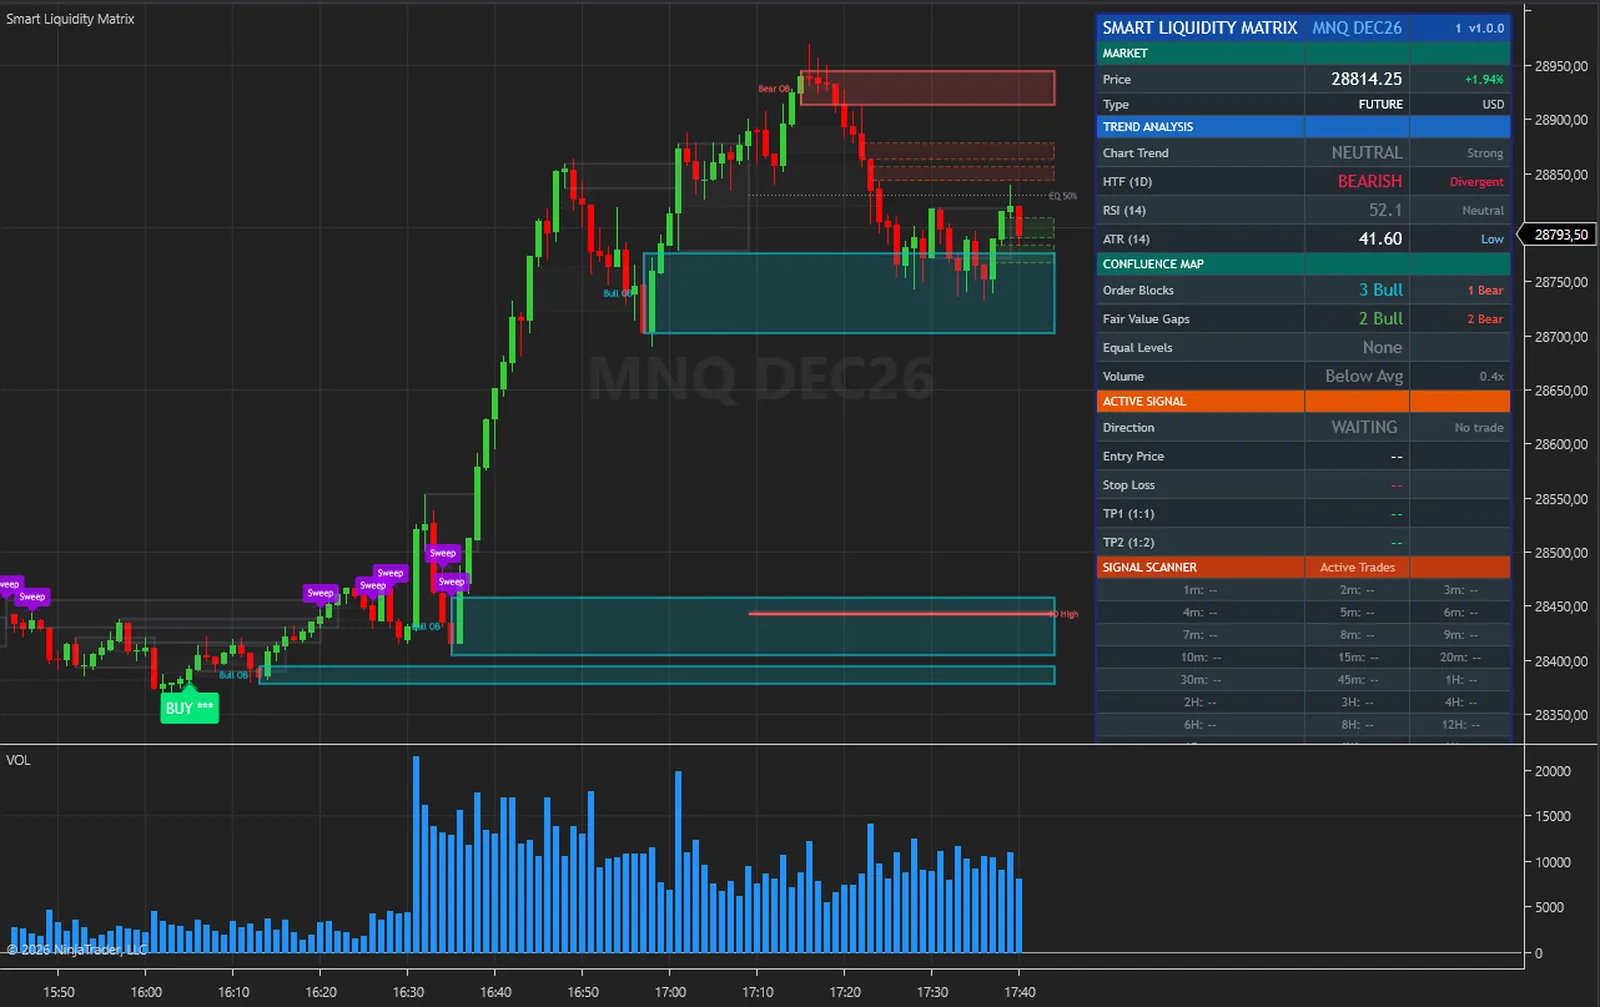
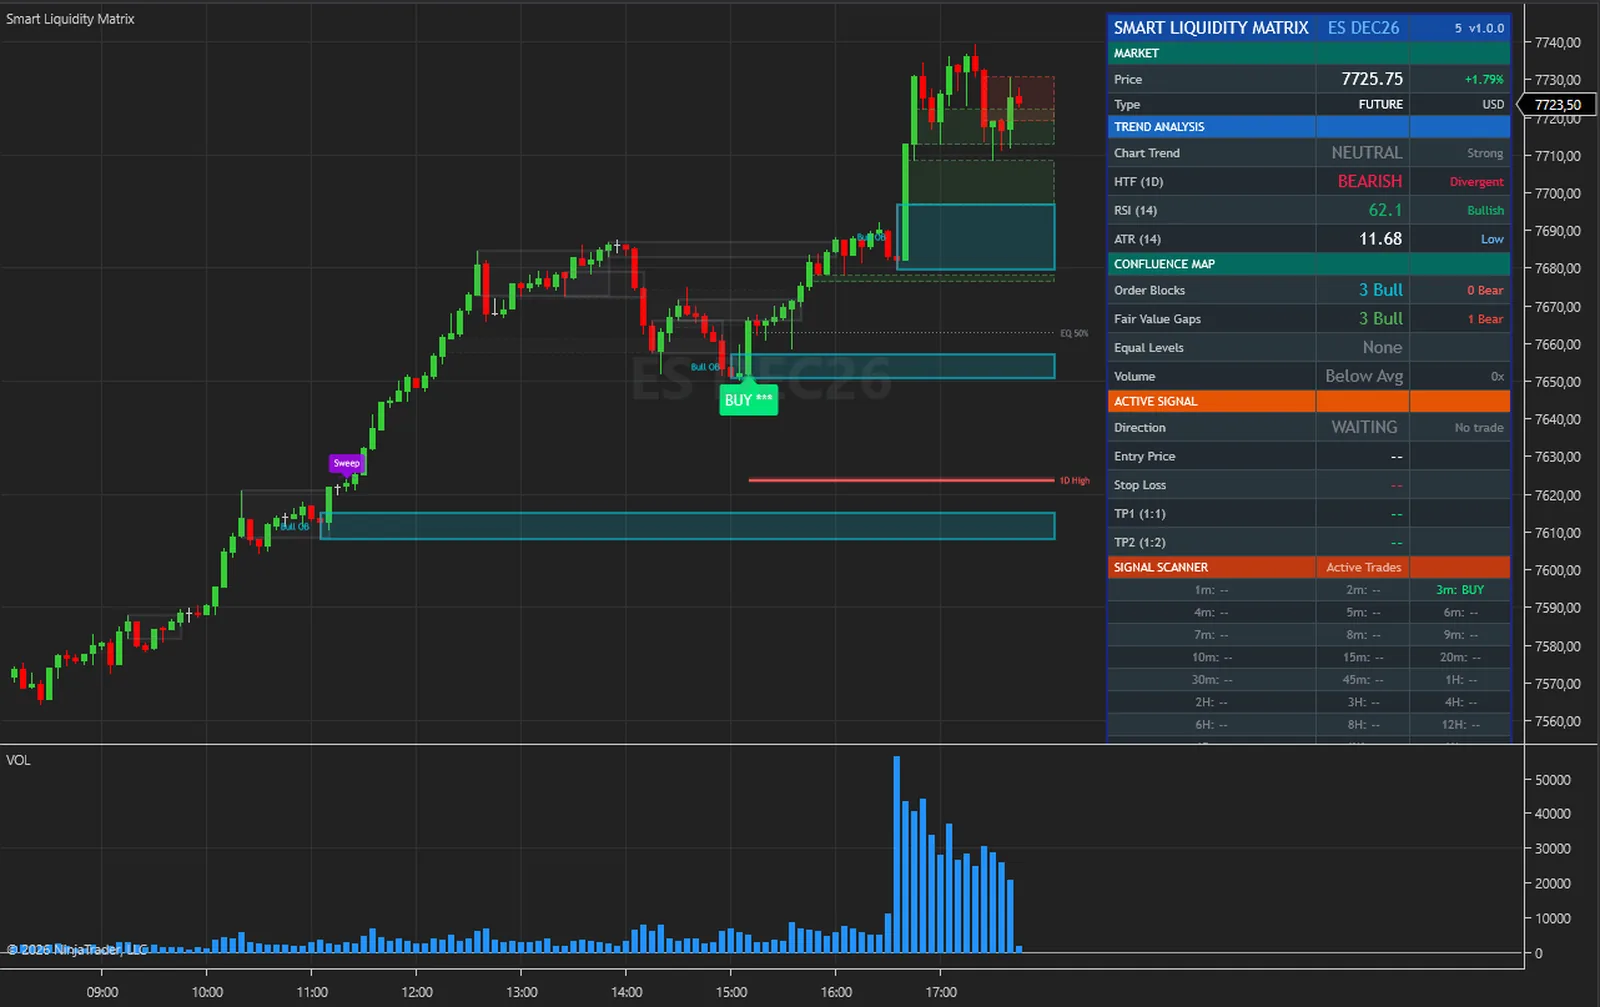
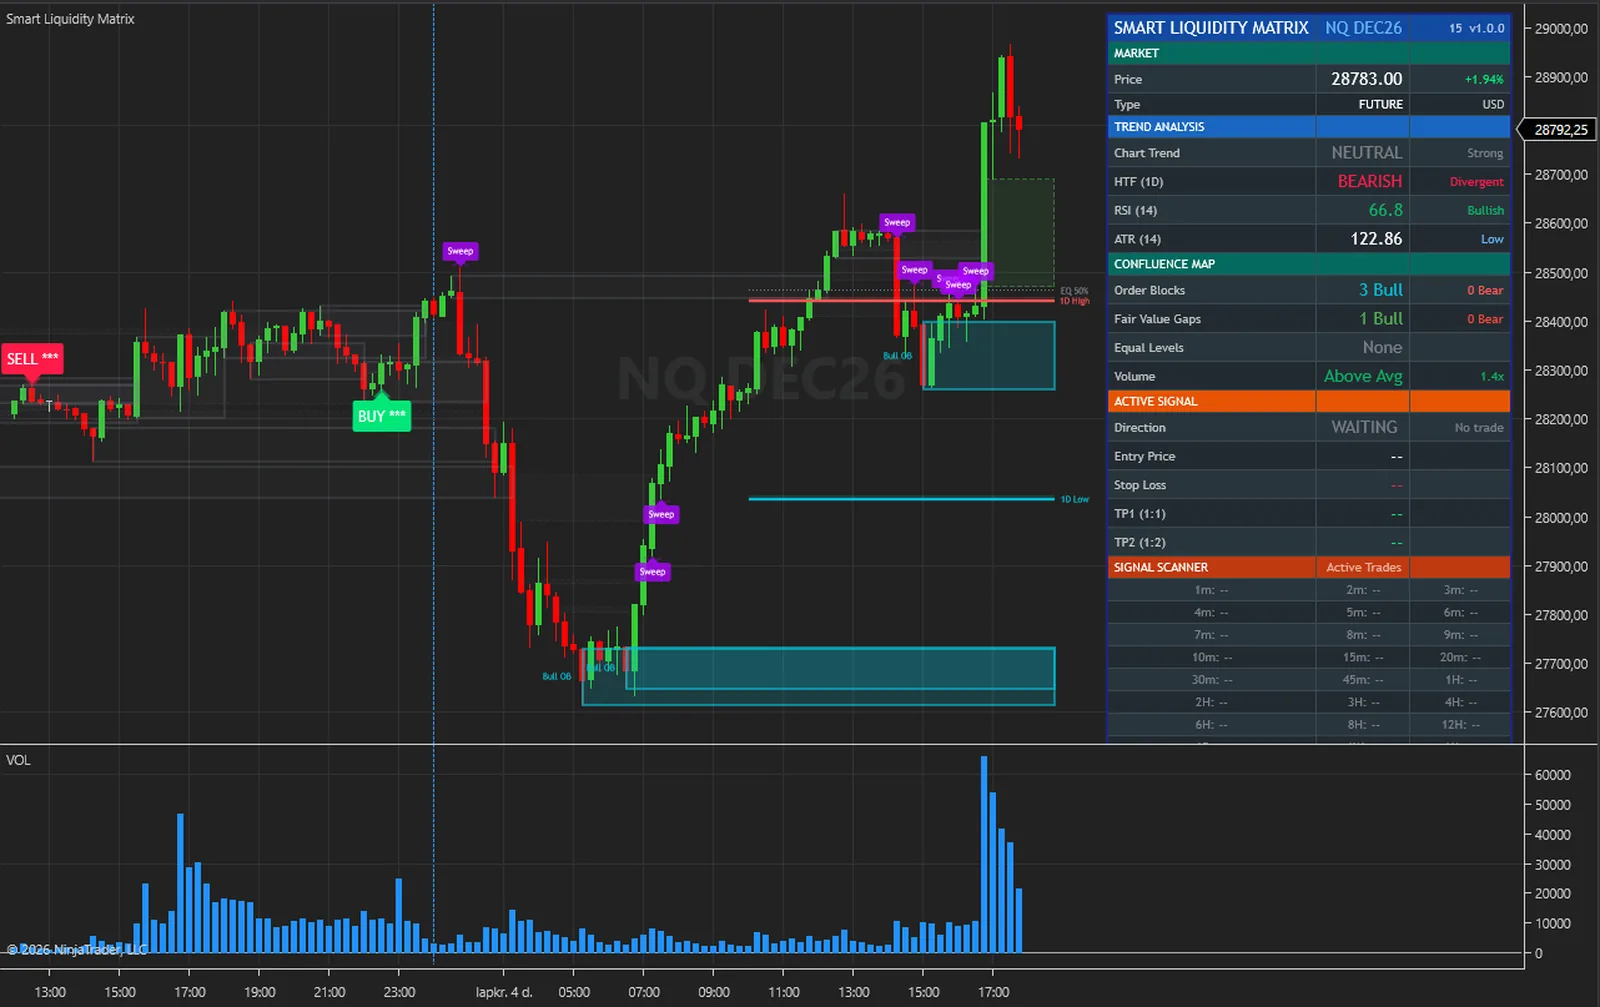
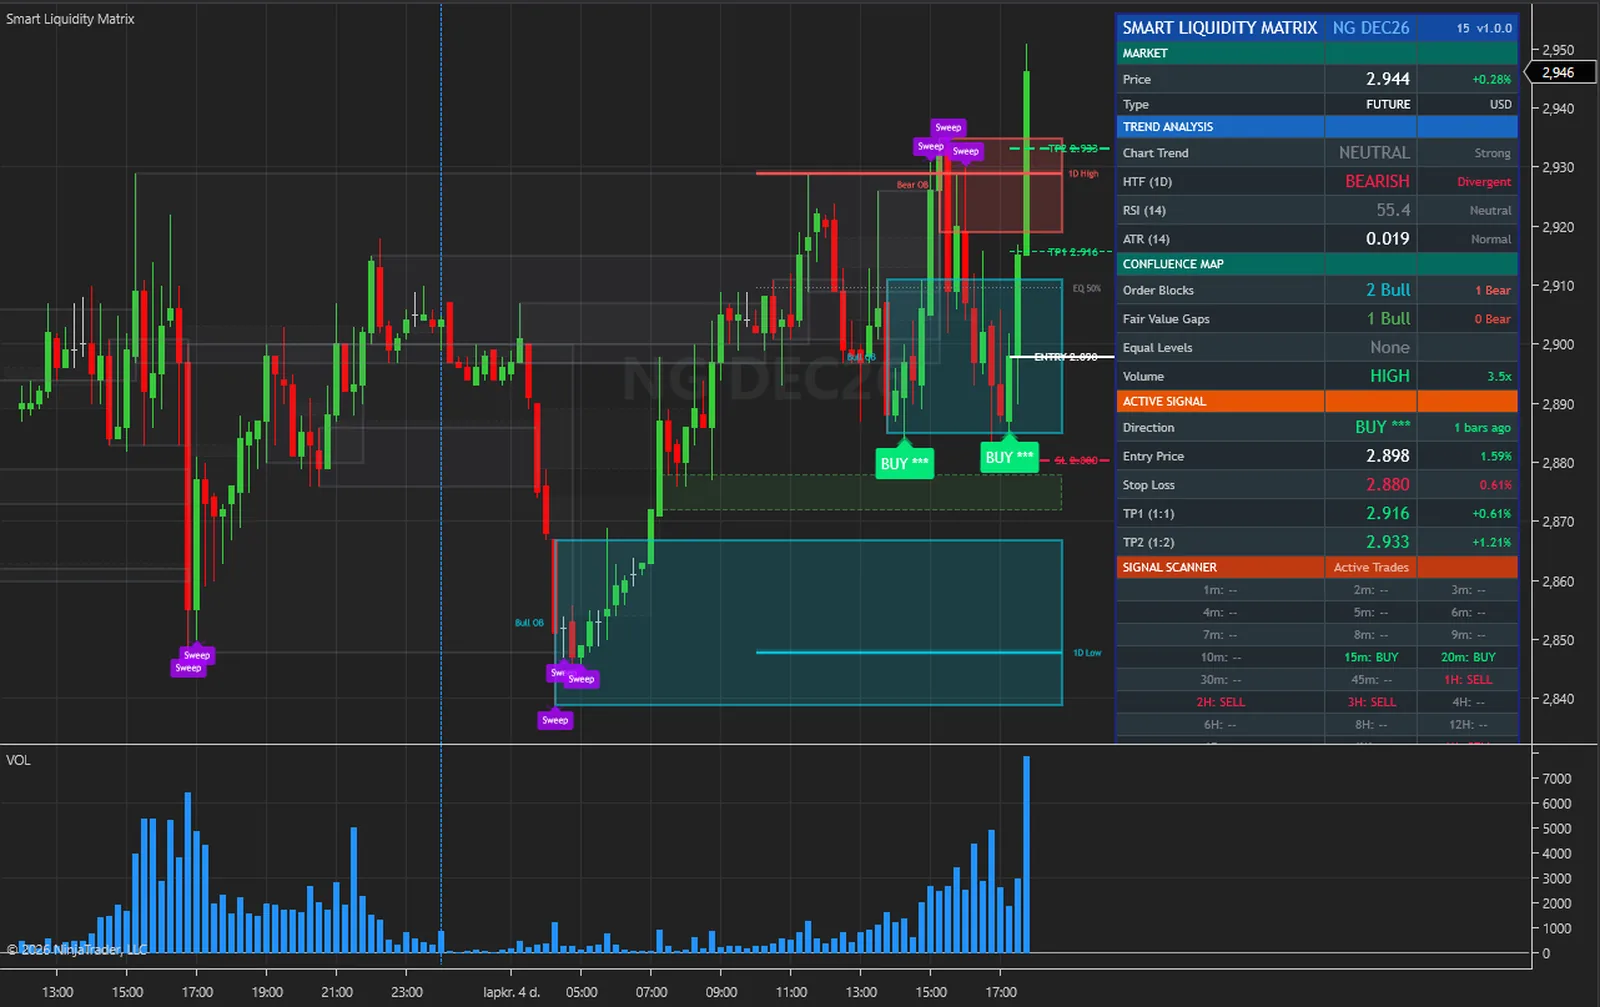
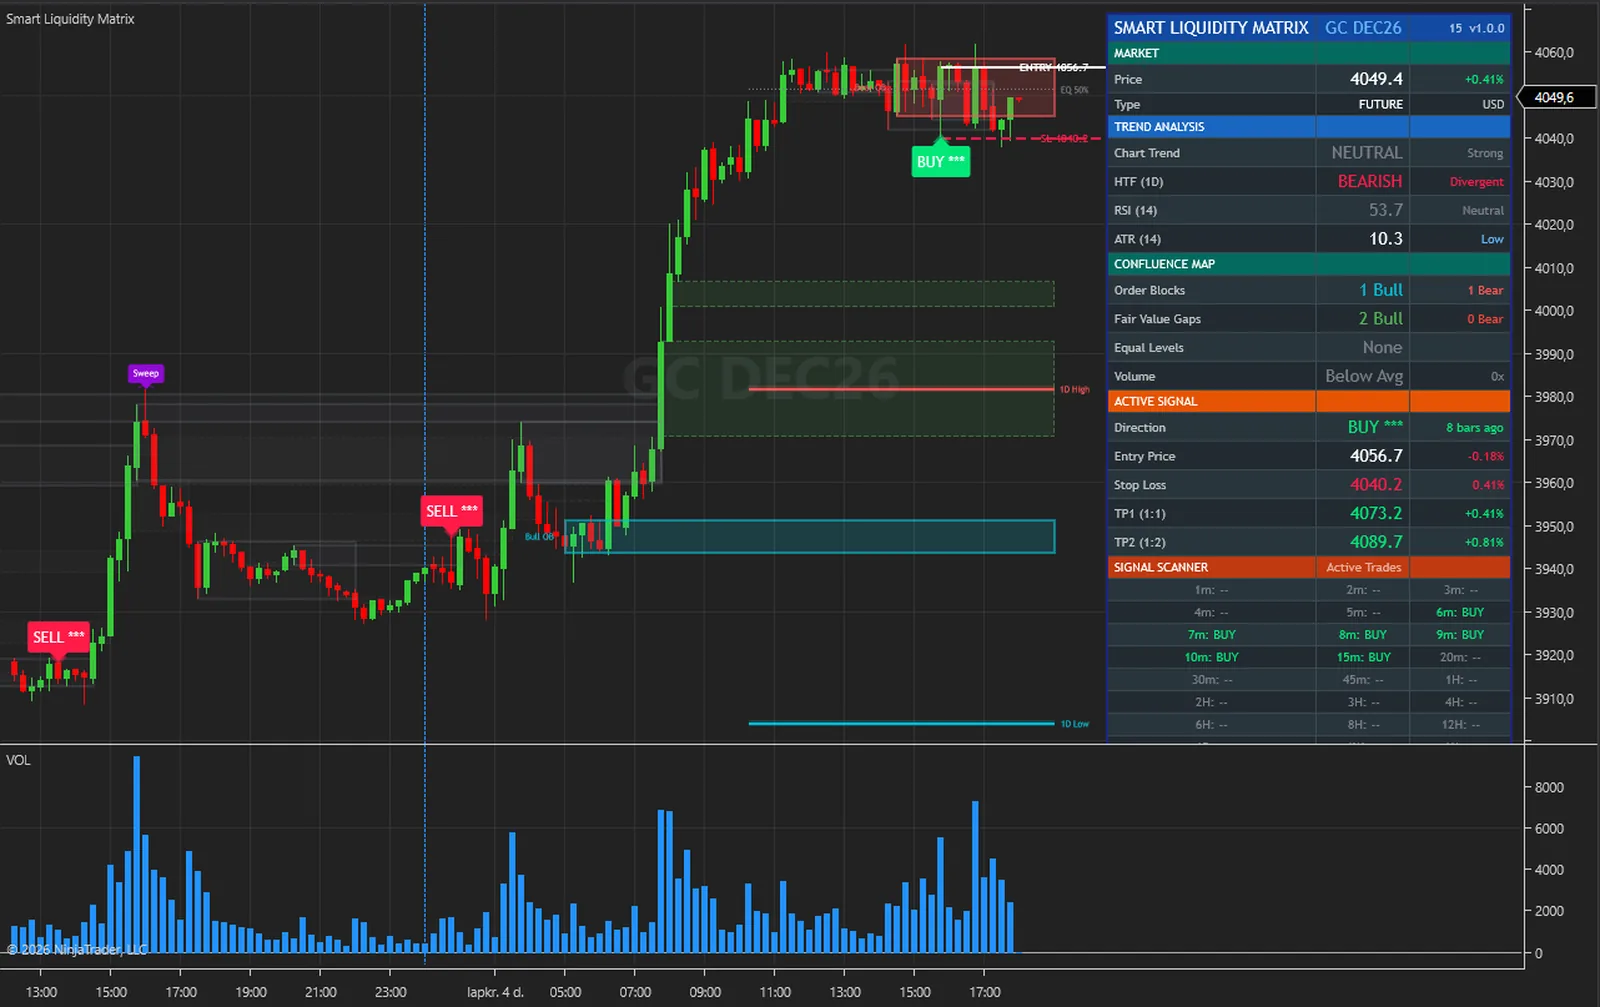
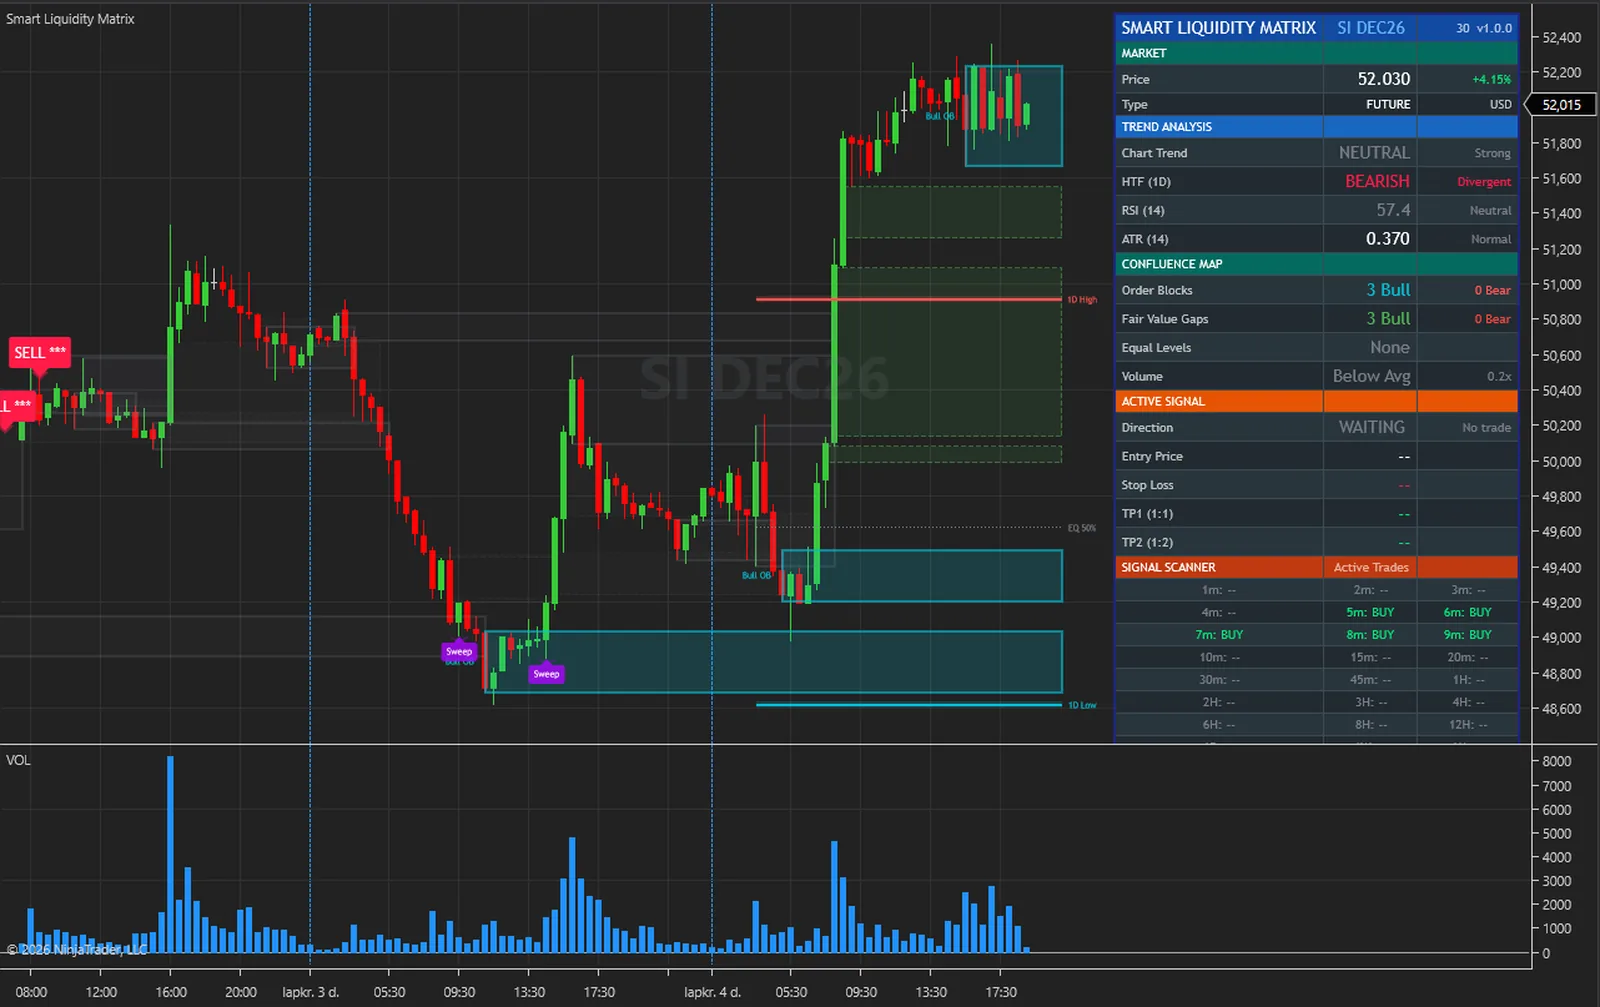
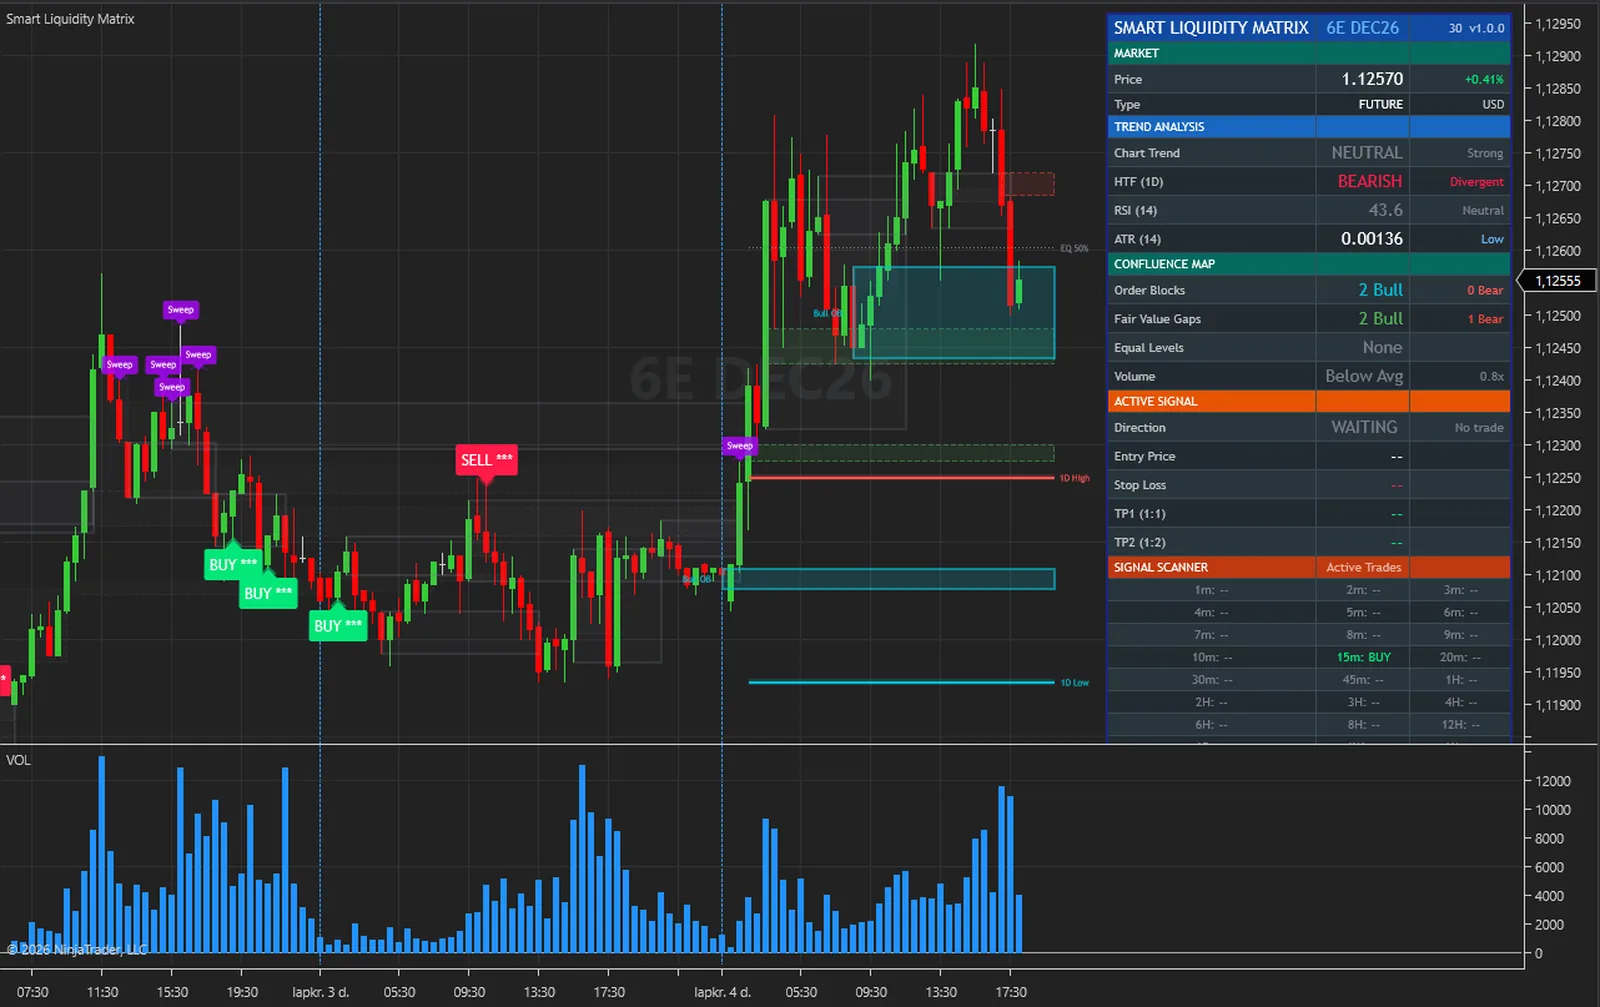
The same steps on every closed bar, in this order. Nothing hidden and nothing exotic.
Only a closed bar is calculated, in every Calculate mode. The per-tick modes refresh the zones' right edge, the level lines and the dashboard, and make no signal earlier.
A swing confirmed Swing Length bars back creates an order block, a gap between a bar and the bar two back creates a fair value gap, and a close through a zone turns it grey.
Equal highs and lows, the previous-period high and low and the equilibrium are set. A bar that went through a level and closed back prints a sweep.
A BUY needs EMA 20 above EMA 50, a bar closing above its open, a low at or below the last 5-bar swing low plus 0.3 x ATR, a close above that swing low and RSI under 70. A SELL mirrors it, with RSI above 30. The exit is tested first.
A plate with its triangle, then the entry, the stop and two targets at your settings. The dashboard and the scanner refresh, and on a live bar the alert fires.
| Plain zone indicator | Smart Liquidity Matrix | |
|---|---|---|
| Zones | Often one kind per tool | Order blocks and fair value gaps together, with counts you set |
| Used zones | You clear them yourself | Turn grey when a close goes through and stay on the chart |
| Sweeps | You spot them | A plate on the closed bar |
| Levels | You draw them | Equal highs and lows, previous-period high and low, EQ 50 % |
| Signals | None | BUY and SELL on closed bars, from fixed rules |
| Stop and targets | You work them out | Drawn for the newest signal, at your settings |
| Other timeframes | One chart at a time | Twenty-four scanner rows of the same instrument |
The engine that computes everything also runs outside NinjaTrader. With its diagnostic dump switched on, the NinjaTrader edition writes every committed bar with the values it drew; those bars are replayed through the engine outside the platform, and the two files are compared value by value.
On 4,923 MNQ 1-minute bars every one of the 70 series compared was equal on every bar. A second run, with Calculate set to each tick and the chart left live across the switch from history to live bars, gave the same result on 4,191 bars.
What that proves: the indicator receives exactly one closed bar per chart bar with the right open, high, low, close and volume, never double-feeds or skips a bar, and shows the values the engine produced. What it does not claim: it is a test of correct calculation, not of trading results, and it says nothing about future performance.
The full method is in the user guide: User Guide (PDF) and Installation and Quick Start (PDF).
No subscription and no renewal. Pay once and the indicator stays licensed to your NinjaTrader account, updates included.
Smart Liquidity MatrixNinjaTrader 8 indicator
$77one payment, lifetime licence
The licence is issued to your NinjaTrader account through NinjaTrader's Vendor Licensing, by hand, normally within a few hours and always within 24 hours of your form arriving. You get an email with the download link when it is done.
Because a licence cannot be handed back once it is on your account, a sale is final once the licence has been issued. If you paid and the licence has not been issued yet, email me and I will refund you in full. The user guide is public, so you can read exactly what the indicator does before you pay.
The full terms of sale and the privacy notice for buyers are one page each, in plain language.
Trading carries risk of loss. This is an analysis tool, not financial advice, and no indicator can promise a profit.
A BUY, a SELL, a sweep or a zone's creation is decided on a closed bar and does not change afterwards. What moves on the newest bars by design: an active zone's right edge, which sits five bars past the last bar; the equal-level, previous-period and equilibrium lines, which exist only for the newest state; the dashboard and the scanner. A swing is confirmed Swing Length bars after its own bar, and the signal state's own swing five bars after. That is a delay, and what it allows can only happen after the confirmation. The forming bar is not fed to the calculation in any Calculate mode, and a signal on a session's final bar appears after the reopen, at the next bar's first tick.
The score is fixed in the calculation, so every signal reads three stars and Score: 3/5. The structure-break events exist in the calculation and do not fire: 0 events on the 4,923 bars of the verification run. So Show Break of Structure, Show Change of Character and Max Structure Lines have no visible effect, no candle is tinted, Chart Trend always reads NEUTRAL and the HTF row reads Divergent beside its reading. The signals, zones, sweeps and levels do not depend on them. Minimum Confluence Score and Signal Cooldown do not filter a signal either. The working filters are in 13 Signal Filters, off by default: a cooldown, a higher-timeframe filter and a score filter.
The drawn levels are not the levels that close the signal state. The drawn stop uses Swing Length and SL Padding, 0.2 x ATR by default. The state always uses a 5-bar swing and 0.5 x ATR, and its target is its entry plus 2 x risk. So a drawn line can be crossed with the trade still open, or the trade can close with its line untouched. Treat the lines as a risk picture at your settings. The ActiveStop, ActiveTp1 and ActiveTp2 series carry the drawn levels too.
Set 10 Dashboard, Text Size to Small, about 510 pixels instead of about 615 at Normal, or give the price panel more height. Large is about 780. The sizes grow with the Windows display scaling, and a 590-pixel price panel at Normal cuts off the last scanner rows. Position offers six places on the chart.
Aim for at least 5,000 chart bars where your feed allows it. Days to load in the Data Series dialog is where you raise them. Each scanner row loads its own bars, Scanner Warm-up Bars plus 50, which is 650 by default, with 1W at most 520 and 1M at most 240, and a row needs at least 50 closed bars before it delivers. At the defaults every tick updates 24 more data series: use Scanner Rows Off on a slow PC. The verification run used overnight hours. A chart on an RTH template has not been tested, so its levels and scanner rows may follow the instrument's default template.
NinjaTrader 8.1 Desktop for Windows; the build is tested on 8.1.9.0. Any data connection that delivers bars works, including the free simulation connection.
No. NinjaTrader 8 is free to download and use for charting and simulation, with free real-time futures data for the simulator. A live account with a broker of your choice is a separate step that this indicator does not need. NinjaTrader is the platform it runs inside, not a broker.
No. The licence is tied to your NinjaTrader account login through NinjaTrader's Vendor Licensing, not to a PC. Log in on any installation and the indicator runs; a new PC needs no transfer.
I issue it by hand in the NinjaTrader Vendor Dashboard. It is normally done within a few hours and always within 24 hours of your form arriving, including weekends.
No. It is one payment of 77 USD for a lifetime licence on one NinjaTrader account, with future updates included.
Once the licence has been issued the sale is final, because a licence on your account cannot be handed back. That is why the user guide is public: read it first. If you paid and the licence has not been issued yet, email me and I will refund you in full.
Yes. Email me from the address you bought with and I will move the licence to your new account login.
No indicator can promise that, and this one does not. It gives you zones, sweeps and levels drawn from closed bars, and a signal with a stop and targets to plan around. What you do with that, and how you size positions, decides the outcome.
Each one is a compiled NinjaScript Add-On, 77 USD once, with its own page, charts and public user guide.
EMA-cross signals scored on six layers and rated in stars, with an entry line, a stop and three targets for the latest signal, an EMA ribbon, a session VWAP, a dashboard and alerts.
$77 one payment, lifetime licence
Three lines from a rolling window of highs and lows, signals on closed bars, one tracked trade with a stop, up to four targets and a break-even ladder, and a dashboard.
$77 one payment, lifetime licence
An Ichimoku cloud whose periods can scale with volatility, five signal families on closed bars, a confluence score, a stop, three targets and a dashboard.
$77 one payment, lifetime licence
77 USD once. A lifetime licence on your NinjaTrader account, updates included, and the licence issued within 24 hours.


