Rolling thresholds
The two yellow lines sit 23.6 % and 78.6 % of the range below the high of the last 44 bars. There is nothing to draw and no swing to pick.
 NinjaTrader 8 indicator, NinjaScript
A Fibonacci retracement starts with a swing you pick by hand. Flux Gate Precision measures the last 44 bars instead, on every bar, and draws three lines from that window: an upper threshold, a 50 % mid line and a lower threshold. A close beyond the mid line and a threshold, while the trend is not already in that direction, is a signal. Each signal opens one tracked trade with a stop, up to four targets and a break-even ladder, and the dashboard says what happened to it.
$77one payment, lifetime licence
Get the lifetime licence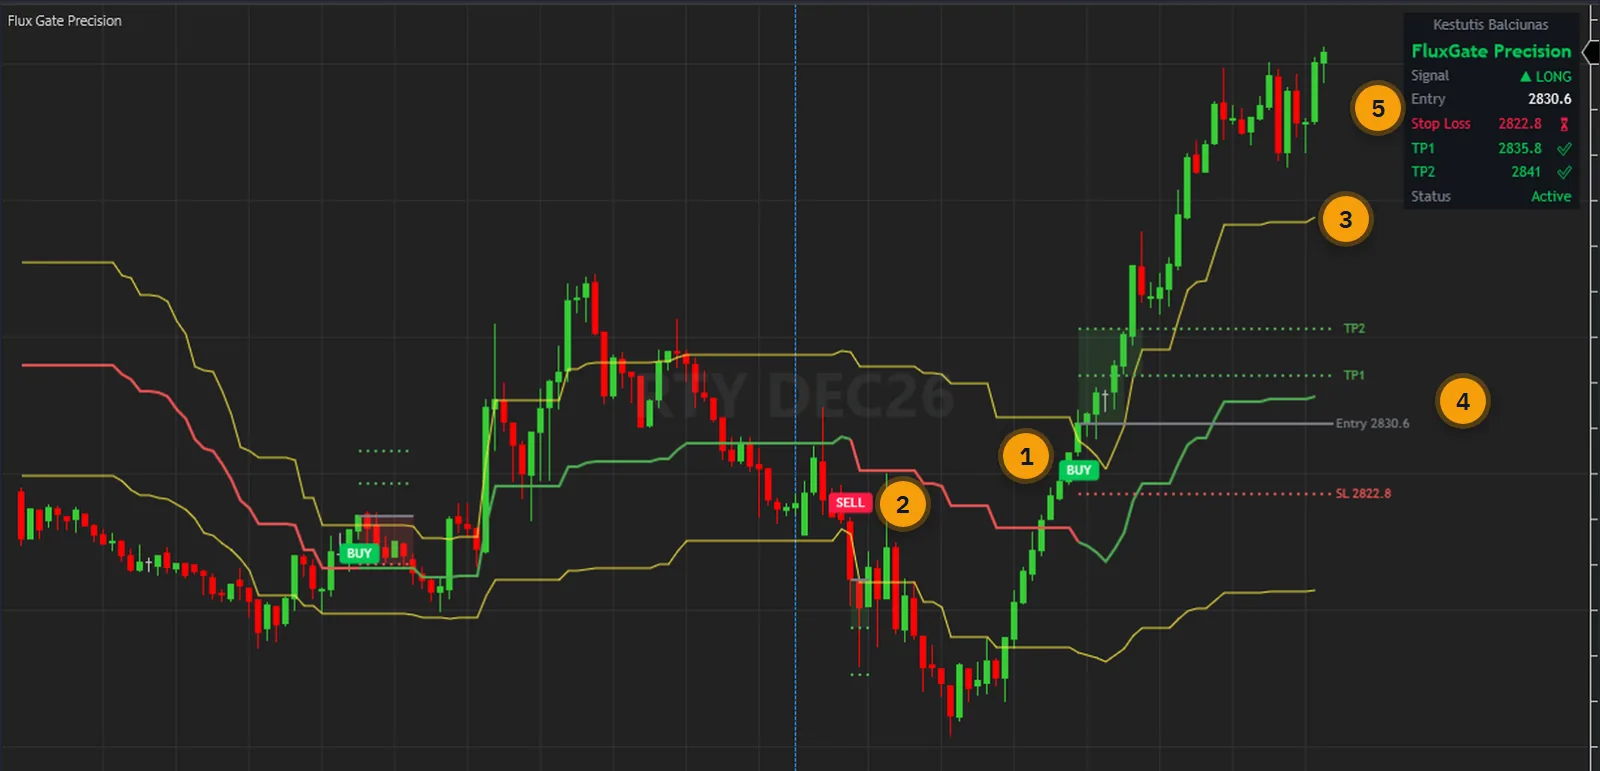
A Fibonacci retracement needs two points, and you choose them. Choose a different swing and every level moves. The tool does not say what a close through a level means or what to do next, and the levels stay where you left them until you redraw them.
Flux Gate Precision takes the choice away. It uses a rolling window of highs and lows, 44 bars by default, and measures its thresholds down from the window's high. The rule is the same on every bar. A close at or above both the mid line and the upper threshold, with the trend not already long, is a long signal. A close at or below both the mid line and the lower threshold, with the trend not already short, is a short.
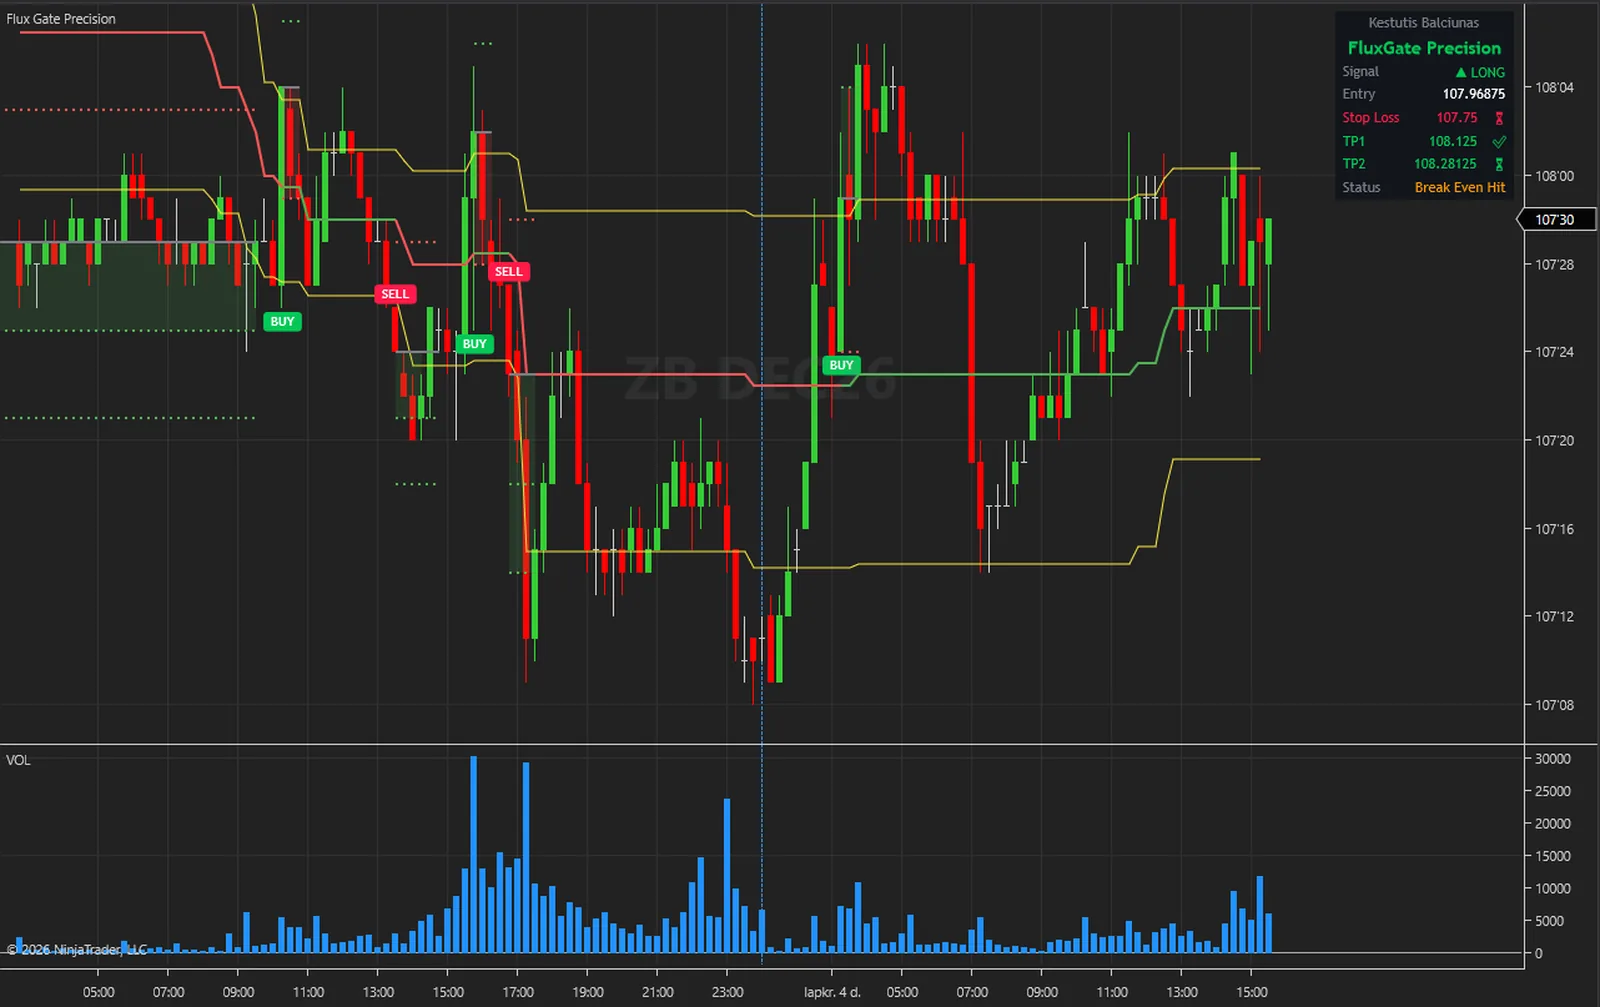
That rule is patient. Because a new signal needs the trend not to be in that direction already, a long run can carry a single signal: the ES 5-minute capture further down shows one BUY in the whole stretch in view. In a quiet range the next one can take a long while. Fib382 and Fib618 sit closer to the mid line and allow more signals, if that is what you want.
The user guide is public: every parameter and the verification are in it. Read it before you pay.
One indicator in the price panel: the thresholds, the signals, the levels and the dashboard together.
The two yellow lines sit 23.6 % and 78.6 % of the range below the high of the last 44 bars. There is nothing to draw and no swing to pick.
The 50 % line is green while the trend is long and red otherwise. A new signal needs the trend not to be in that direction already.
Fib382 and Fib618 sit closer to the mid line and allow more signals. A longer Analysis Window gives wider thresholds and fewer signals.
ATR multiples by default: stop 1.5, TP1 1, TP2 2. Or fixed percentages of the entry. TP3 and TP4 are off until you give them a multiplier above 0.
Reaching TP1 moves the exit to the entry, TP2 moves it to TP1 and TP3 moves it to TP2. Switch it off and only the stop, TP4 or a trend change closes the trade.
One trade at a time, and its stop and targets do not move once it has opened. When it closes the lines and light bands stay, stopped-out trades included.
7 to 10 rows: the signal, the entry, the stop and targets with a glyph for reached or not, and Status: Active, All TPs Hit, Stopped Out, Break Even Hit or Trend Change.
BUY, SELL, TP1 to TP4, Stop Loss and Break Even, each with its own switch. Alerts Log and NinjaScript Output, with sound and email optional. No webhook.
Both threshold lines, the mid line in its two colours and a hidden Signal series at +1 or -1 can be read by a NinjaScript strategy and shown as Market Analyzer columns.
Every picture below is a NinjaTrader 8 capture with numbered notes added. Nothing on the charts is drawn by hand. Click any image to enlarge it.
A long needs a close at or above both the mid line and the upper threshold. A short needs a close at or below both the mid line and the lower threshold. In both cases the trend must not already be in that direction, which is why BUY and SELL arrive in turn on a chart like this one, and why a strong run can go a long way with no new marker.
The markers and levels come from closed bars. With Calculate set to each tick or on price change the three lines follow the forming bar, and signals and levels still wait for the close. A signal needs the window to have filled first, and an early one needs the ATR too, or every level sits on its entry price.
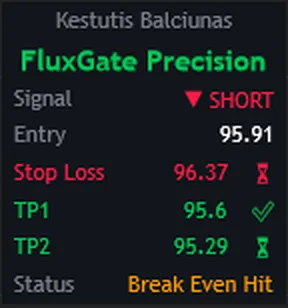
The panel is not a live evaluation of the market. It shows the last signal and how it went: the direction, the entry at the close of the signal bar, the stop and each target with a glyph, and one Status row. On this CL chart a short reached TP1, which moved the exit to the entry, and price then came back to it. TP2 never had its turn, and the row says Break Even Hit.
A check mark means price touched a drawn level on a bar. It is not a filled order, and there is no spread, commission or slippage in it. The dashboard is one fixed size, scaled with the Windows display setting, and it can sit in any of the four chart corners.
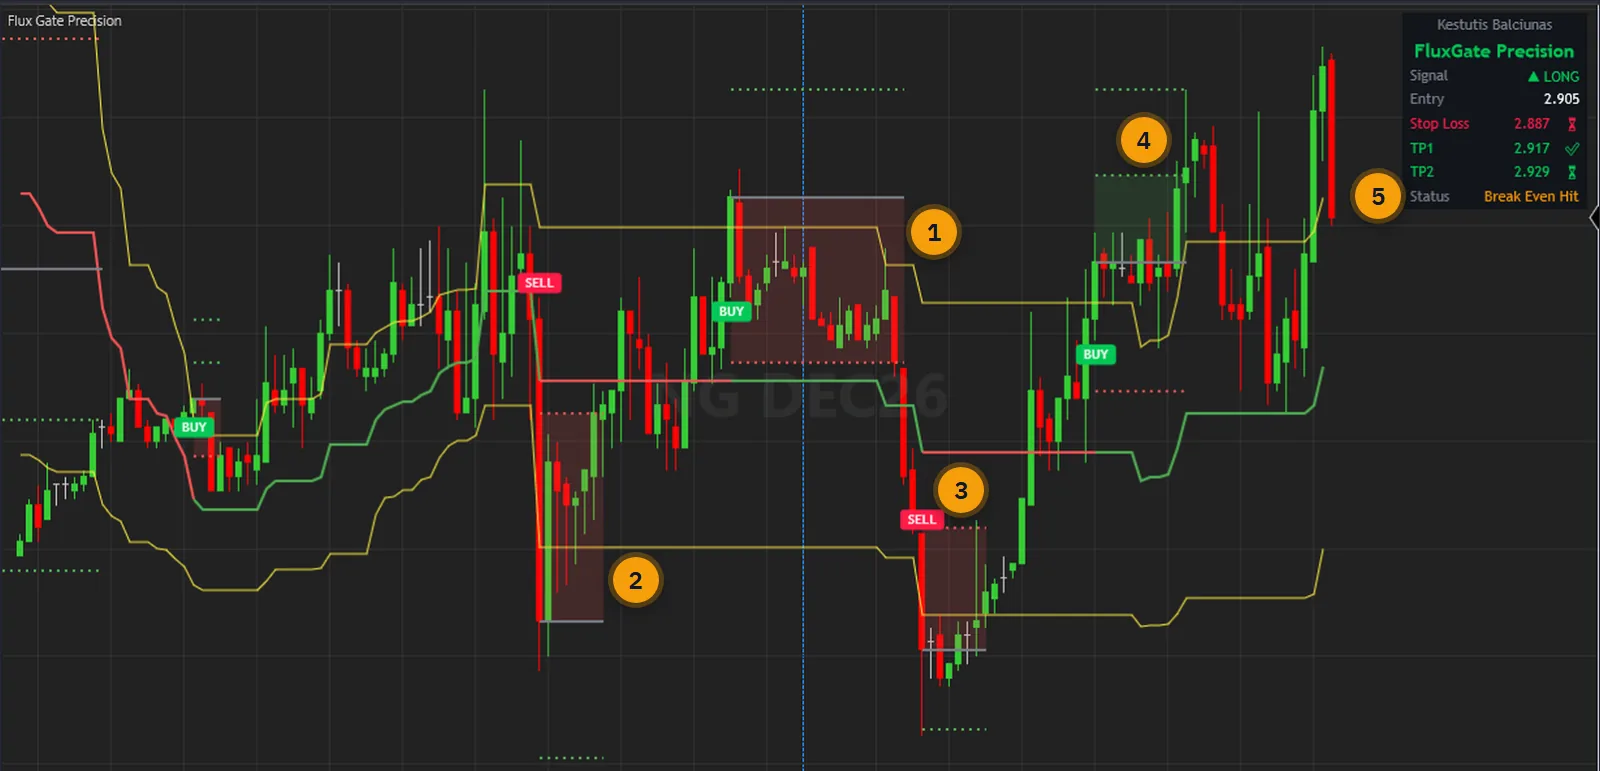
Every trade leaves its mark. A light green band fills the space between the levels when a target is reached, and a light red band fills the space between the stop and the entry when the stop is reached. This NG chart has three of those red bands in view. One of the stops was reached only by a wick, which is enough: the record is of price touching a drawn level on a bar, not of an order being filled.
With the ATR setting on, the default, the stop and targets are multiples of the ATR when the signal printed, here 0.018 for the stop and 0.012 for TP1 on the newest trade. Switch it off and they are percentages of the entry instead. Keep the multipliers ascending: a TP3 nearer than TP2 moves the exit to a level price has already passed, and the trade closes on that bar.
The calculations are not tied to an instrument. The captures below were taken in NinjaTrader 8 on the free simulation feed: index, energy, metal, currency and rate futures, from 1-minute to 30-minute bars, with the indicator at its default settings on every one.
Volume is not used. The thresholds, the ATR, the signals and the levels come from the bars' prices only, so the volume pane on these captures plays no part and a feed without volume draws the same chart. Levels round to the contract's tick size, and prices on the labels and the dashboard print as decimals, also on a contract quoted in fractions such as ZB.
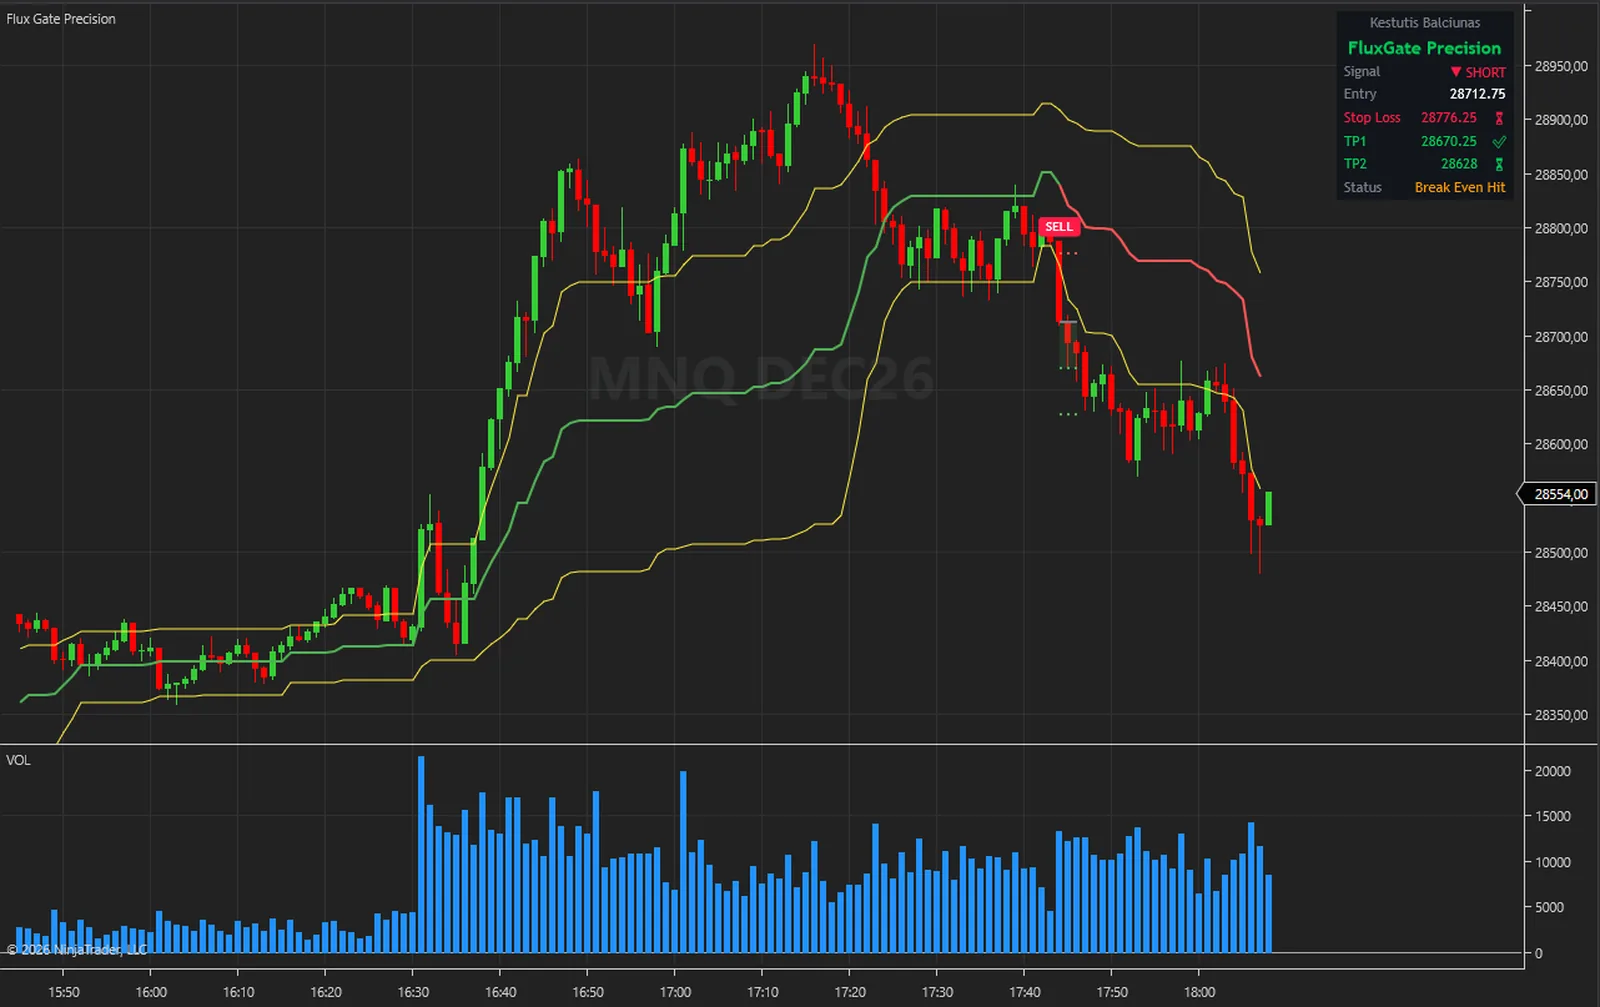
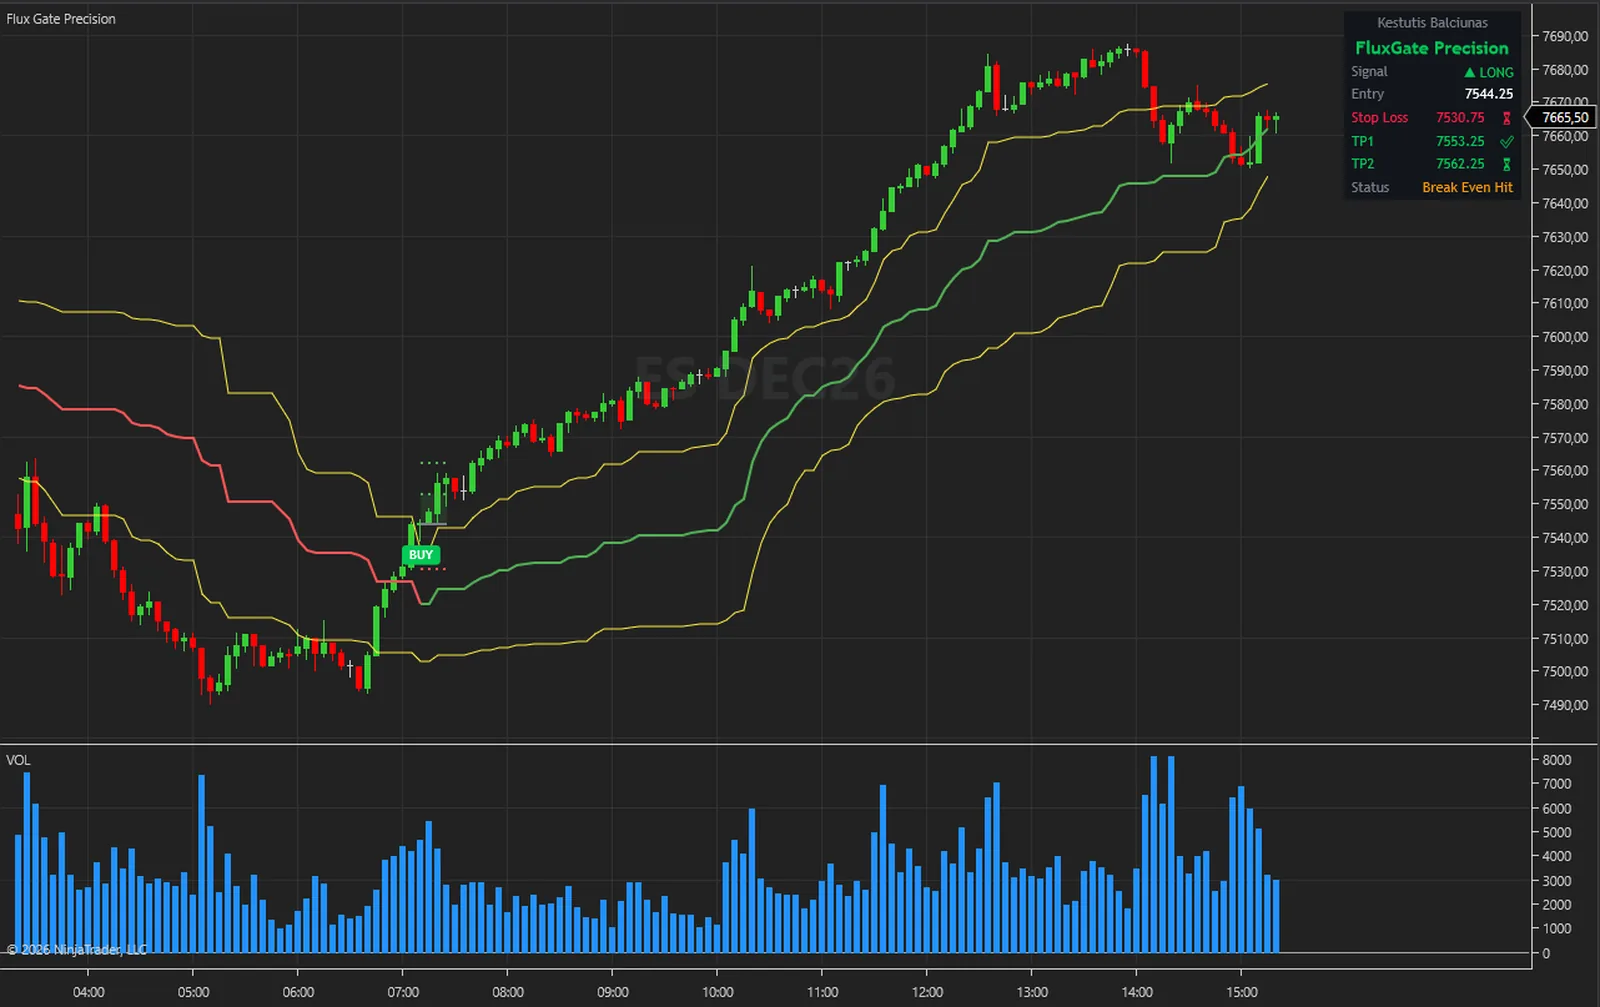
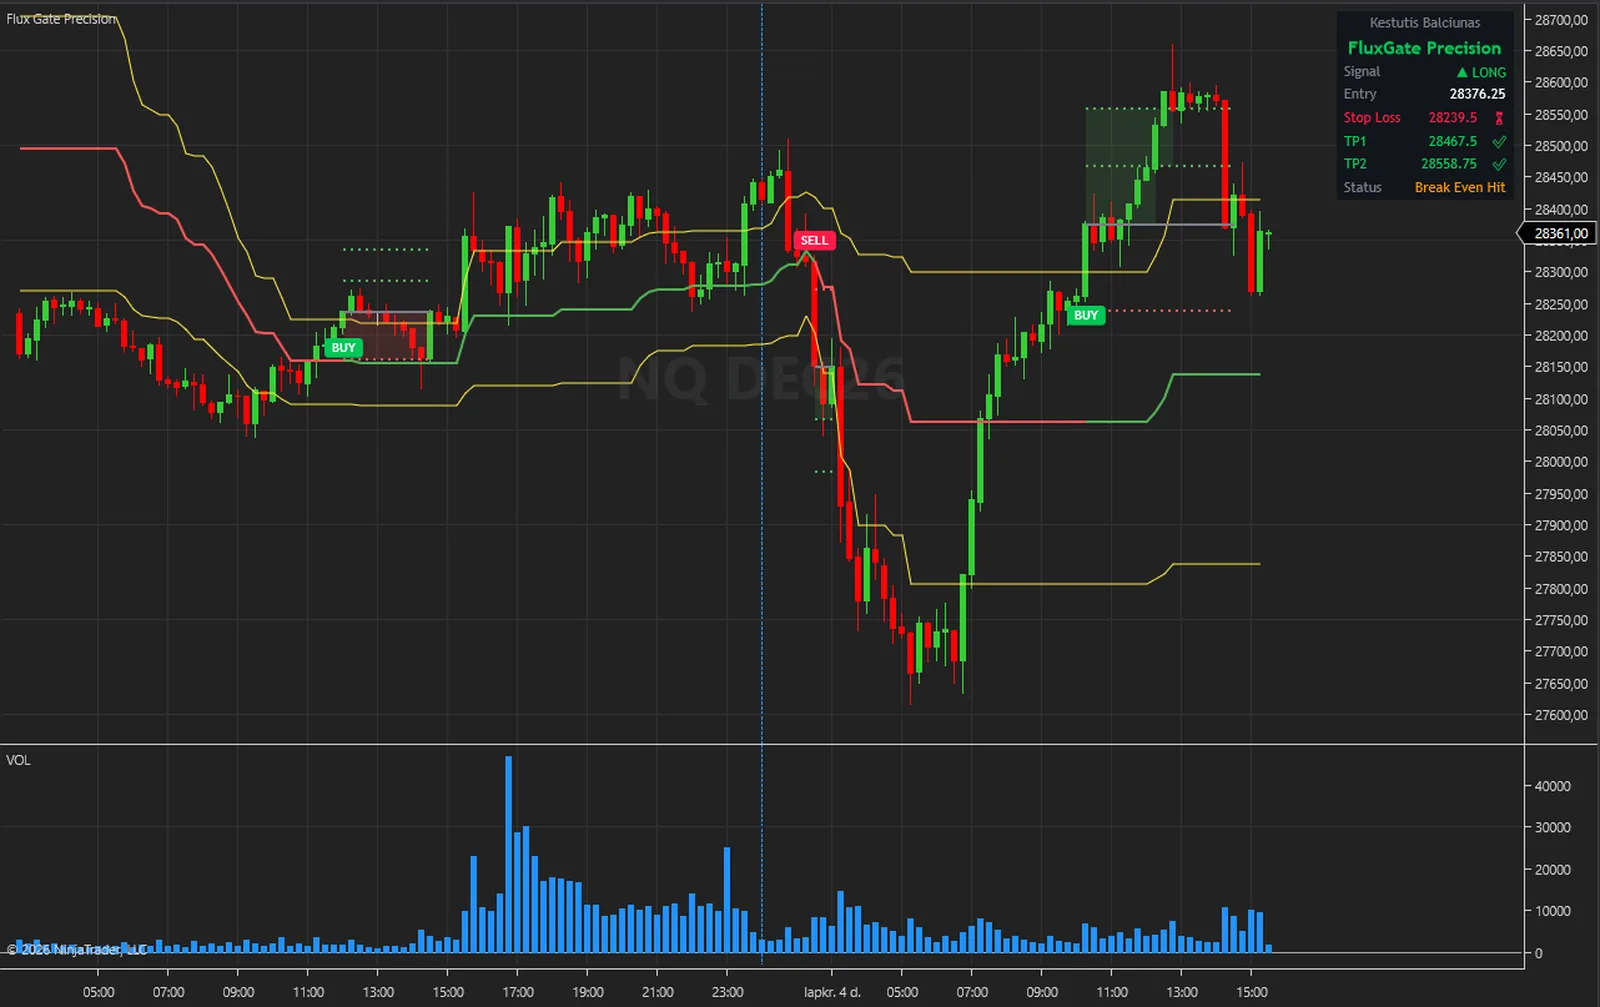
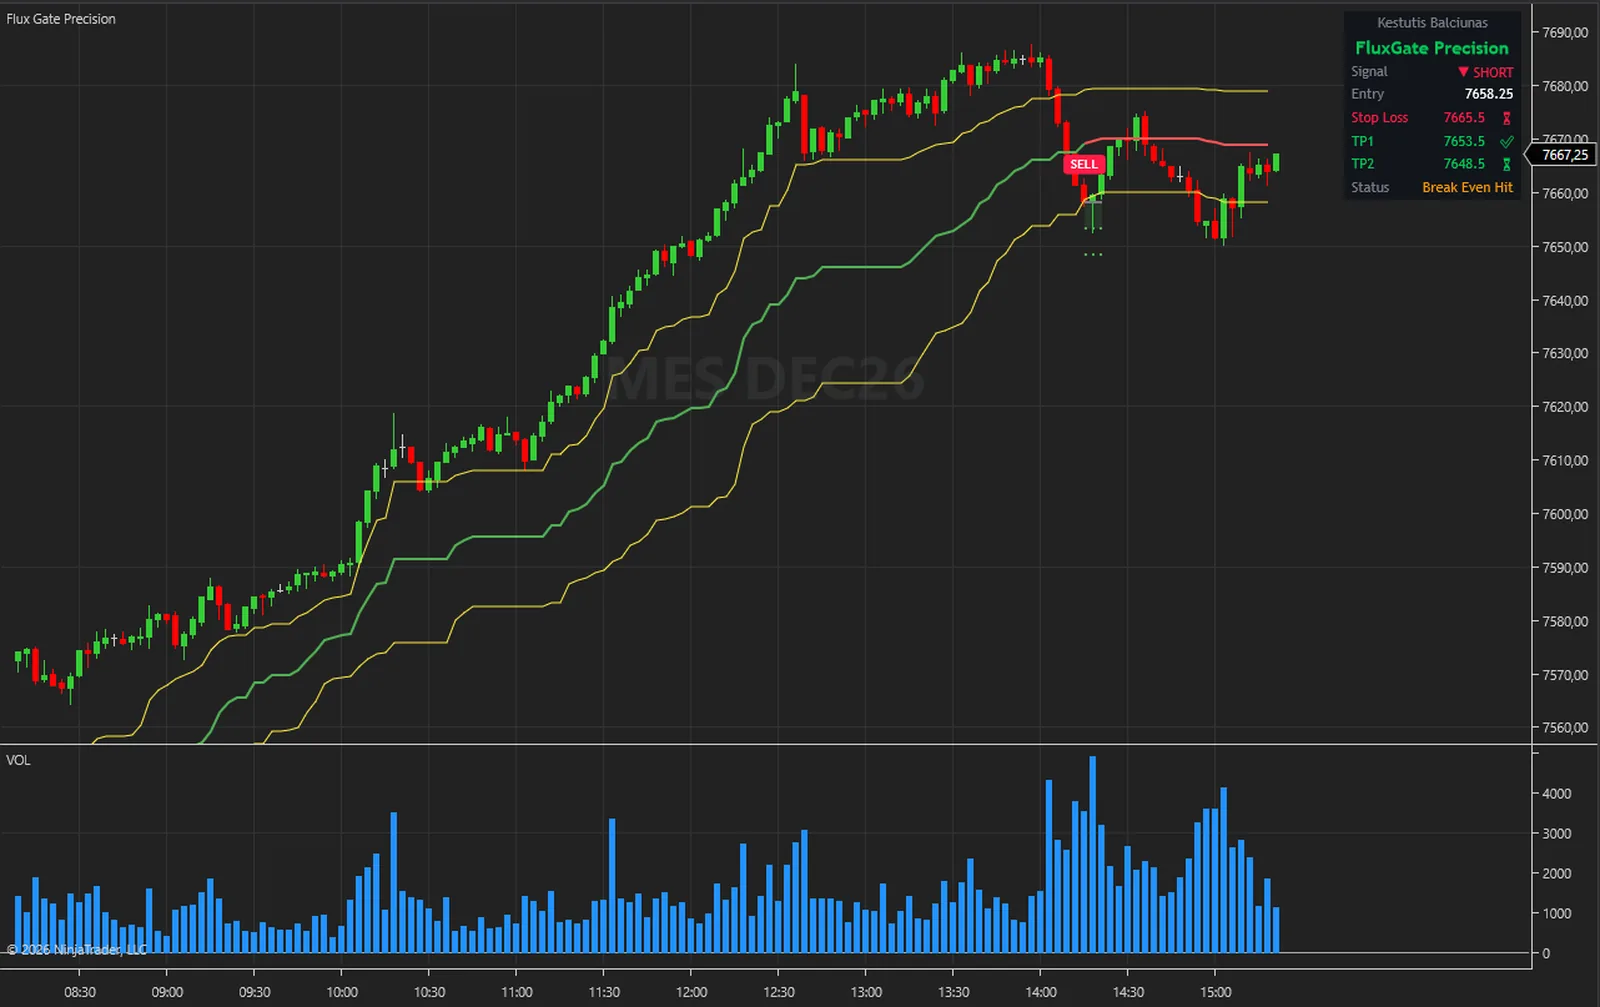
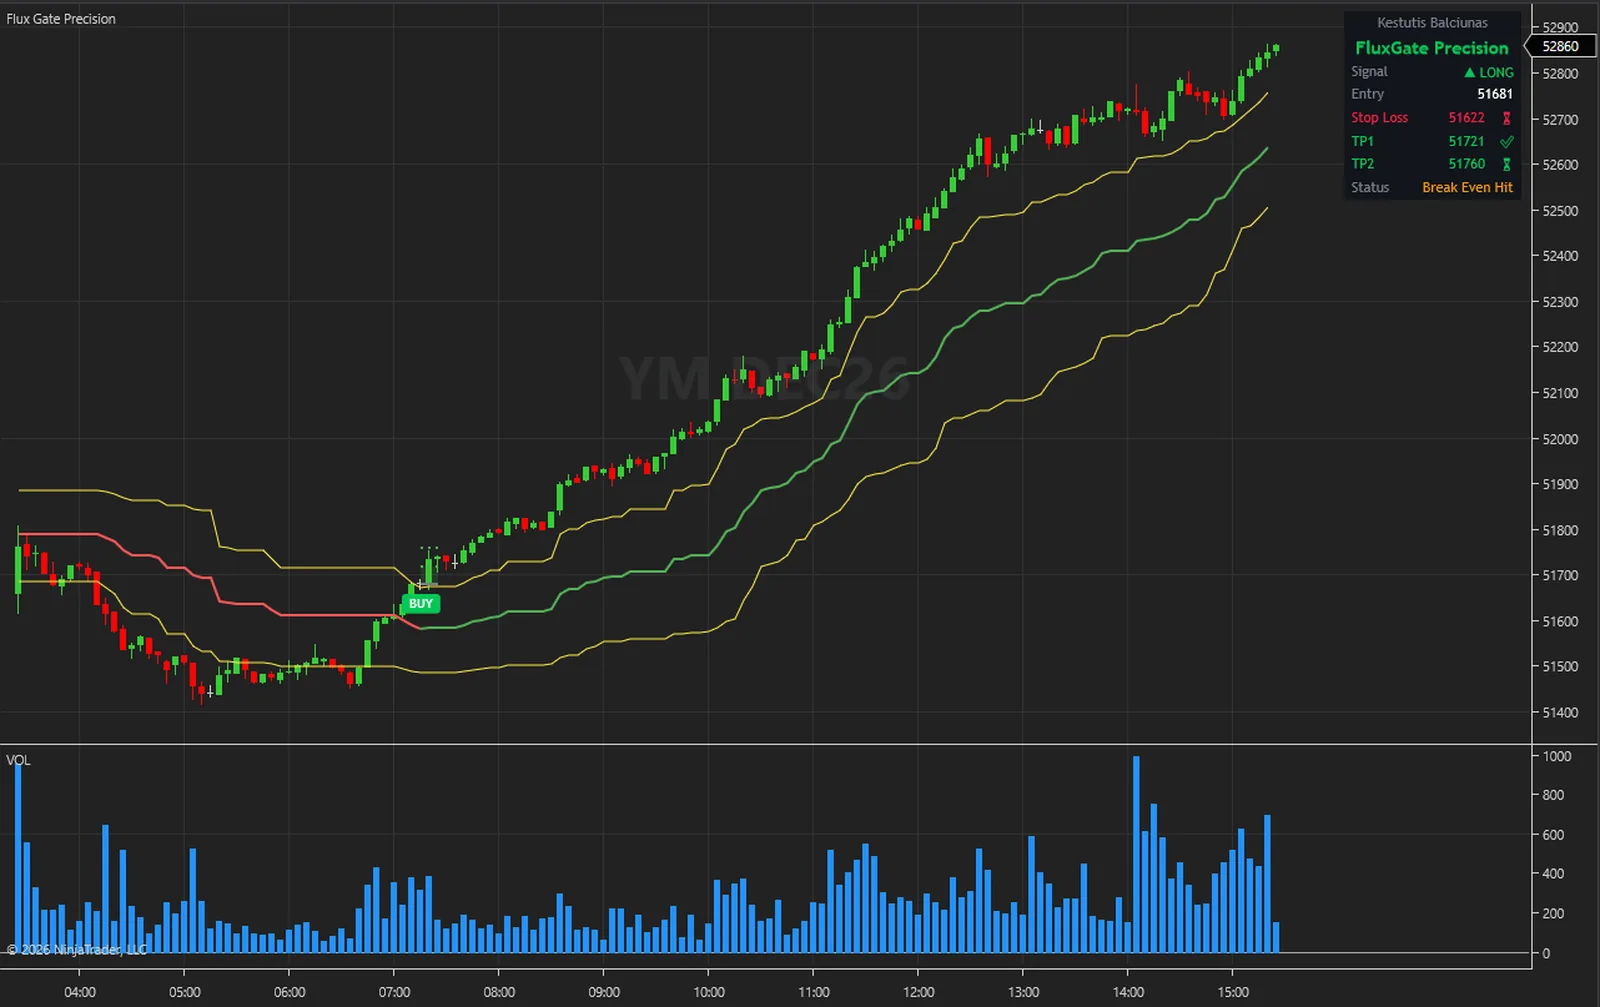
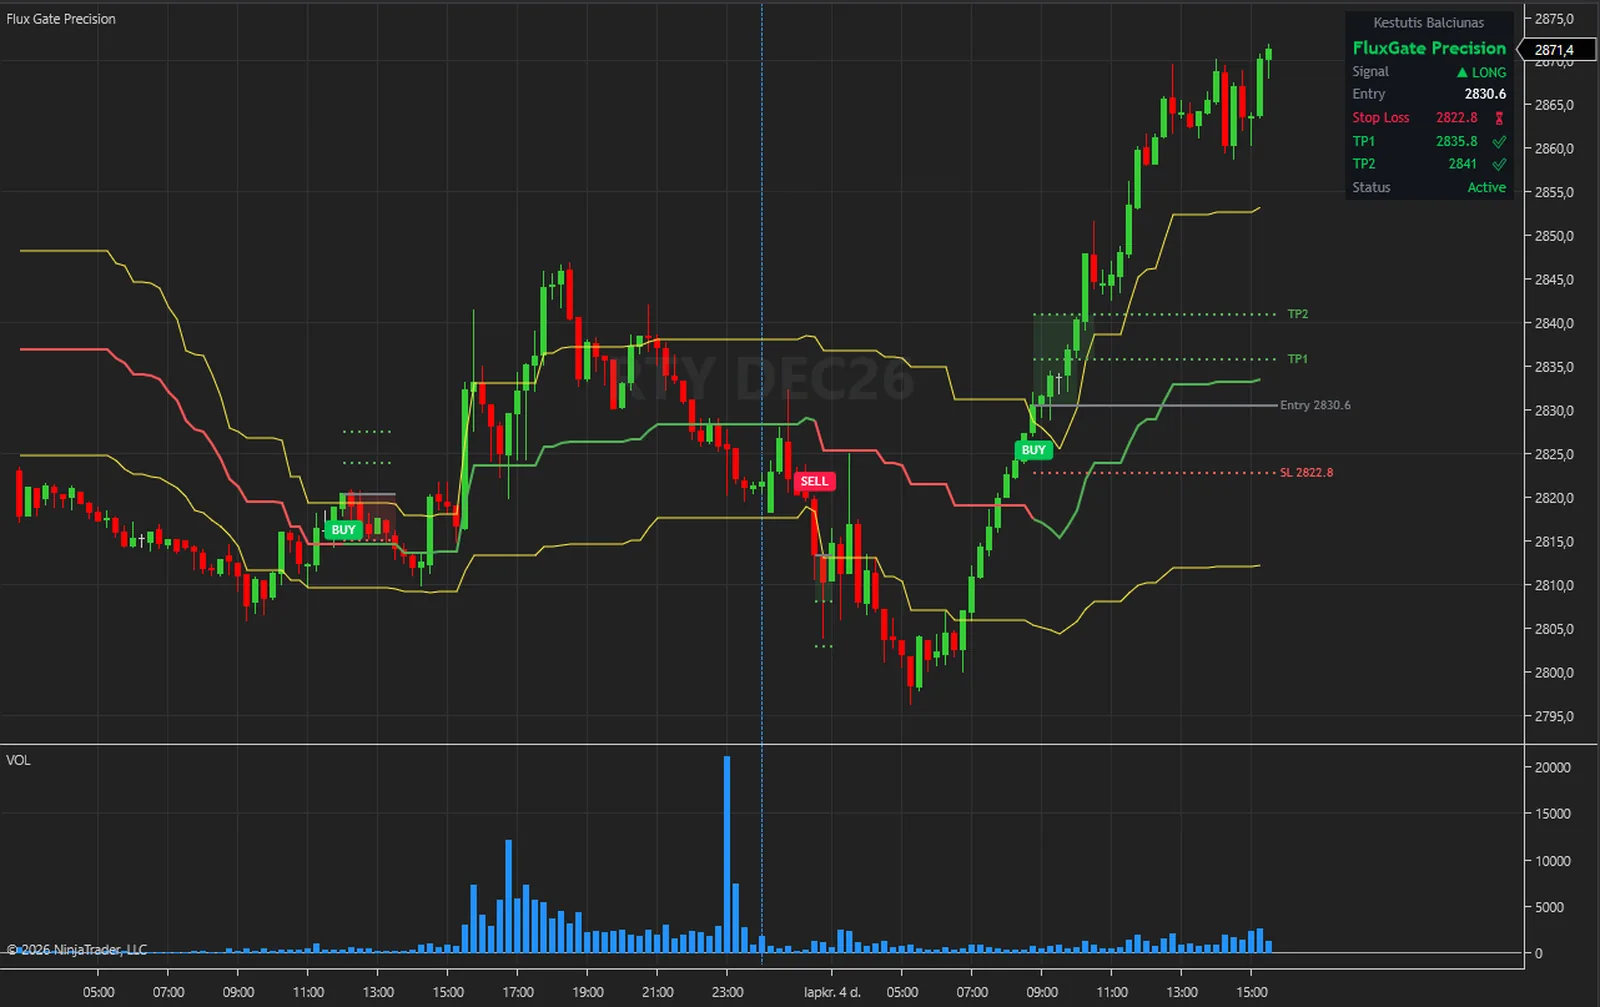
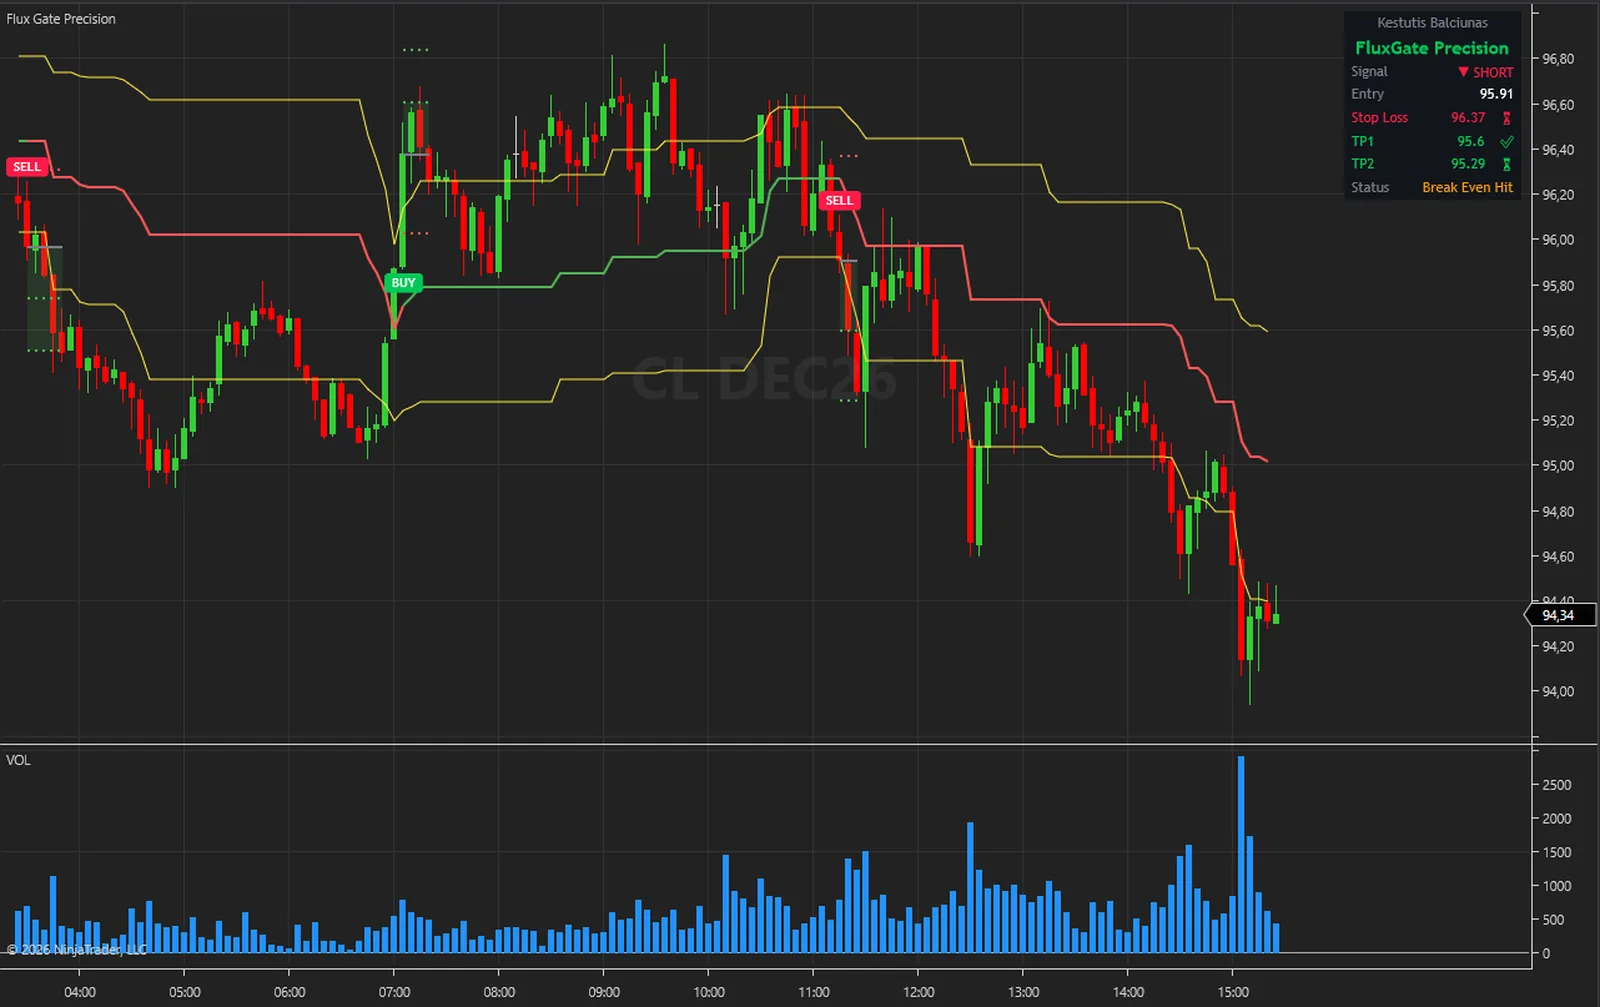
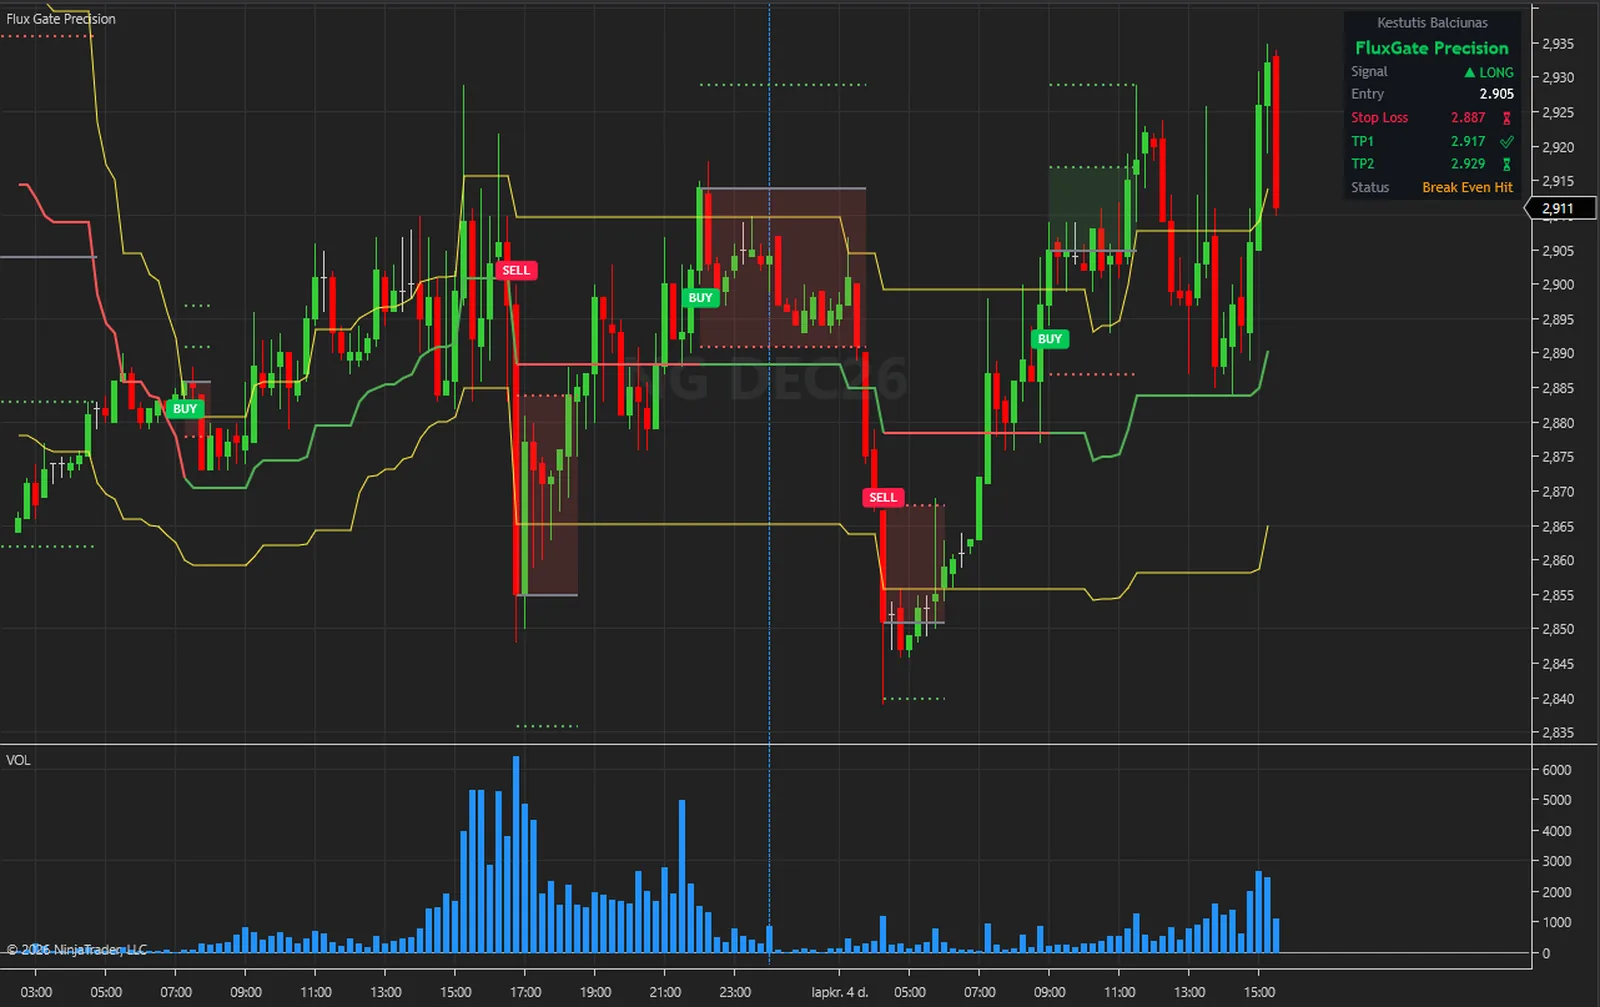
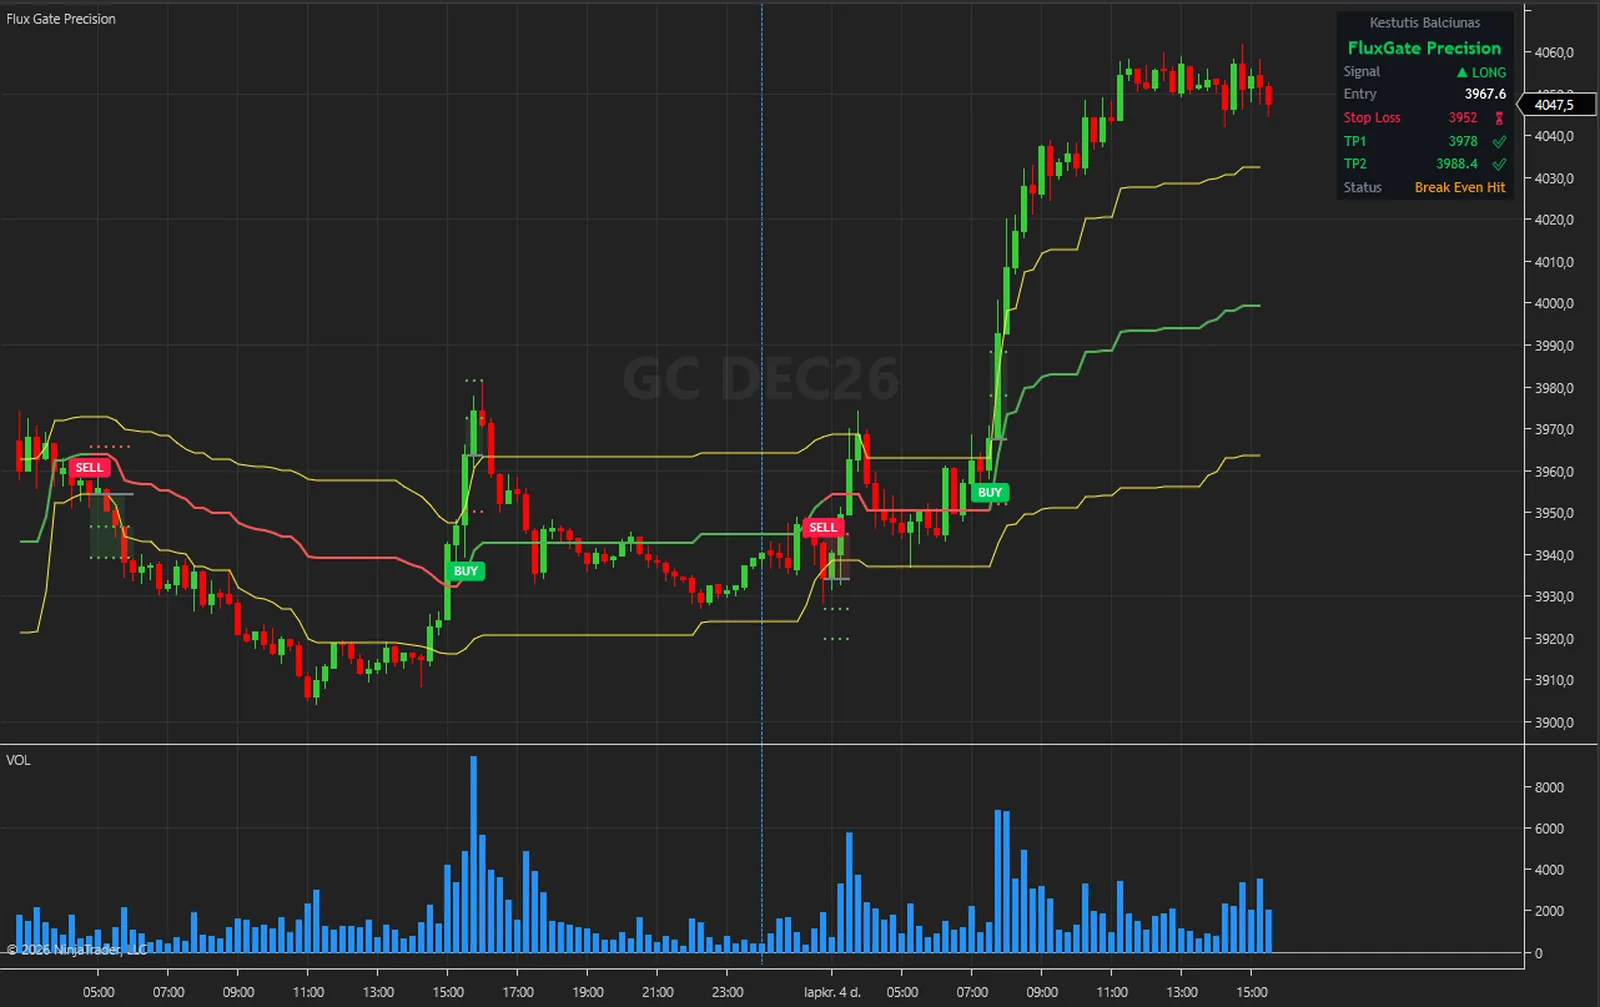
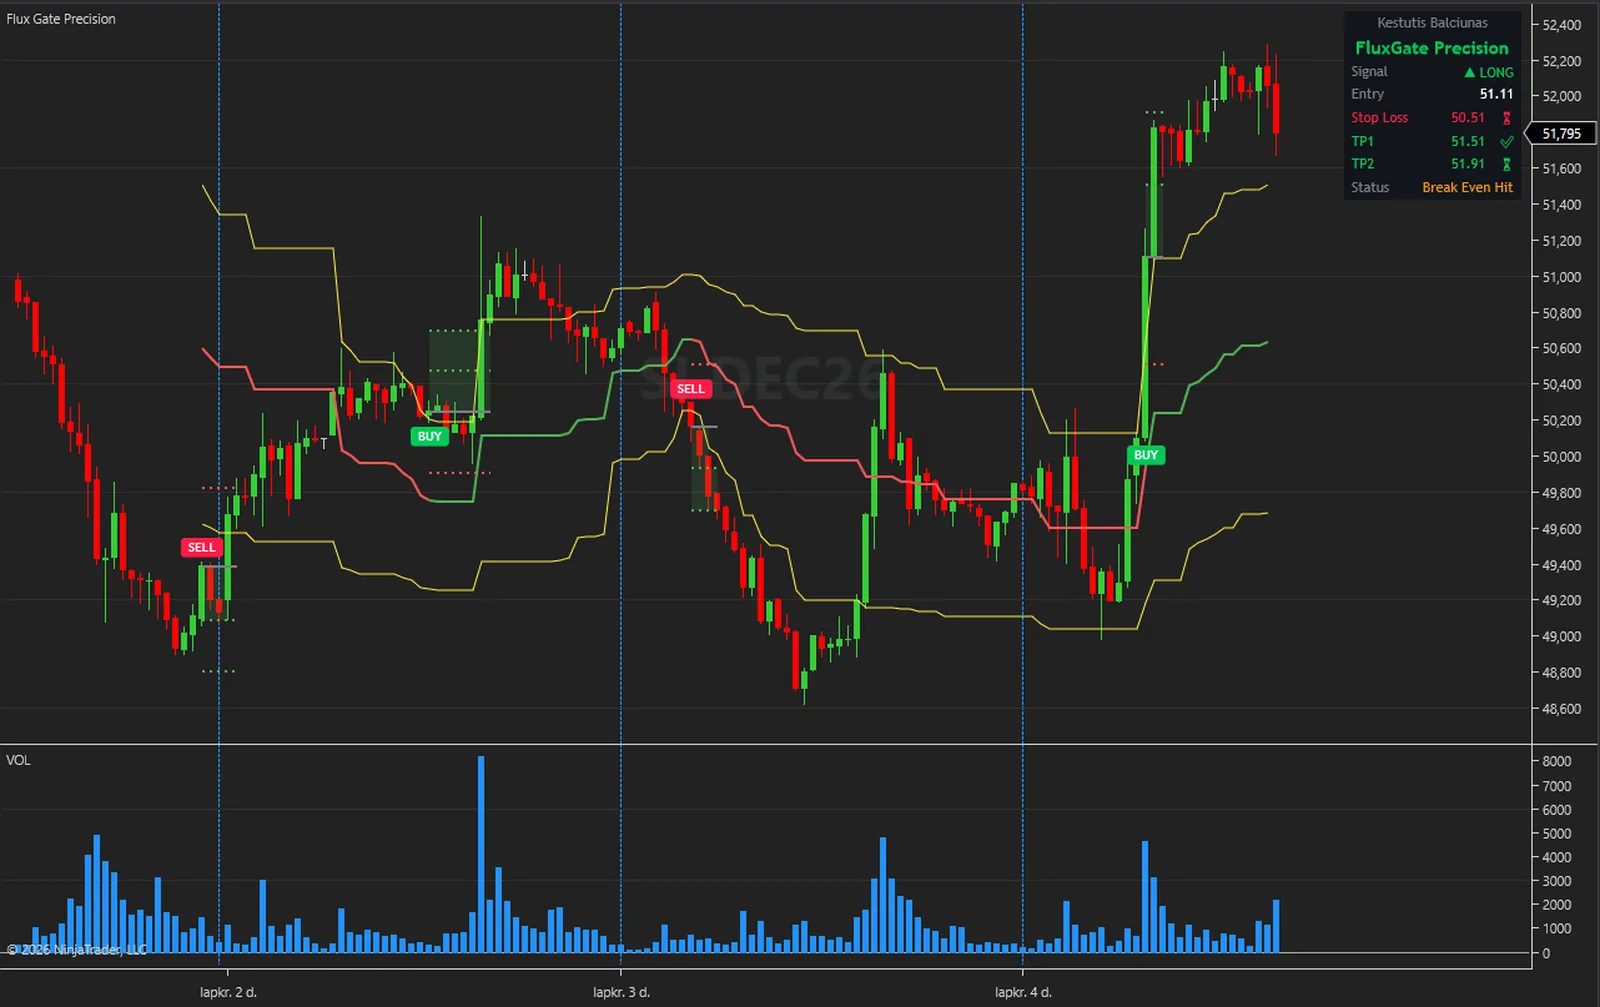
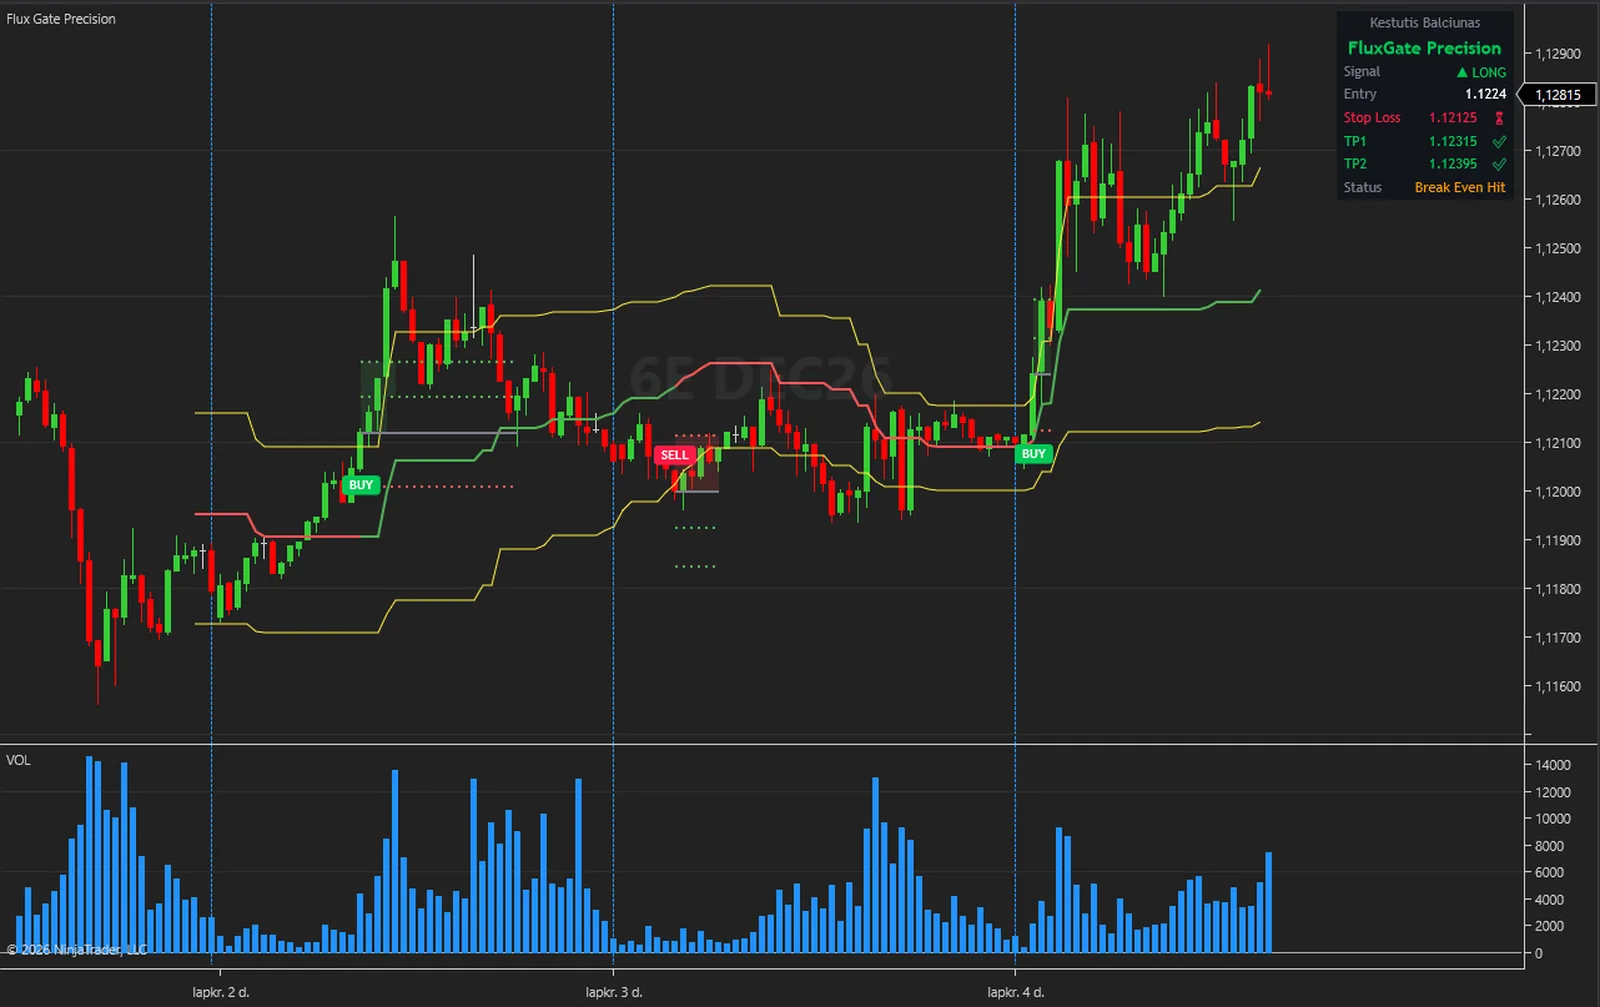
The same steps on every closed bar, in this order. Nothing hidden and nothing exotic.
The top of the highs and the bottom of the lows over the last 44 bars. No line and no signal appear until the window has filled.
The upper threshold 23.6 % of the range below the window's high, the mid line at 50 %, the lower threshold at 78.6 %. The two thresholds have a setting each.
At or above both the mid line and the upper threshold is a long. At or below both the mid line and the lower threshold is a short. The trend must not already be in that direction.
Entry at the signal bar's close, the stop and targets in ATR multiples or percentages of the entry, rounded to the tick. They do not move after this.
A reached target gets a check mark and moves the exit up the ladder. The trade closes at the stop, at TP4, on a return to the break-even level or on a trend flip, and the Status row says which.
| Drawn Fibonacci | Flux Gate Precision | |
|---|---|---|
| Where the levels come from | A swing you pick by hand | A rolling window, 44 bars by default |
| When they update | When you redraw them | On every bar |
| Signals | None | BUY and SELL on closed bars |
| Trend state | None | Mid line green while long, red otherwise |
| Stop and targets | You work them out | ATR multiples or percentages, up to four targets |
| After the entry | Nothing | A break-even ladder and a Status row |
| For your strategies | A drawing, no series | Five series including Signal |
The engine that computes everything also runs outside NinjaTrader. With its diagnostic dump switched on, the NinjaTrader edition writes every committed bar with the values it drew; those bars are replayed through the engine outside the platform, and the two files are compared value by value.
On 4,923 MNQ 1-minute bars every one of the 58 series compared was equal on every bar. A second run, with Calculate set to each tick and the chart left live across the switch from history to live bars, gave the same result on 4,169 bars.
What that proves: the indicator receives exactly one closed bar per chart bar with the right open, high, low, close and volume, never double-feeds or skips a bar, and shows the values the engine produced. What it does not claim: it is a test of correct calculation, not of trading results, and it says nothing about future performance.
The full method is in the user guide: User Guide (PDF) and Installation and Quick Start (PDF).
No subscription and no renewal. Pay once and the indicator stays licensed to your NinjaTrader account, updates included.
Flux Gate PrecisionNinjaTrader 8 indicator
$77one payment, lifetime licence
The licence is issued to your NinjaTrader account through NinjaTrader's Vendor Licensing, by hand, normally within a few hours and always within 24 hours of your form arriving. You get an email with the download link when it is done.
Because a licence cannot be handed back once it is on your account, a sale is final once the licence has been issued. If you paid and the licence has not been issued yet, email me and I will refund you in full. The user guide is public, so you can read exactly what the indicator does before you pay.
The full terms of sale and the privacy notice for buyers are one page each, in plain language.
Trading carries risk of loss. This is an analysis tool, not financial advice, and no indicator can promise a profit.
Signals, levels, trades and alerts come from closed bars only and do not repaint. The stop and the targets of a trade do not move once it has opened; its lines and labels extend to the right as the chart advances. With Calculate set to each tick or on price change the threshold lines and the mid line follow the forming bar as a preview, and the bar is committed once, at the first tick of the next bar. On a closed market that happens at the first tick of the next session, so a signal on the session's last bar appears then.
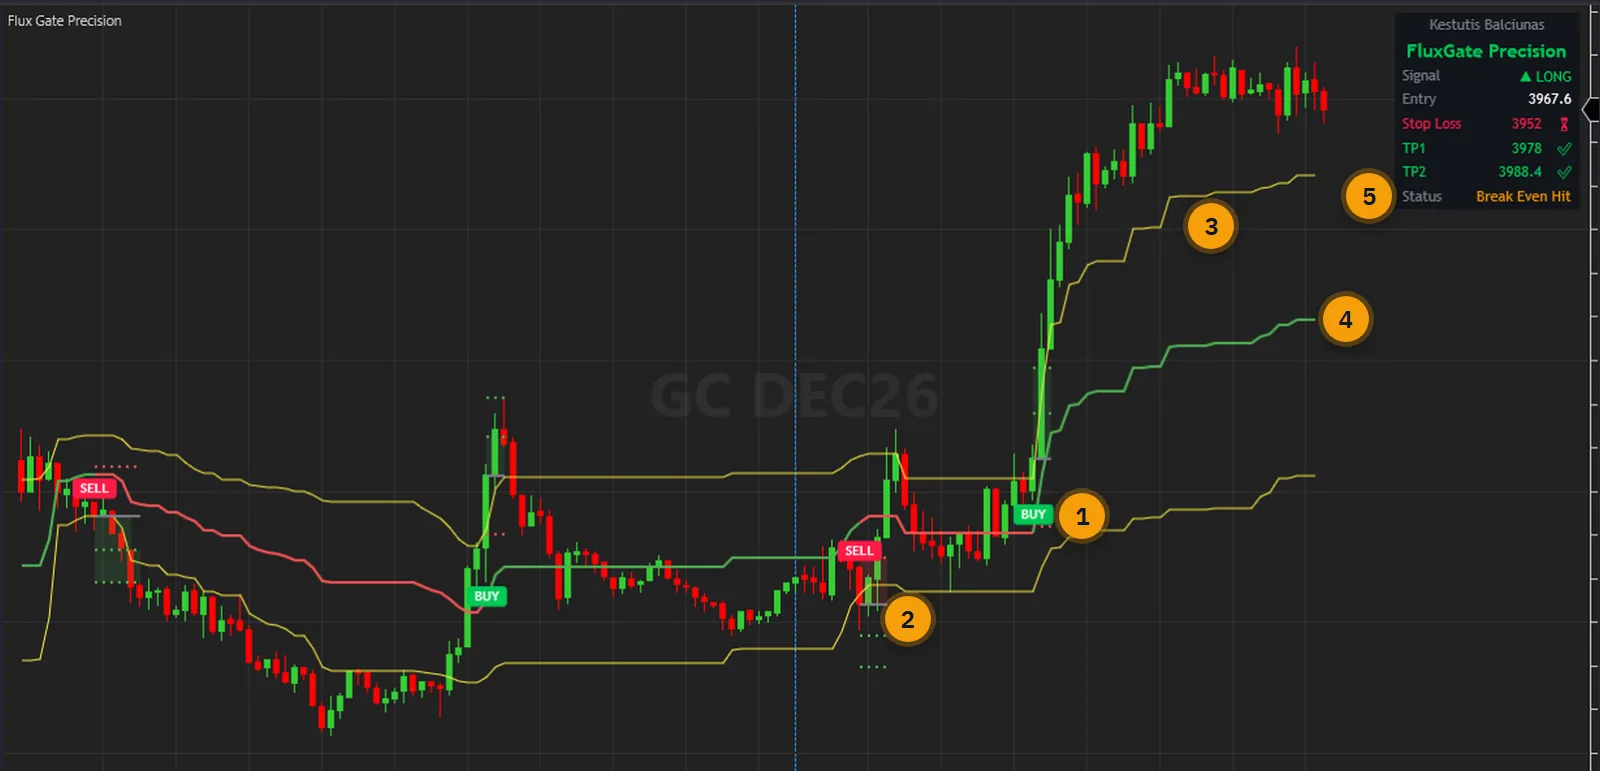
The exit had been moved up the ladder and price came back to it, which closes the trade. After TP1 that exit is the entry. After TP2 it is TP1, so a trade can read Break Even Hit with both targets ticked, as on the GC chart above. It describes price touching a drawn level on a bar, with no spread, commission or slippage in it.
They are off by default: a multiplier of 0 means the target does not exist. Set a multiplier above 0 and the target, its line, its label, its dashboard row and its alert appear together. Keep the multipliers ascending. Reaching TP3 moves the exit to TP2, so a TP3 nearer than TP2 closes the trade on that bar.
More bars than the Analysis Window, 44 by default, before anything appears. The ATR needs its own period, 14 by default: a signal before that has the stop and every target on its entry price, and it clears itself after that many bars. Raise Days to load in the Data Series dialog if a chart looks short.
Yes. A strategy can read the Signal series, +1 on the closed bar of a BUY marker and -1 on a SELL, and the three lines. They can also be shown as Market Analyzer columns. The indicator holds no order logic, so the orders are your strategy's own.
NinjaTrader 8.1 Desktop for Windows; the build is tested on 8.1.9.0. Any data connection that delivers bars works, including the free simulation connection.
No. NinjaTrader 8 is free to download and use for charting and simulation, with free real-time futures data for the simulator. A live account with a broker of your choice is a separate step that this indicator does not need. NinjaTrader is the platform it runs inside, not a broker.
No. The licence is tied to your NinjaTrader account login through NinjaTrader's Vendor Licensing, not to a PC. Log in on any installation and the indicator runs; a new PC needs no transfer.
I issue it by hand in the NinjaTrader Vendor Dashboard. It is normally done within a few hours and always within 24 hours of your form arriving, including weekends.
No. It is one payment of 77 USD for a lifetime licence on one NinjaTrader account, with future updates included.
Once the licence has been issued the sale is final, because a licence on your account cannot be handed back. That is why the user guide is public: read it first. If you paid and the licence has not been issued yet, email me and I will refund you in full.
Yes. Email me from the address you bought with and I will move the licence to your new account login.
No indicator can promise that, and this one does not. It gives you thresholds drawn by a fixed rule, signals on closed bars, and a stop and targets to plan around. What you do with that, and how you size positions, decides the outcome.
Each one is a compiled NinjaScript Add-On, 77 USD once, with its own page, charts and public user guide.
An Ichimoku cloud whose periods can scale with volatility, five signal families on closed bars, a confluence score, a stop, three targets and a dashboard.
$77 one payment, lifetime licence
A range filter whose turns are scored across ten layers on closed bars and marked BUY or SELL only past an anti-chop gate, with pivot levels, a dashboard and a timeframe strip.
$77 one payment, lifetime licence
A range filter whose regime flips on closed bars print BUY and SELL plates, with a stop in one of three modes, three targets at multiples of the risk, an EMA cloud and a dashboard.
$77 one payment, lifetime licence
77 USD once. A lifetime licence on your NinjaTrader account, updates included, and the licence issued within 24 hours.


