Equal price levels
The period's high-to-low range is split into equal levels, 150 by default and 50 to 400 with Profile Resolution. Above 166 the lowest levels drop out, because the line count is capped at 501.
 NinjaTrader 8 indicator, NinjaScript
Rigid Volume Profile splits the high-to-low range of the last 200 bars into equal price levels, shares each bar's volume across the levels it touched and draws the result as horizontal bars, green for up bars and red for down bars. On top sit the Point of Control, the 70 % value area with its price tags, and a table of total, up and down volume. On a futures chart it reads real contract volume. It is a picture of where volume traded: it prints no signals and raises no alerts.
$77one payment, lifetime licence
Get the lifetime licence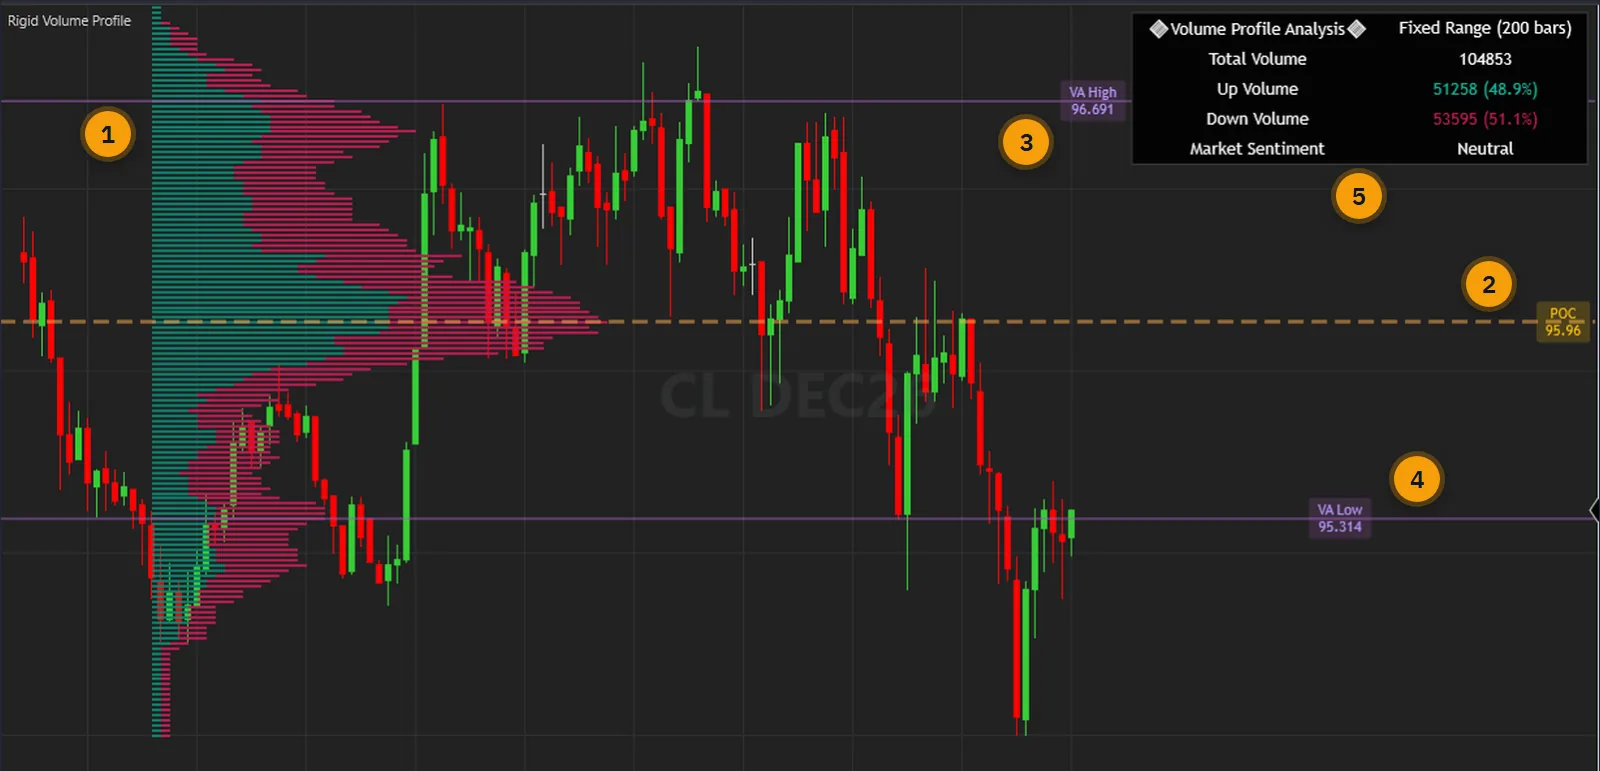
The volume bars under a chart tell you when contracts traded. They do not tell you at what price. To find where the market did its business you would have to add up a hundred bars in your head, and a tall bar that spanned a wide range could belong to any price inside it.
Which bars to measure is the second question. Rigid Volume Profile answers it with a plain count: the last 200 bars by default, whatever the session. The profile describes those bars and moves as new ones arrive, so it stays about the recent market.
It lays an equal price grid over that period, shares each bar's volume across the levels it touched and prints the result: the busiest level, the band that holds 70 % of the volume and a count of up and down volume. It gives no signal and leaves the decision with you.
The user guide is public: every parameter and the verification are in it. Read it before you pay.
One indicator in the price panel: the profile, the levels and the table together.
The period's high-to-low range is split into equal levels, 150 by default and 50 to 400 with Profile Resolution. Above 166 the lowest levels drop out, because the line count is capped at 501.
Green is volume from up bars and red is volume from down bars, on every level. A bar counts as bullish or bearish from its open and close.
A dashed orange line at the level with the most volume in the period, with a tag that prints its price.
Two purple lines mark the band of levels around the POC that holds 70 % of the volume. Each has its own price tag, and Extend Lines runs them to the right.
Total, up and down volume with their shares, and a sentiment row. Nine positions and four sizes. It describes the bars of the period and is not a probability of profit.
Side by Side puts red after green on one line, Split grows them either way from a centre, Stacked draws two lines per level. Mirror Profile draws it against the price axis, except in Split.
Off by default. A short bar per level where one side holds the Delta Threshold share of its volume. They start five bars past the newest bar, so give the chart a right side margin.
The last 200 bars by default, 50 to 2000 with Fixed Analysis Period. Use Visible Range sizes it from the bars in view, up to Max Visible Range Bars. On non-time bars it estimates that count from a one-minute period.
Poc, VaHigh and VaLow are available as Market Analyzer columns on the newest bars. They are not suitable for a historical backtest, because the calculation exists on the newest bar only.
Every picture below is a NinjaTrader 8 capture with numbered notes added. Nothing on the charts is drawn by hand. Click any image to enlarge it.
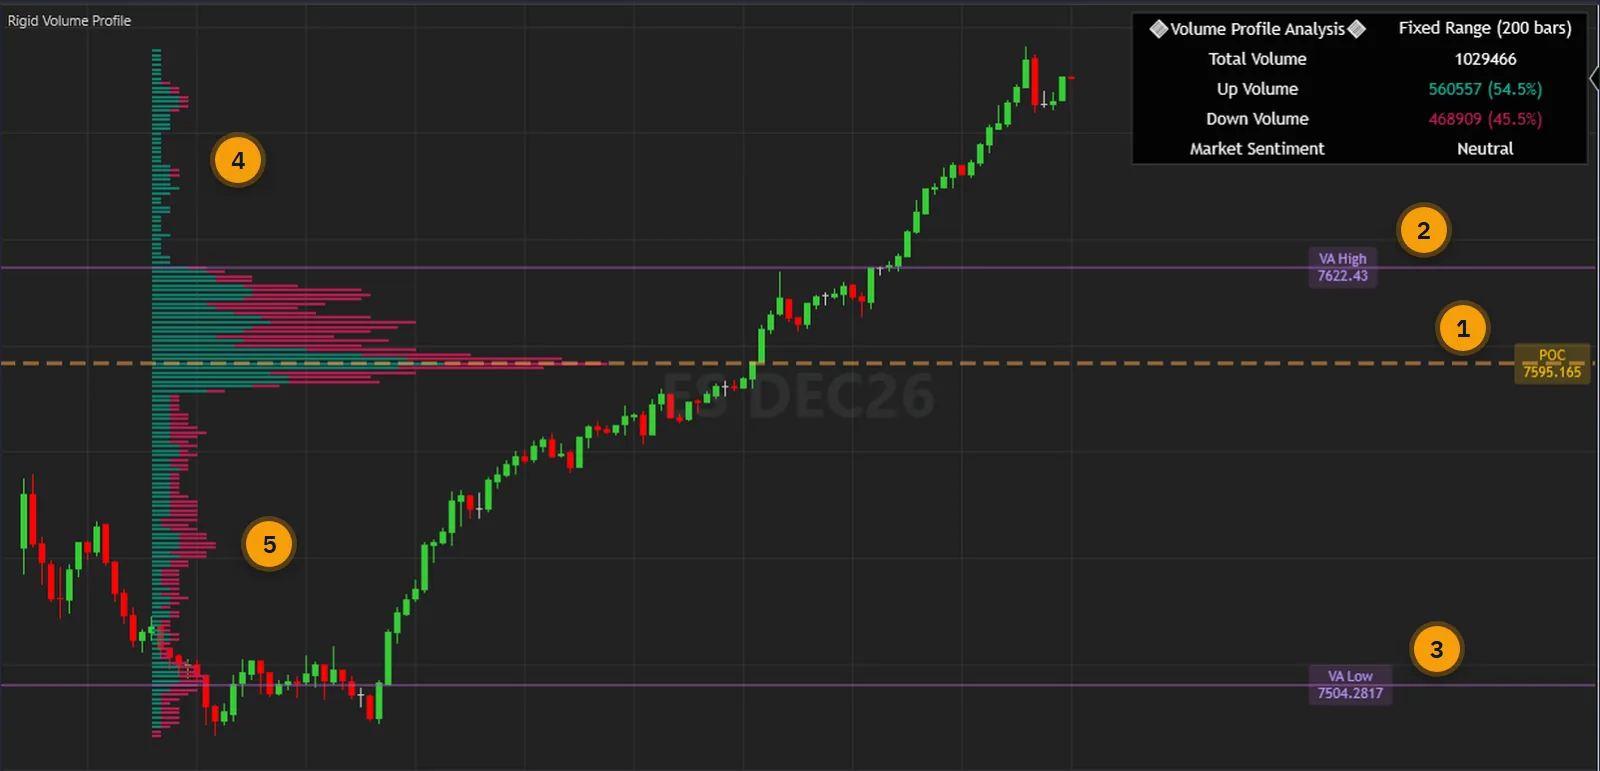
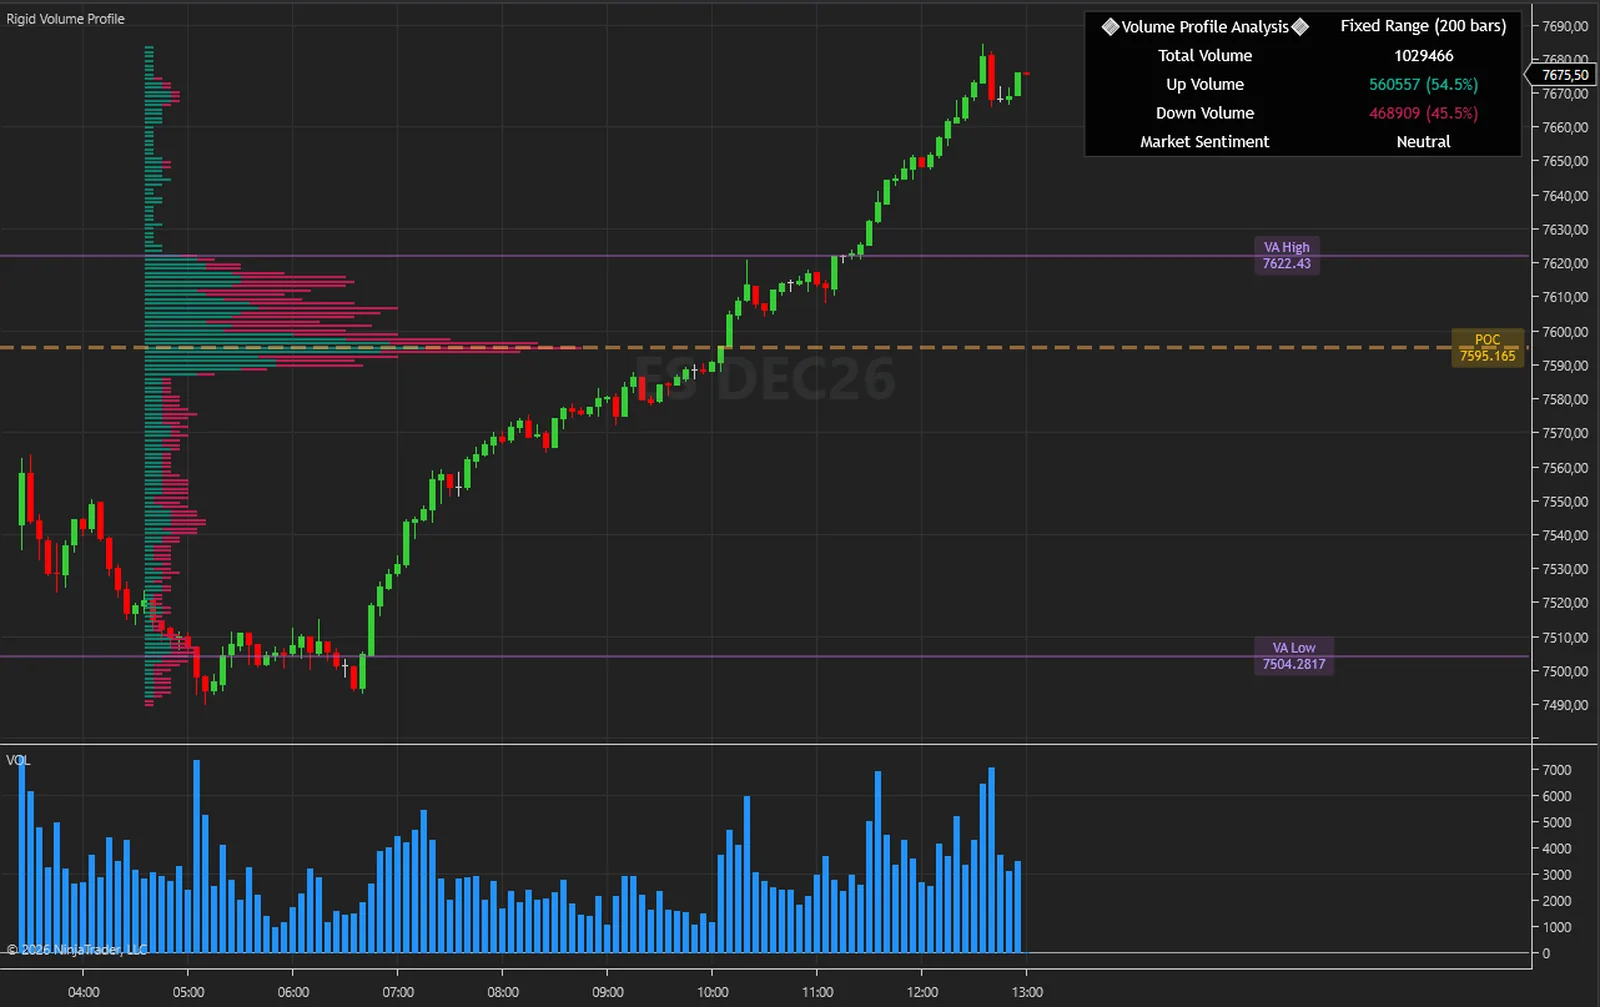
Each row's length shows how much volume traded at that price compared with the busiest level. On this ES chart that level is 7595.165, the Point of Control, and the two purple lines mark the band around it that holds 70 % of the volume. The rows above that band are thin and the bars have traded straight through them.
The tags give the exact level, and a tag stays inside the chart and steps aside when the table would cover it. The level is a price on the grid, not a traded tick, so a tag can read 7504.2817 on a market that ticks in quarters. It shows where volume was. It does not say where price goes next.
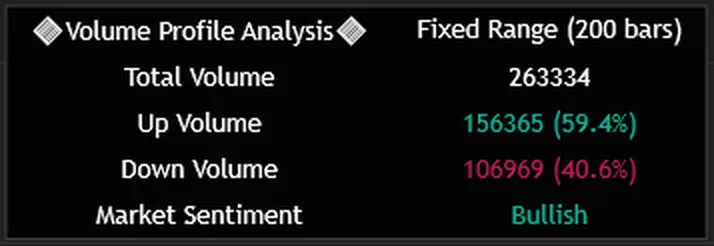
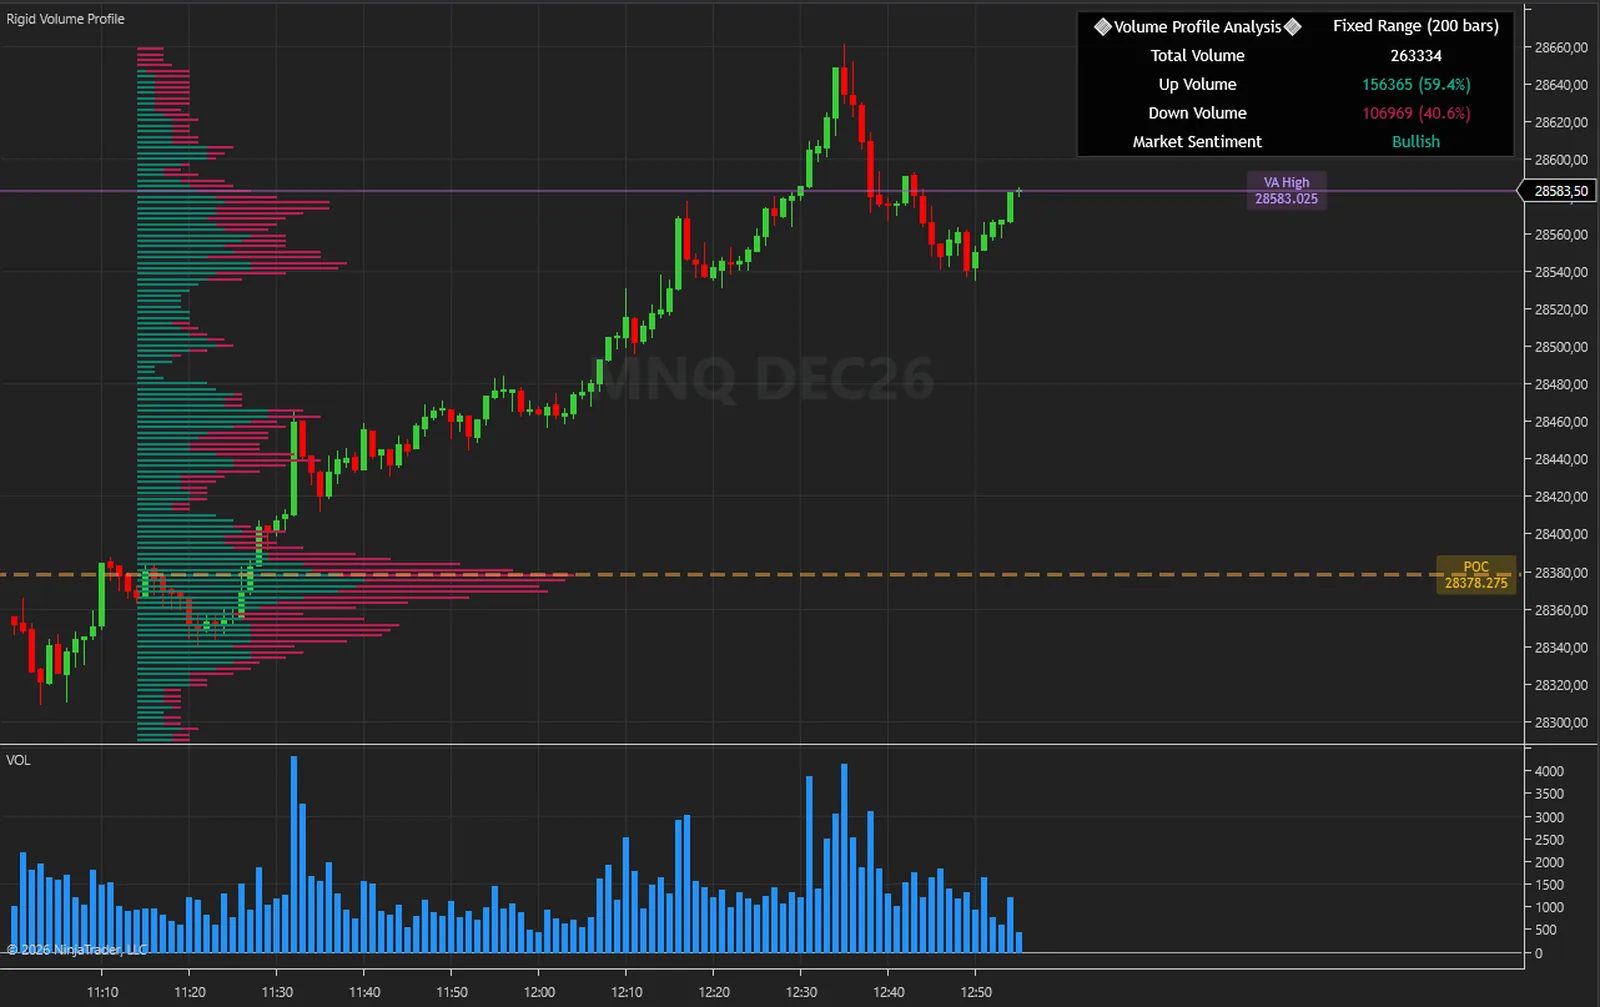
The table counts the volume of the period and splits it by the direction of each bar. Sentiment reads Bullish when up volume is above 55 %, Bearish when down volume is above 55 %, and Neutral otherwise. This one comes from an MNQ 1-minute chart, where up volume was 59.4 % of the volume on the bars in the period.
Those figures describe those bars at those settings. They are not a forecast or a trading record, and they are not a probability of profit. The header shows the period the table is counting, so you can see at a glance whether it is the fixed count or the visible range.
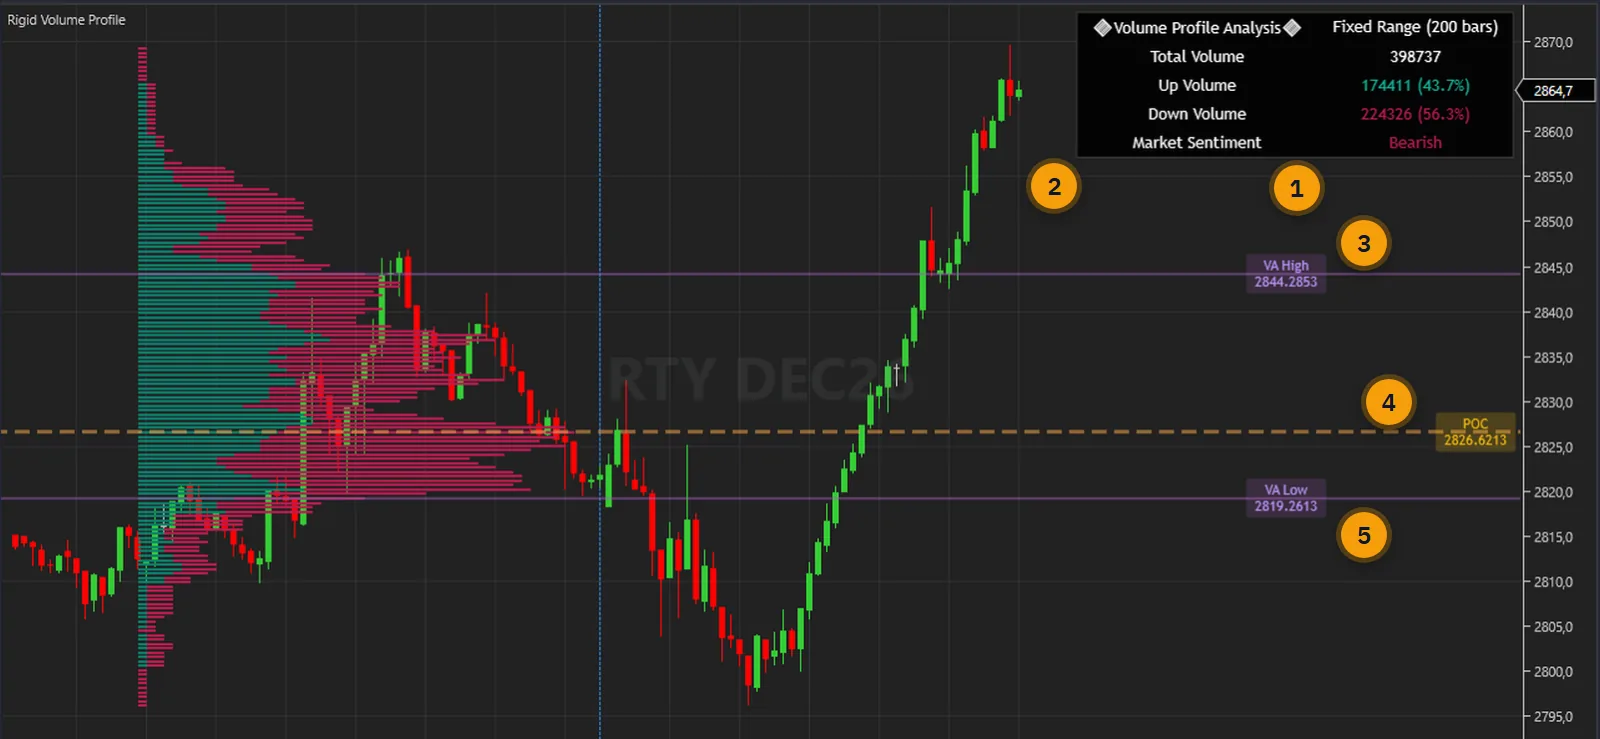
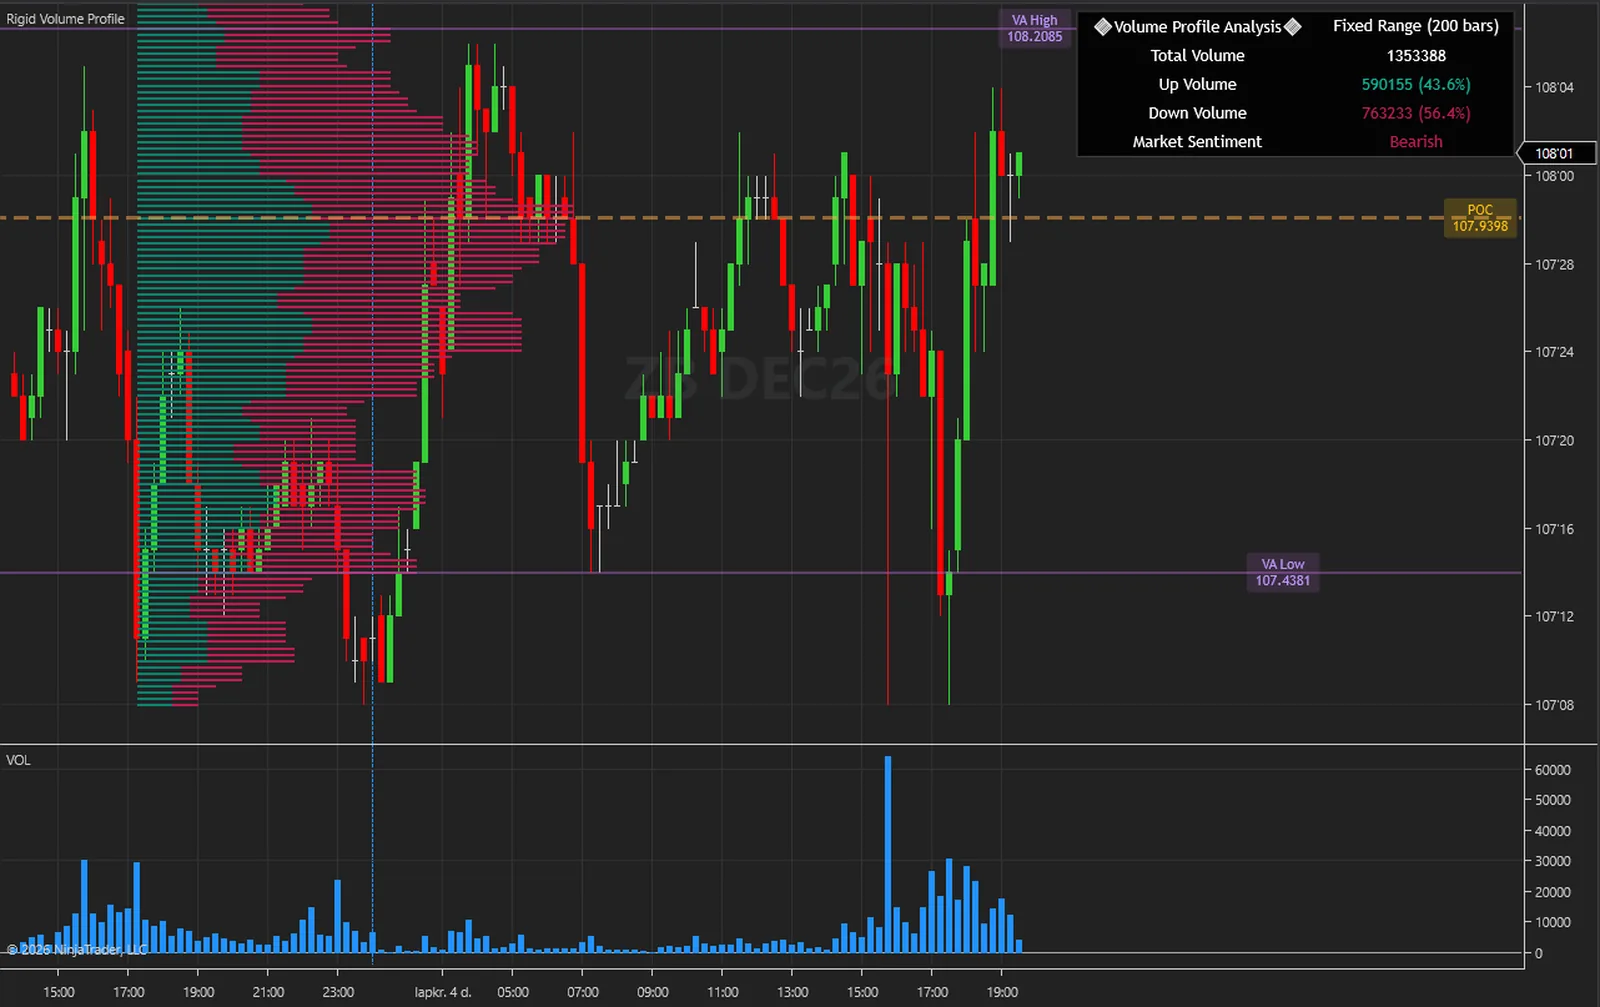
On this RTY chart the table reads Bearish while the last price sits above the whole value area, after a run up from under 2800. Both are true at once. The table counts up and down volume across all 200 bars, and the run up came on far lighter volume than the bars before it, as the volume pane on the full RTY chart below shows.
So read the table as a description of the period, not as a signal. The same goes for the levels: the profile moves as new bars arrive, and a level you marked this morning may have moved by the afternoon. Nothing here is a trade instruction, and the indicator places no orders.
The calculations are not tied to an instrument. The captures below were taken in NinjaTrader 8 on the free simulation feed: index, energy, metal, currency and rate futures, from 1-minute to 30-minute bars, with the indicator at its default settings on every one.
Volume on a futures chart is real contract volume, so the profile shows exchange volume by price level. A bar's volume is shared across the levels it touched: the indicator works from bars, not from tick data, so where inside a bar the volume traded is an estimate. A bar counts as bullish or bearish from its open and close. On a feed without volume the levels stay empty.
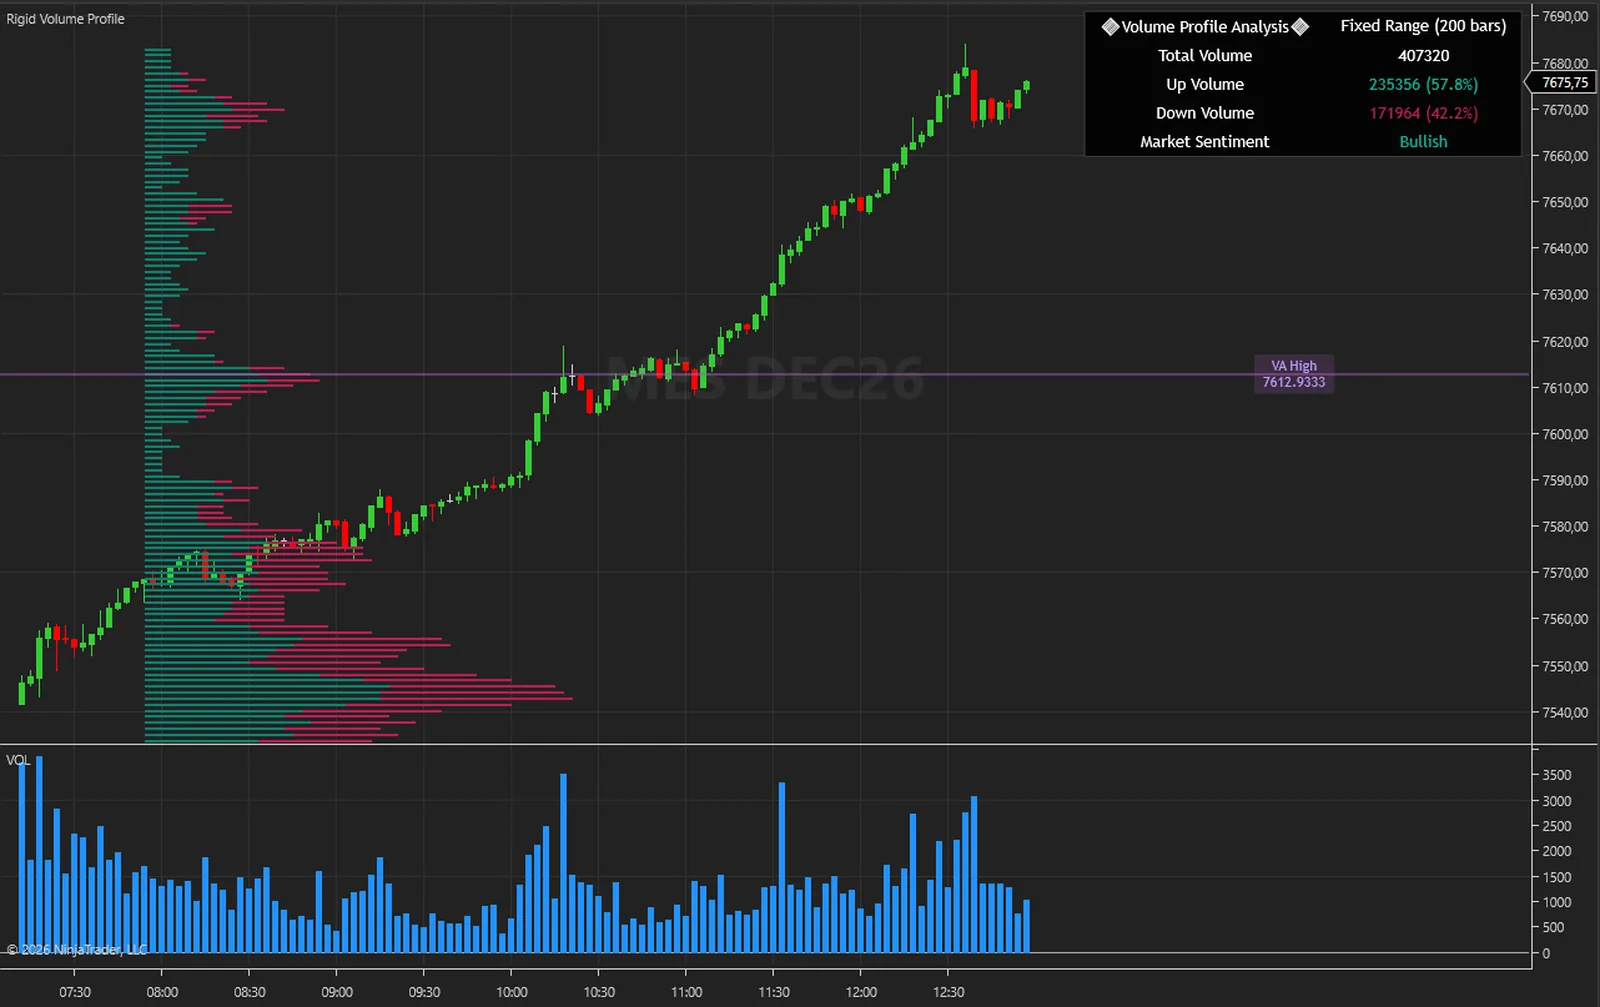
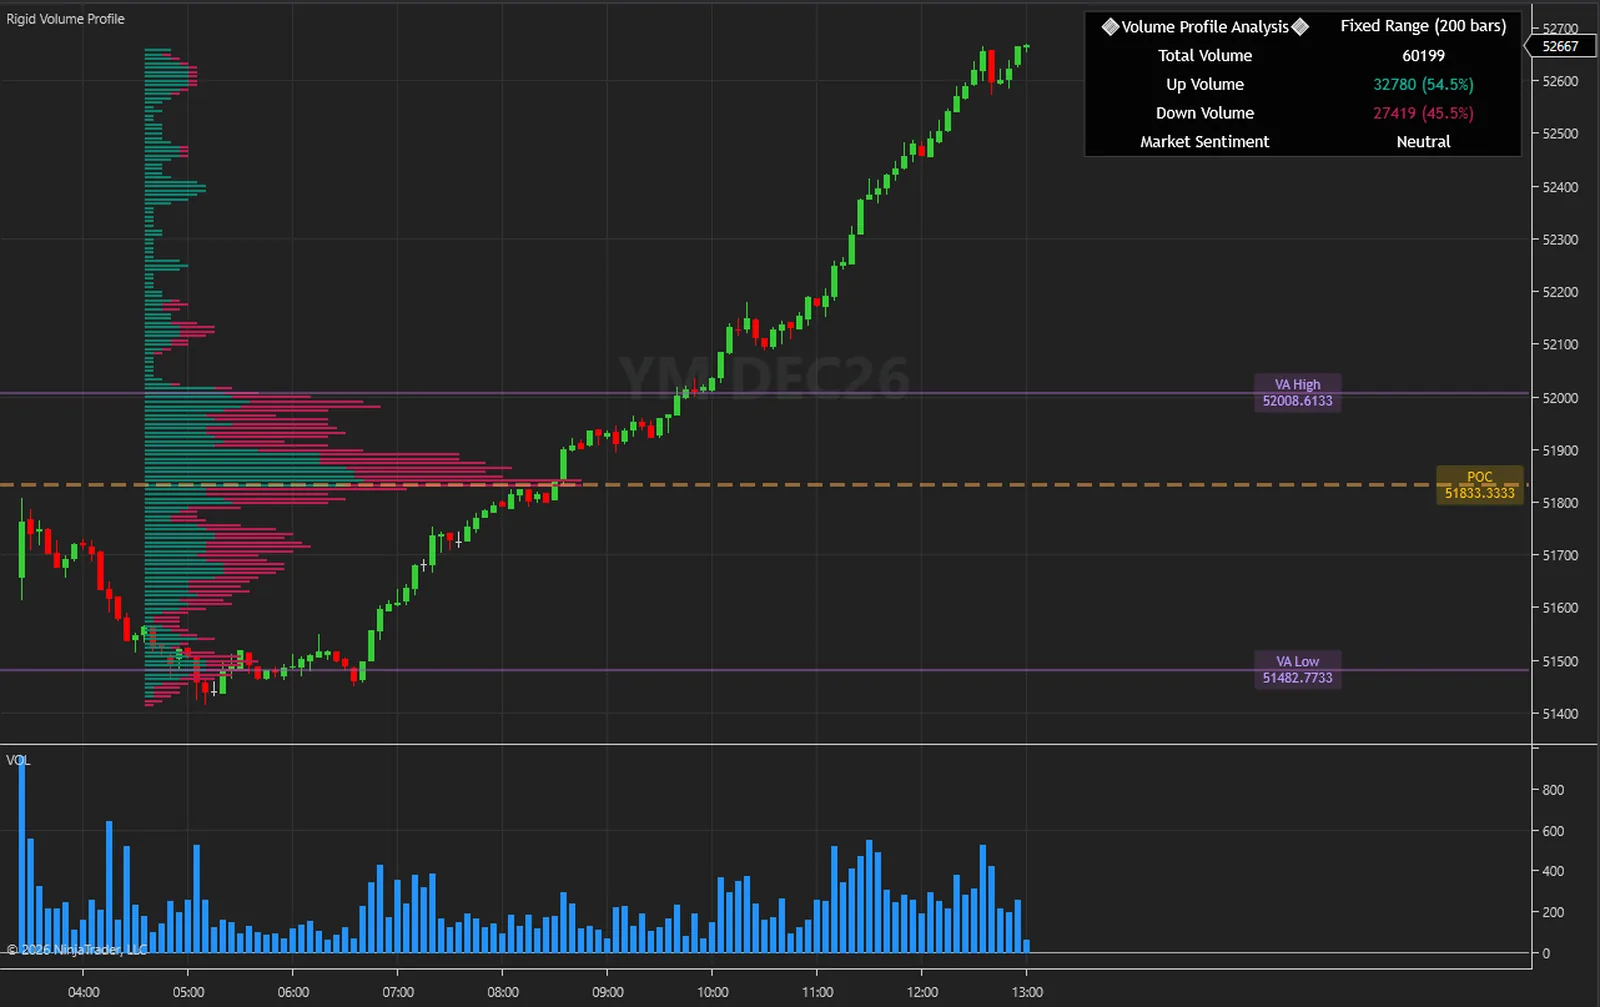
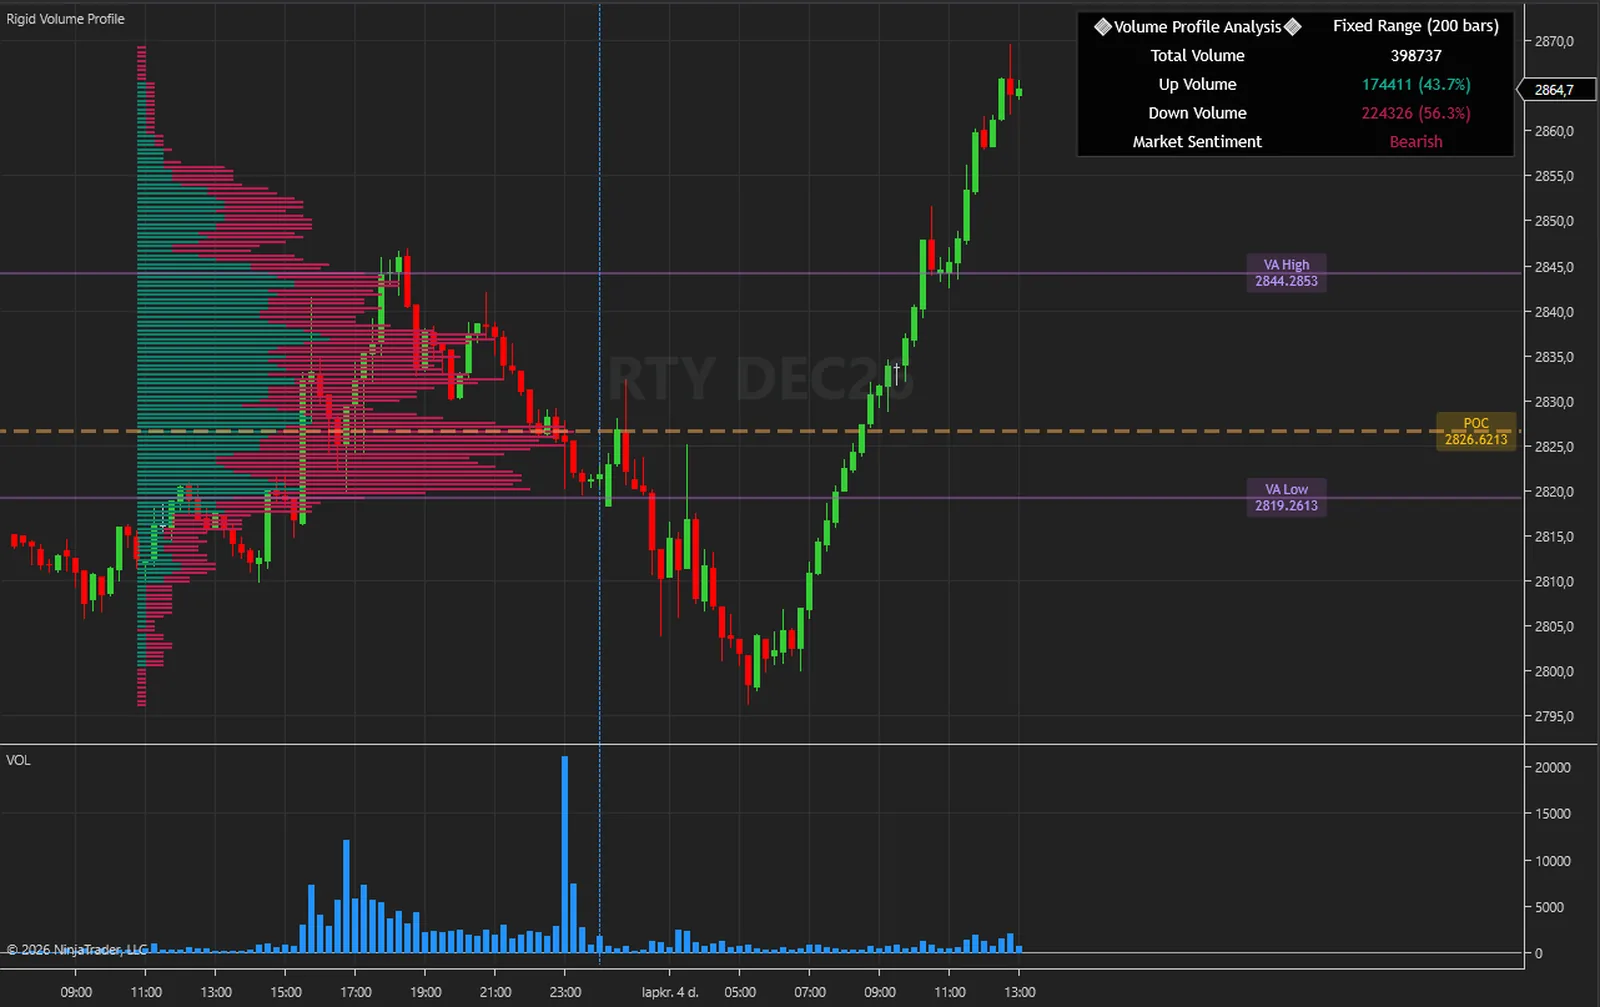
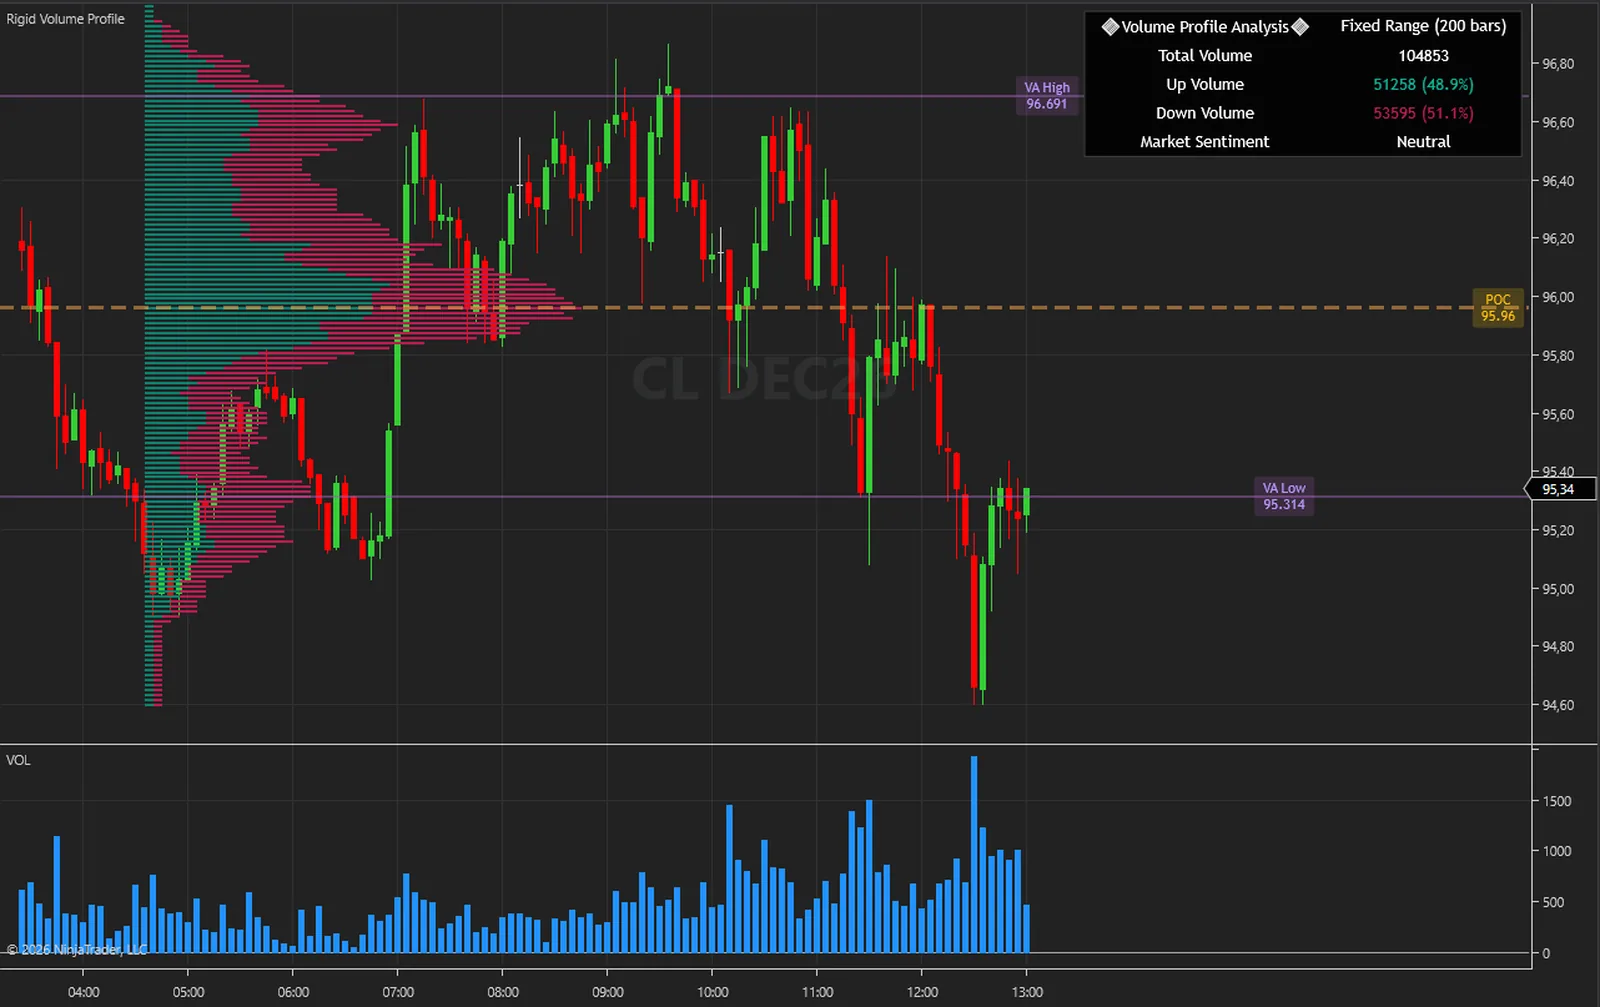
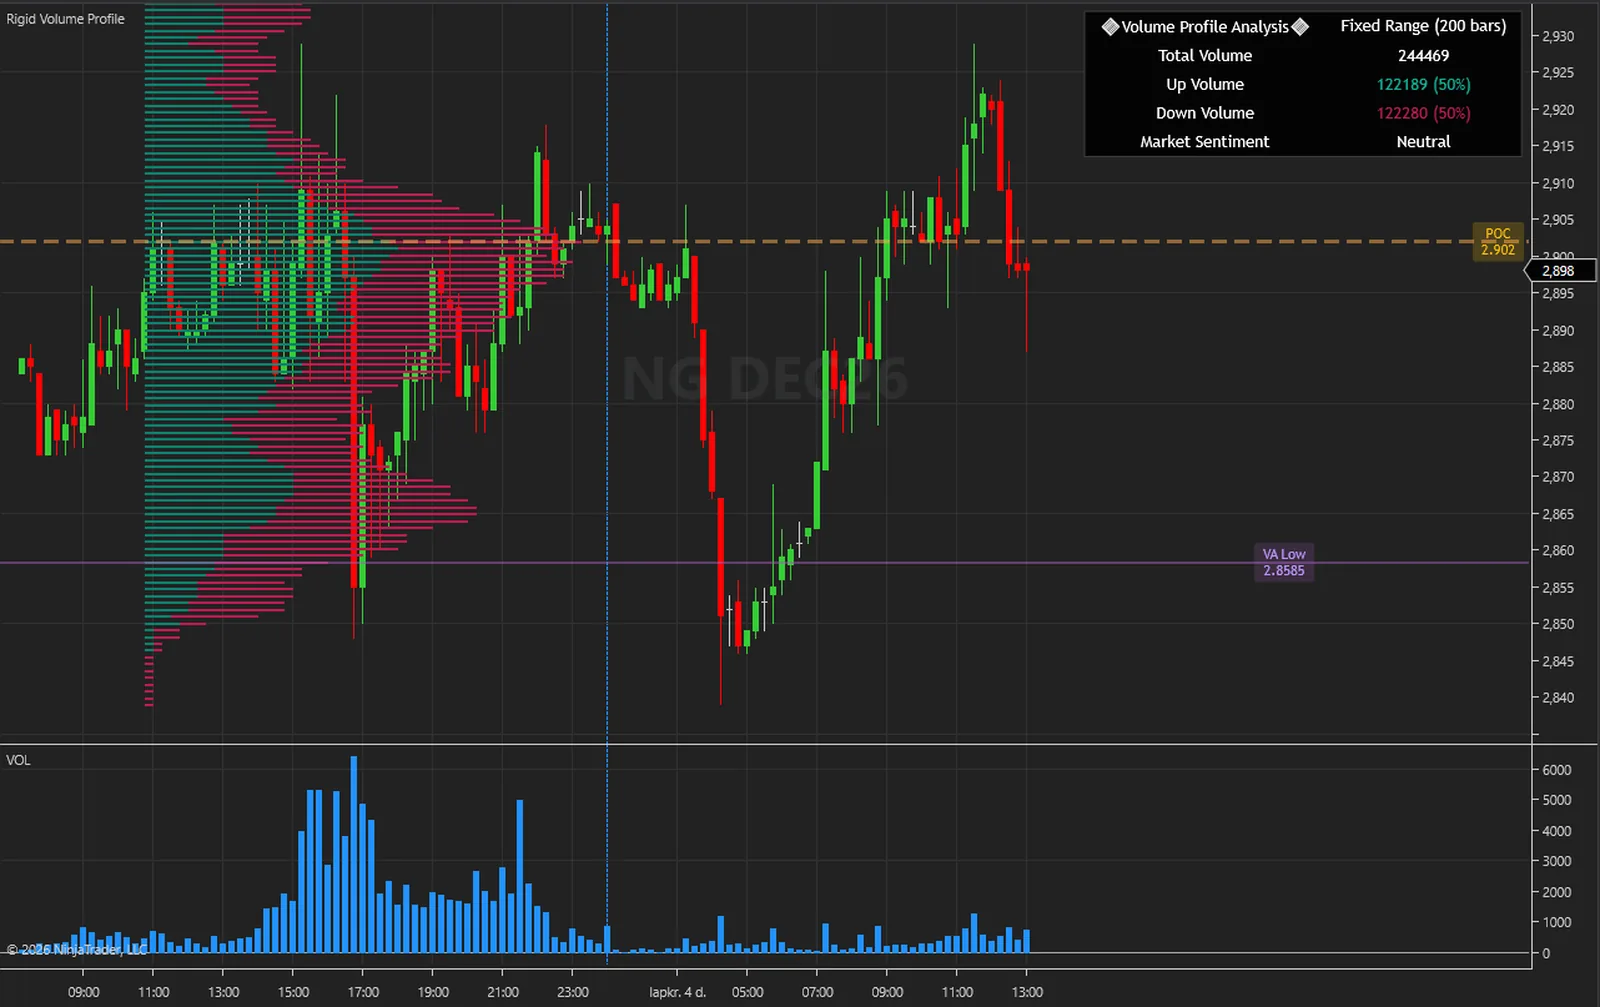
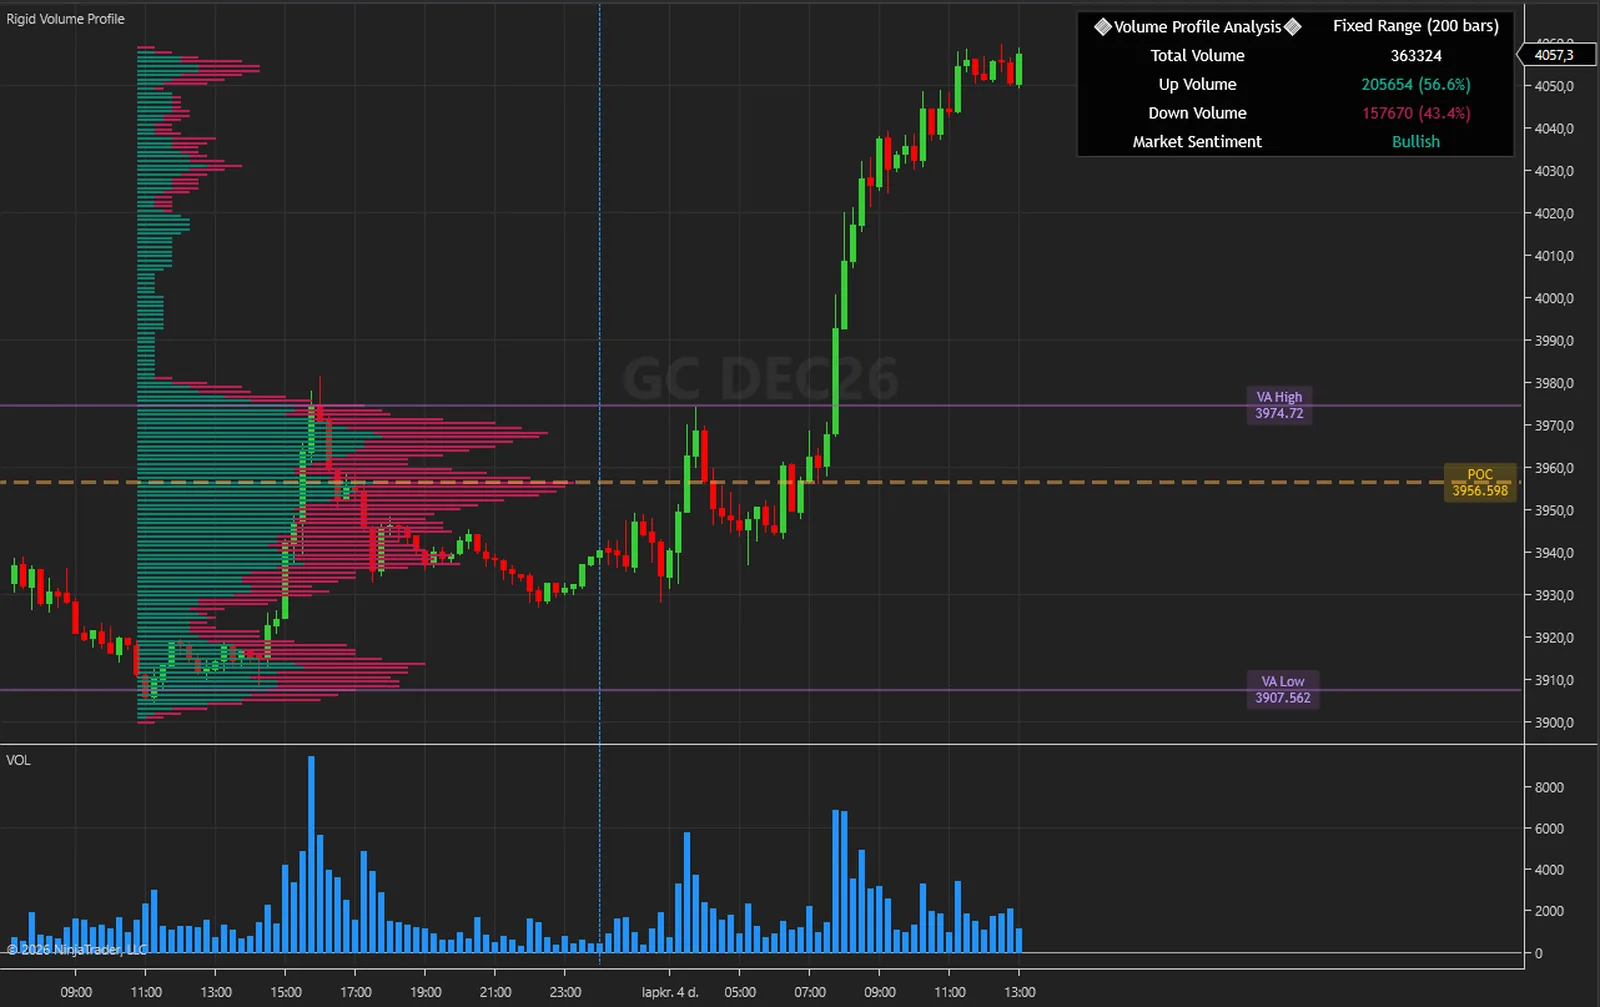
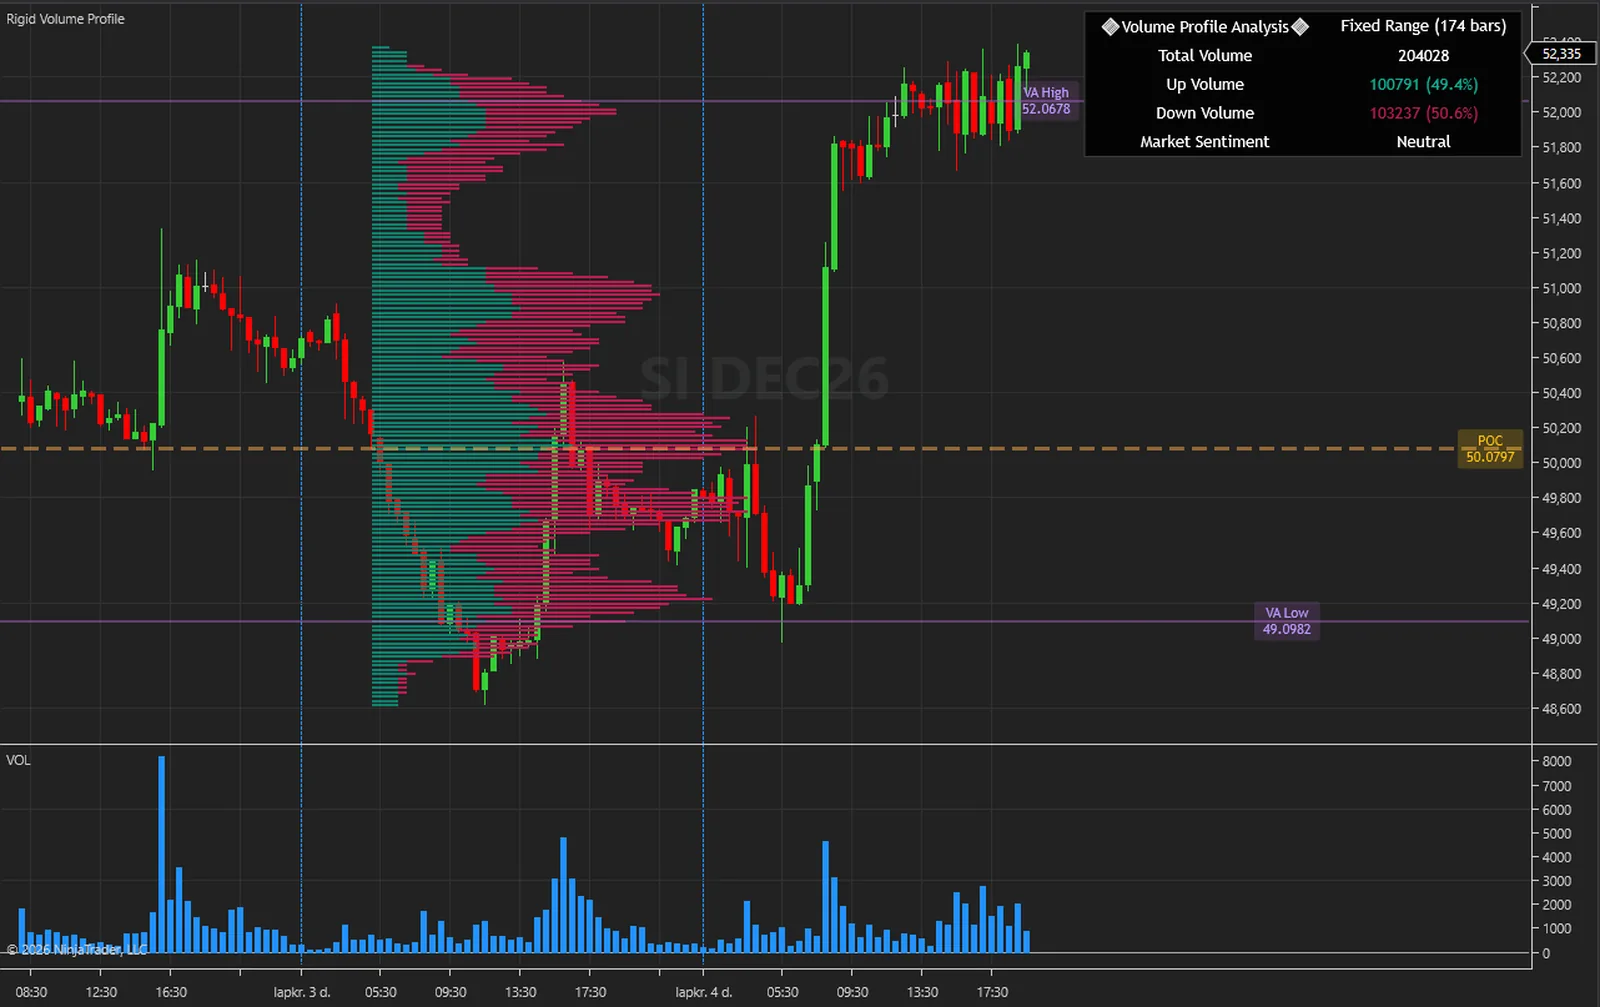
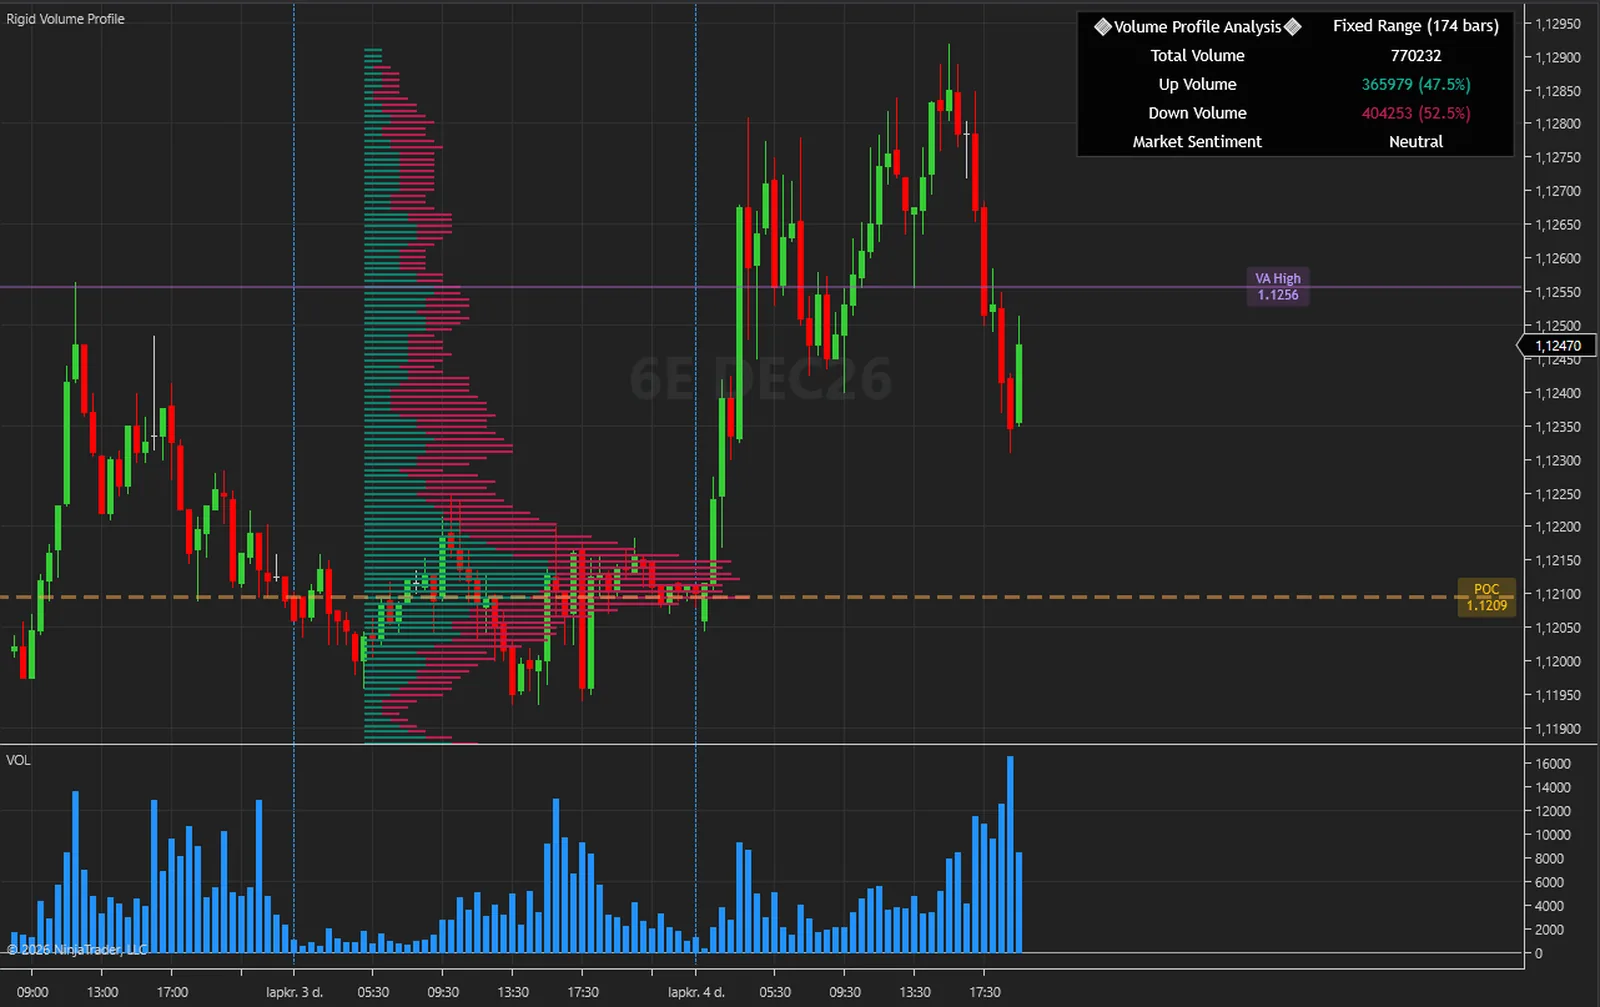
The same five steps each time it recalculates, once per closed bar by default.
The last 200 bars by default, or the bars in view with Use Visible Range. The period is a count of bars, and the chart's Trading Hours template decides which bars exist.
The high-to-low range of the period is split into equal price levels, 150 by default.
Each bar's volume is shared across the levels it touched, and counted as bullish or bearish from the bar's open and close.
The Point of Control is the level with the most volume. The value area is the band of levels around it that holds 70 % of the volume.
The rows, the lines, the tags and the table are painted. With the default OnBarClose that happens once per closed bar. OnEachTick or OnPriceChange include the forming bar, at most once a second.
| Volume bars | Rigid Volume Profile | |
|---|---|---|
| What it shows | Volume per bar, by time | Volume per price level, over the period |
| Busiest price | You cannot read it | The POC line and its price tag |
| Where most volume sat | You cannot read it | A 70 % value area with two tags |
| Up and down volume | Bar by bar | On every level, with totals in the table |
| Period | The bars in view | The last 200 bars, or the bars in view |
| Signals and alerts | None | None: this is a picture of volume, not a signal |
The engine that computes everything also runs outside NinjaTrader. With its diagnostic dump switched on, the NinjaTrader edition writes every committed bar with the values it drew; those bars are replayed through the engine outside the platform, and the two files are compared value by value.
On 5,279 MNQ 1-minute bars every one of the 34 series compared was equal on every bar. A second run, with Calculate set to each tick and the chart left live across the switch from history to live bars, gave the same result on 4,170 bars.
What that proves: the indicator receives exactly one closed bar per chart bar with the right open, high, low, close and volume, never double-feeds or skips a bar, and shows the values the engine produced. What it does not claim: it is a test of correct calculation, not of trading results, and it says nothing about future performance.
The full method is in the user guide: User Guide (PDF) and Installation and Quick Start (PDF).
No subscription and no renewal. Pay once and the indicator stays licensed to your NinjaTrader account, updates included.
Rigid Volume ProfileNinjaTrader 8 indicator
$77one payment, lifetime licence
The licence is issued to your NinjaTrader account through NinjaTrader's Vendor Licensing, by hand, normally within a few hours and always within 24 hours of your form arriving. You get an email with the download link when it is done.
Because a licence cannot be handed back once it is on your account, a sale is final once the licence has been issued. If you paid and the licence has not been issued yet, email me and I will refund you in full. The user guide is public, so you can read exactly what the indicator does before you pay.
The full terms of sale and the privacy notice for buyers are one page each, in plain language.
Trading carries risk of loss. This is an analysis tool, not financial advice, and no indicator can promise a profit.
It prints no signals, so there is nothing to confirm on a closed bar. The profile describes the recent bars and moves as new bars arrive, by design: the POC, the value area and the table all change as the period rolls forward. With the default OnBarClose it recalculates once per closed bar; OnEachTick or OnPriceChange include the forming bar and rebuild at most once a second. A level that falls under the Volume Filter keeps the geometry it was last given until it qualifies again, so after a long session a chart can differ slightly from a freshly loaded one. Reloading the chart redraws it from scratch.
200 bars for the full default period. A chart holding fewer bars than Fixed Analysis Period gets its profile on the bars it has, and a chart of fewer than 50 bars draws nothing. Raise Days to load in the Data Series dialog for the full period. On a continuous contract, a period that spans a roll that is not back-adjusted stretches over the gap.
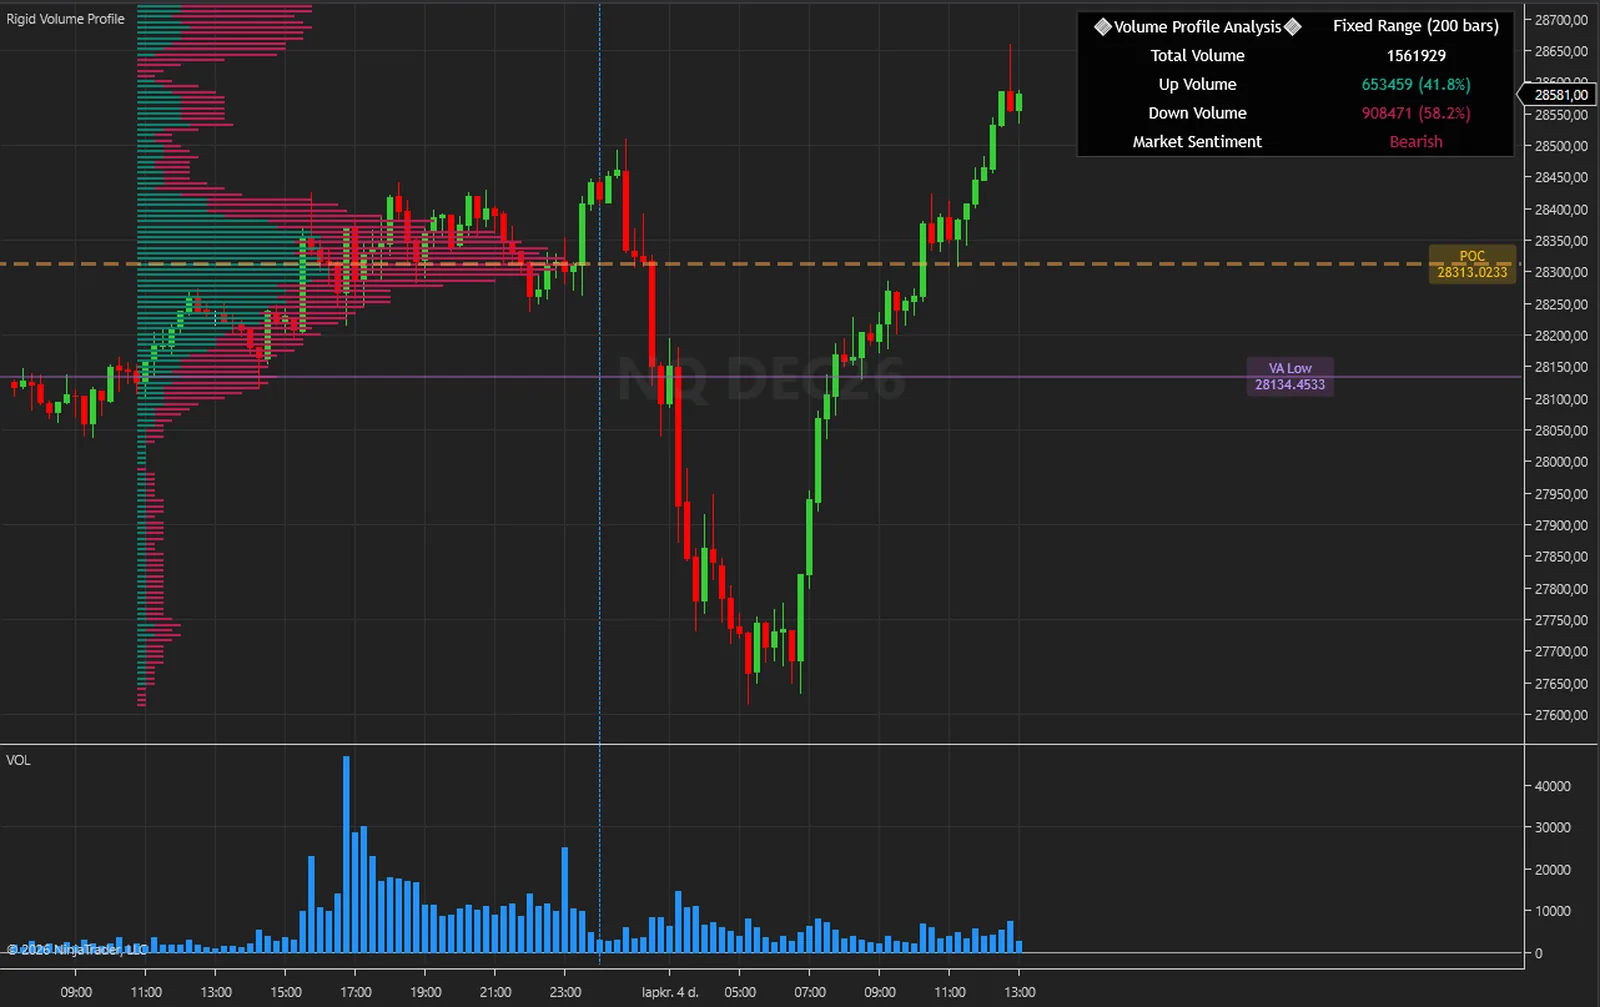
The price axis follows the bars in view, not the profile, so the rows can run off the panel and a level can be out of view. On the MES chart in the gallery the rows run off the bottom of the panel and the VA High tag is the one in view. Drag the price axis to look further, or lower Fixed Analysis Period to bring the period closer to the bars on screen.
That is where the period's bars are. Mirror Profile draws it against the price axis instead, and Profile Width (%) changes its length.
The Poc, VaHigh and VaLow series carry values from the chart's last historical bars onward and are available as Market Analyzer columns on the newest bars. They are not suitable for a historical backtest in the Strategy Analyzer, because the calculation exists on the newest bar only.
NinjaTrader 8.1 Desktop for Windows; the build is tested on 8.1.9.0. Any data connection that delivers bars works, including the free simulation connection.
No. NinjaTrader 8 is free to download and use for charting and simulation, with free real-time futures data for the simulator. A live account with a broker of your choice is a separate step that this indicator does not need. NinjaTrader is the platform it runs inside, not a broker.
No. The licence is tied to your NinjaTrader account login through NinjaTrader's Vendor Licensing, not to a PC. Log in on any installation and the indicator runs; a new PC needs no transfer.
I issue it by hand in the NinjaTrader Vendor Dashboard. It is normally done within a few hours and always within 24 hours of your form arriving, including weekends.
No. It is one payment of 77 USD for a lifetime licence on one NinjaTrader account, with future updates included.
Once the licence has been issued the sale is final, because a licence on your account cannot be handed back. That is why the user guide is public: read it first. If you paid and the licence has not been issued yet, email me and I will refund you in full.
Yes. Email me from the address you bought with and I will move the licence to your new account login.
No indicator can promise that, and this one does not. It gives you a picture of where volume traded on the recent bars, and the price levels that come from it. What you do with that, and how you size positions, decides the outcome.
Each one is a compiled NinjaScript Add-On, 77 USD once, with its own page, charts and public user guide.
A volume profile inside a log-regression channel, one per session, with a Point of Control, session high, low and mid lines, forward extensions and a Buy, Sell and Delta label.
$77 one payment, lifetime licence
Swing highs and lows, BOS and CHoCH lines, order blocks, and a buy or sell arrow when a closed bar retests an active block, with an entry, a stop and two targets.
$77 one payment, lifetime licence
An eight-EMA ribbon with crossover signals, a drawn entry, a stop and up to four targets, shaded target and risk zones, a screener of up to nine instruments and a dashboard of five timeframes.
$77 one payment, lifetime licence
77 USD once. A lifetime licence on your NinjaTrader account, updates included, and the licence issued within 24 hours.


