Reverse RSI bands
The exact price at which RSI would equal 70, 50 and 30 on this bar, with two outer bands for the extreme zone and an optional smoothing.
 Invite-only TradingView indicator
RSI sits in a window under the chart and tells you a number. What you actually need is the price at which it would become overbought or oversold. Reverse RSI Phantom solves the RSI formula backwards and draws those prices as bands, then scores buy and sell signals against five layers and draws the stop and three targets.
$47one payment, lifetime access
Get lifetime access
The published walkthrough: the indicator on real charts, what its inputs do, and which signals to take and which to skip.
RSI tells you it is at 64. It does not tell you what you want to know, which is how far price has to go before it is at 70, and whether that level is above or below the resistance you are watching.
So you look down at the oscillator, look up at the chart, and guess. You also give up a third of your screen to a window whose only job is to show one number.
The RSI formula can be solved the other way round: for any target RSI value there is exactly one price on the current bar that would produce it. Reverse RSI Phantom computes that price in closed form, with no iteration and no approximation, and draws it.
The script page on TradingView is public. Read the full description there before you pay.
An oscillator turned into price levels, with a signal engine built on top of them.
The exact price at which RSI would equal 70, 50 and 30 on this bar, with two outer bands for the extreme zone and an optional smoothing.
The bands come from the previous bar's values, which cannot change. They stay put while the bar forms and only the close moves.
Supertrend is run on the RSI 50 line, not on raw price. It is smoother, so the trend regime flips less often for no reason.
On by default. Buys are allowed only in a bullish regime and sells only in a bearish one, however many layers pass.
Regular bullish and bearish divergence from pivots on the RSI line. Hidden divergence is left out on purpose: on retail timeframes it is noisier.
Trend regime, RSI confirmation, a recent band retest, divergence and a volume burst. One star each, default minimum two.
The tighter of an ATR stop and a band-anchored stop by default, with targets at 1R, 2R and 3.5R, tracked and ticked off.
Regime, price against the midline, RSI and both band prices, live buy and sell scores, and the open trade. Six positions.
Signals, trend shifts, divergences, closes beyond either band, each target and the stop. Nothing fires for old history.
Every picture below is a TradingView capture with numbered notes added. Nothing on the charts is drawn by hand. Click any image to enlarge it.
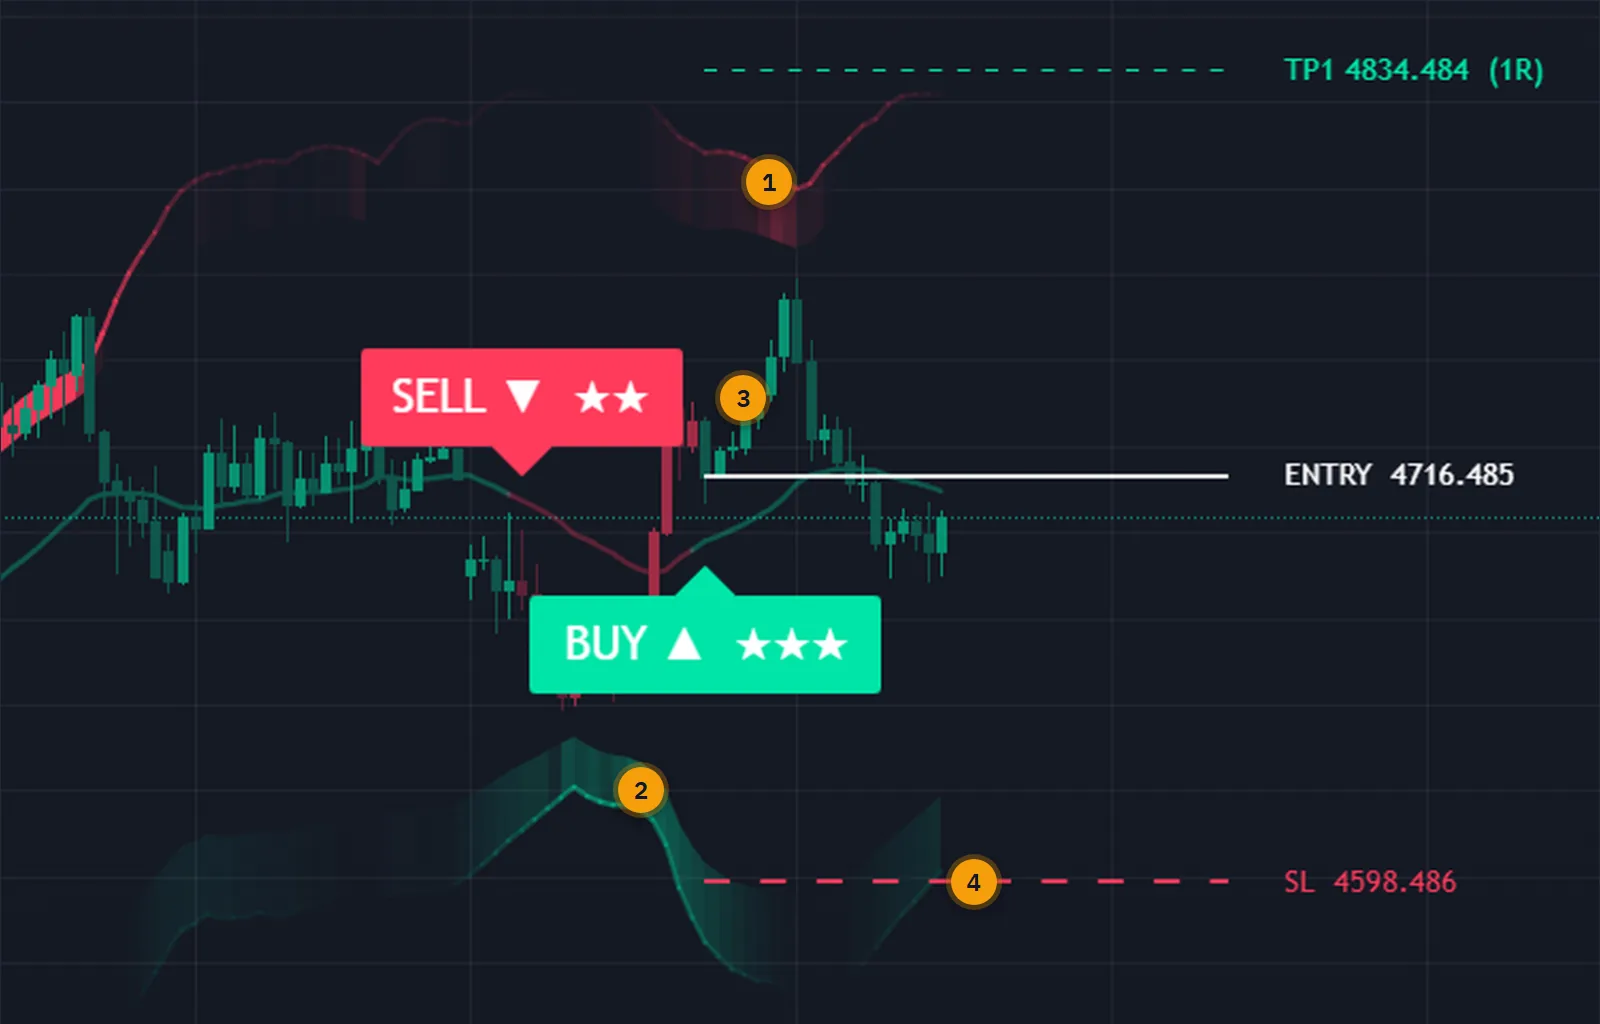
The upper band is where RSI would read 70 and the lower band where it would read 30. You can see at a glance how much room price has before momentum is stretched, and whether that point lines up with a level you already care about.
A close beyond a band, a flip of the midline trend or a confirmed divergence can each start a signal. Whether it prints depends on the score.

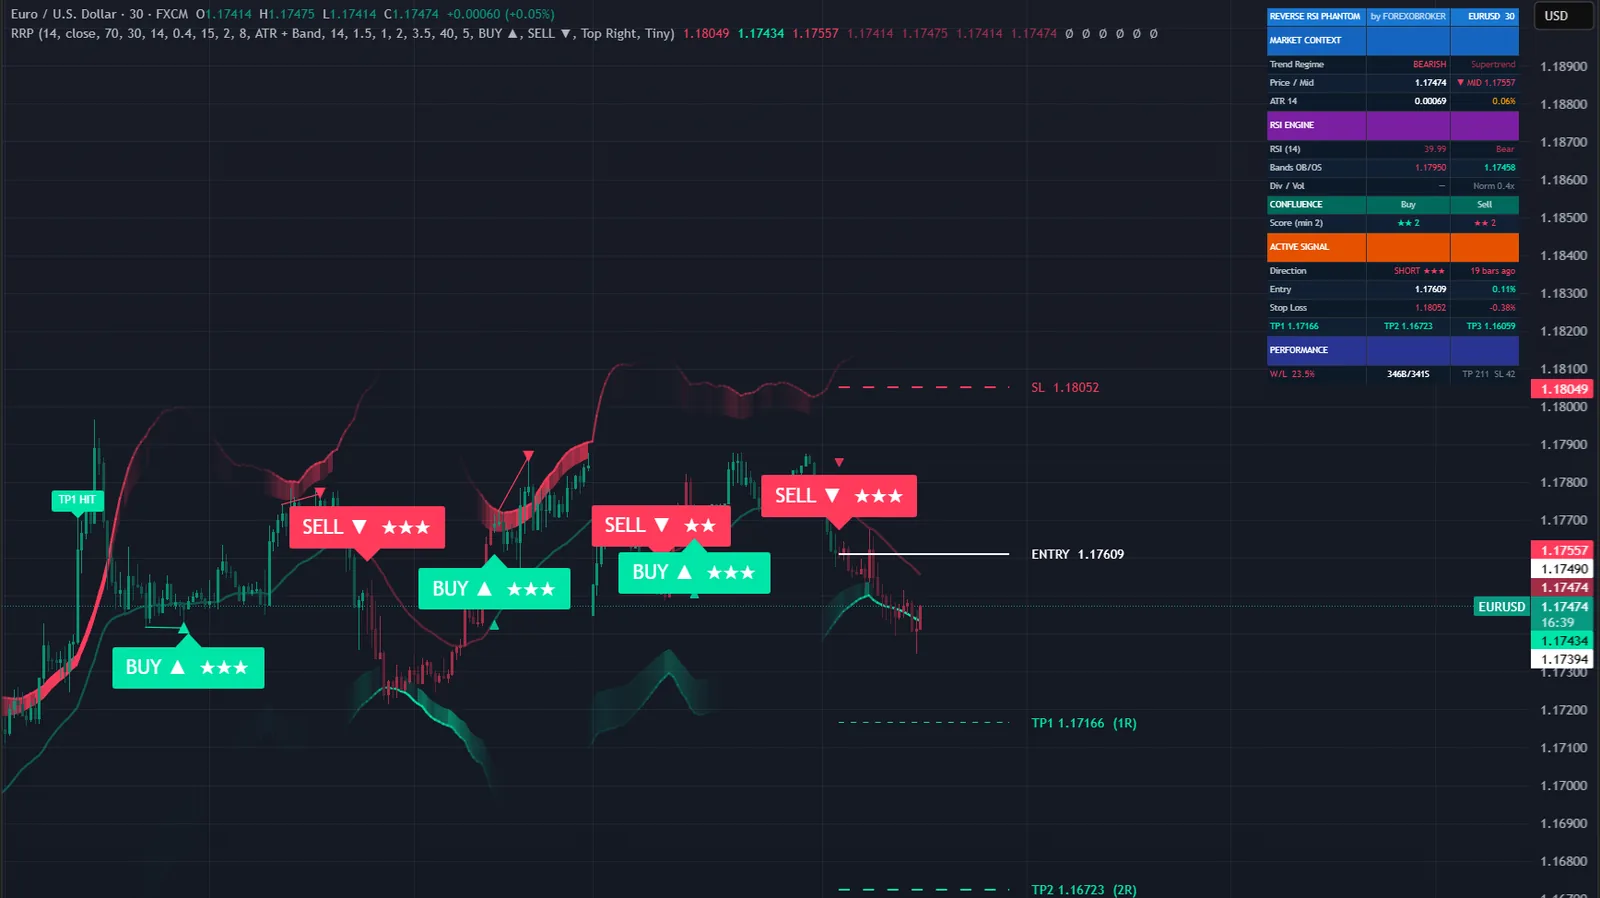
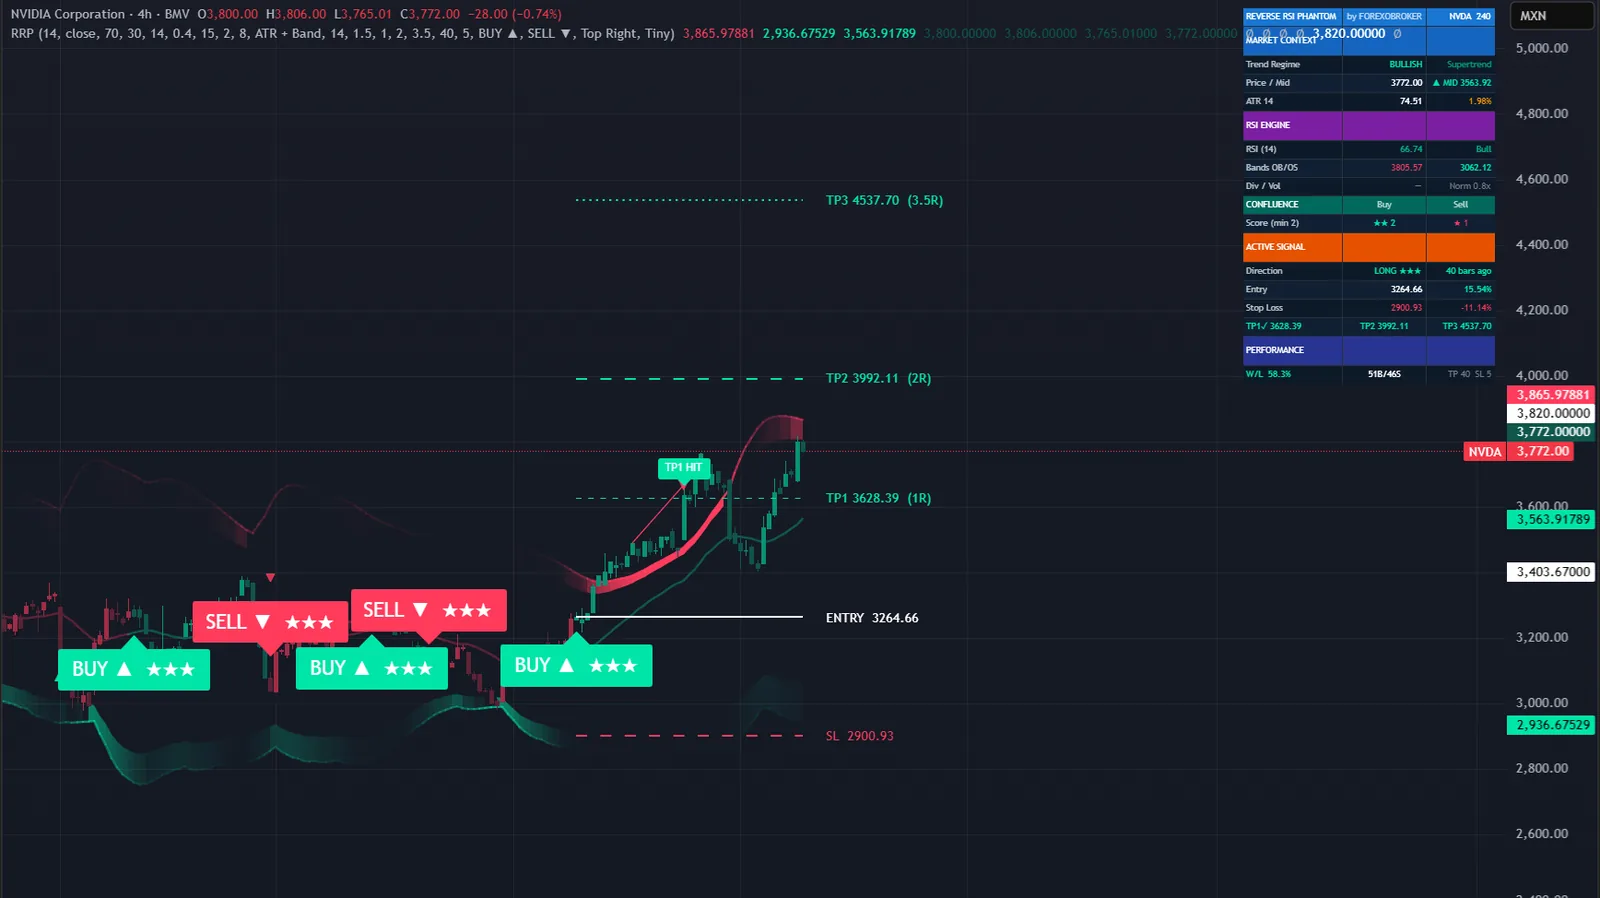
The RSI block gives the current RSI with its state and the two band prices on one row, so you can set a limit order or an alert at the exact level without hovering over the chart.
Below it are the live buy and sell scores against your minimum, and the open trade with entry, stop and the three targets. A last block keeps the tool's own running counts on this chart.
The inversion is pure arithmetic on the RSI formula, so it applies to any symbol and any timeframe.
The volume layer needs real volume. Where there is none, switch that layer off: a disabled layer awards a free point, so your scores stay comparable.




RSI turns average gains and losses into a number from 0 to 100. Here the number is given and the price is the unknown.
Say 70. That fixes the ratio of average gain to average loss that RSI would need: 70 divided by 30.
Take the smoothed average gain and loss as they stood at the close of the previous bar. Those values can no longer change.
Work out the single price change on this bar that would bring the averages to that ratio. It is one formula, not a search.
Add that change to the previous close. That price is the band. Repeat for 50 and 30.
| Standard RSI | Reverse RSI Phantom | |
|---|---|---|
| Where it lives | A separate window | On the price chart |
| What it tells you | A number from 0 to 100 | The price at which RSI hits 70, 50, 30 |
| Trend context | None | Supertrend on the RSI midline |
| Divergence | Spot it yourself | Detected from pivots and marked |
| Signals | Threshold crosses | Five layers, scored, trend-gated |
| Stop and targets | None | Drawn with the signal, in R |
No subscription and no renewal. Pay once and the indicator stays on your TradingView account, updates included.
Reverse RSI PhantomTradingView indicator
$47one payment, lifetime access
Access is granted by hand from my TradingView account, normally within a few hours and always within 24 hours of your form arriving.
Because access to an invite-only script cannot be handed back, a sale is final once access has been granted. The script page on TradingView is public, so you can read the full description and see it on charts before you pay.
The full terms of sale and the privacy notice for buyers are one page each, in plain language.
Trading carries risk of loss. This is an analysis tool, not financial advice, and no indicator can promise a profit.
No. All signals are evaluated on closed bars only. The bands are non-repainting in a stronger sense: they are computed from the previous bar's smoothed values, which are fixed once that bar has closed, so the band positions do not move while the current bar forms.
The bands are RSI, solved for price, and that alone changes how you use it: you can place an order or an alert at the level. On top of that the indicator adds a trend regime from a Supertrend on the midline, pivot-based divergence, a five-layer score and a stop with three targets.
Thirteen, all on the bar close: BUY, SELL and any signal, bullish and bearish trend shift, bullish and bearish divergence, a close above the upper band or below the lower band, TP1, TP2, TP3 and the stop. Nothing fires for old history when you first add the indicator.
No. Invite-only indicators work on the free plan. The free plan limits how many indicators you can have on one chart and how many alerts you can run, so a paid plan helps if you use many, but it is not required for this one.
I grant access by hand from my TradingView account. It is normally done within a few hours and always within 24 hours of your form arriving, including weekends.
No. It is one payment of 47 USD for lifetime access on one TradingView username, with future updates included.
Once access has been granted the sale is final, because access to an invite-only script cannot be returned. That is why the script page on TradingView is public: read it and look at the charts first. If you paid and access has not been granted yet, email me and I will refund you in full.
Yes. Email me from the address you bought with and I will move the access to your new username.
Yes. A MetaTrader 4 and 5 edition is on the MQL5 Market. It is a separate product sold by that store; this page is the TradingView edition.
No indicator can promise that, and this one does not. It gives you a clear, rule-based reading of the chart and a plan to work from. What you do with that, and how you size positions, decides the outcome.
Each one is invite-only, 47 USD once, and has its own page with charts and a full description.
A non-repainting adaptive Ichimoku trading system.
$47 one payment, lifetime access
A non-repainting momentum confluence indicator that scores every closed bar against three independent tests.
$47 one payment, lifetime access
An adaptive trend-following indicator combining a dynamic SuperTrend engine with a Trend Quality Index and three optional confluence filters.
$47 one payment, lifetime access
47 USD once. Lifetime access on your TradingView username, updates included, and access granted within 24 hours.


