Order blocks
The last opposing candle before a pivot, drawn as a zone and extended forward. It turns grey the moment price closes through it, so dead zones stop asking for attention.
 Invite-only TradingView indicator
Most Smart Money indicators draw order blocks and fair value gaps and then leave the decision to you. Smart Liquidity Matrix draws five structure layers by written rules, then scores a buy or sell out of five, places the stop behind the last pivot, and checks the same signal on 21 timeframes.
$47one payment, lifetime access
Get lifetime access
The published walkthrough: the indicator on real charts, what its inputs do, and which signals to take and which to skip.
Anyone can mark an order block after the move. The trouble with Smart Money trading is that the chart fills with boxes and lines, every one of them looks important, and none of them tells you when to act.
Marked by hand, the zones are also different every time: you and the person next to you will not draw the same order block on the same chart, and you will not draw it the same way twice.
Smart Liquidity Matrix fixes both. The structures follow written rules on closed bars, so they are reproducible, and a separate signal engine decides when trend, a pivot retest and up to three further checks line up.
The script page on TradingView is public. Read the full description there before you pay.
Each layer has its own switch and colour, and a Lite Mode strips the chart back when you want it clean.
The last opposing candle before a pivot, drawn as a zone and extended forward. It turns grey the moment price closes through it, so dead zones stop asking for attention.
Three-candle gaps drawn as dashed boxes and removed from play when price closes through them. You set how many to keep per side.
A break that continues the trend is labelled Break of Structure. A break against it is labelled Change of Character. Separate colours, separate alerts.
Equal highs and lows mark where stops collect. A sweep is flagged when price wicks beyond one and closes back inside.
Trend plus a pivot retest makes a base signal. RSI, volume and the higher-timeframe trend can each add a point, up to five. You set the minimum.
Stop behind the most recent opposing pivot with ATR padding, TP1 at 1R, TP2 from 1R to 5R. The lines clear themselves when the trade closes.
The identical signal function runs on every timeframe from one second to one month, so agreement across timeframes is visible in one grid.
Signals, each kind of structure break, and sweeps up or down. All fire on the bar close, with webhook JSON if you want it.
Everything is evaluated on confirmed bars, and period levels are read with a one-bar shift, so nothing looks into the future.
Every picture below is a TradingView capture with numbered notes added. Nothing on the charts is drawn by hand. Click any image to enlarge it.
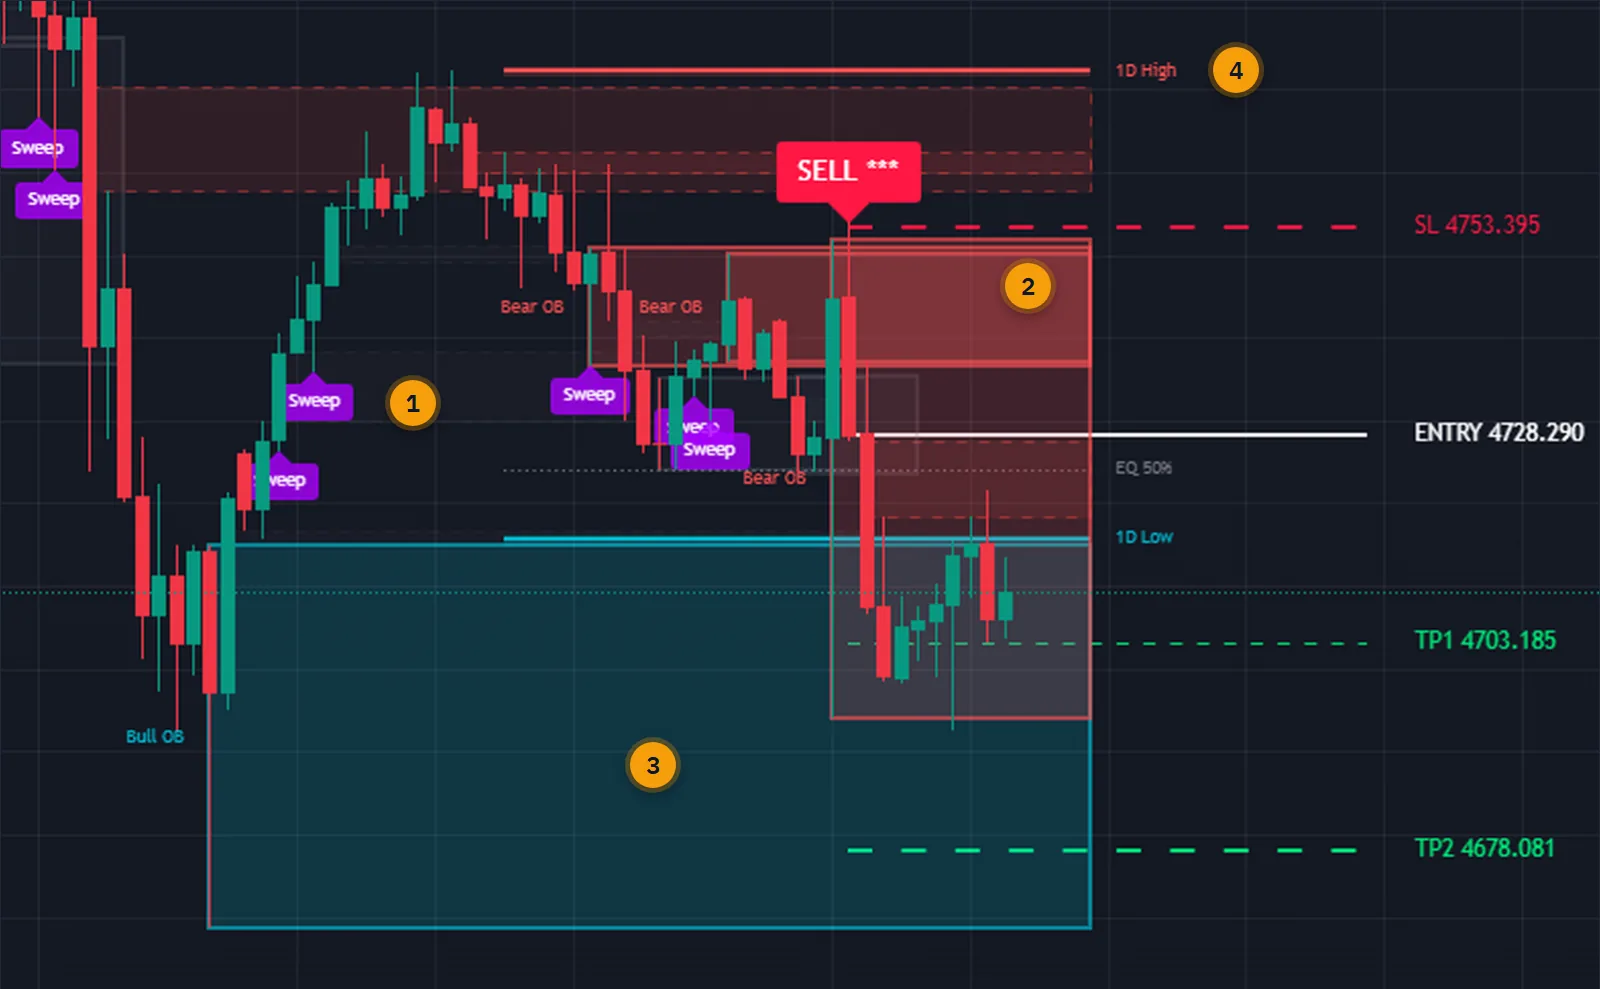
Every zone here was placed by a rule, not by eye. An order block is the last opposing candle before a confirmed pivot. A sweep is a wick beyond a level with a close back inside. Because the rules run on closed bars, the chart you study later is the chart you traded.
Zones clean up after themselves. An order block that price closes through turns grey and stops extending, and a filled fair value gap is removed, so the screen shows what still matters.
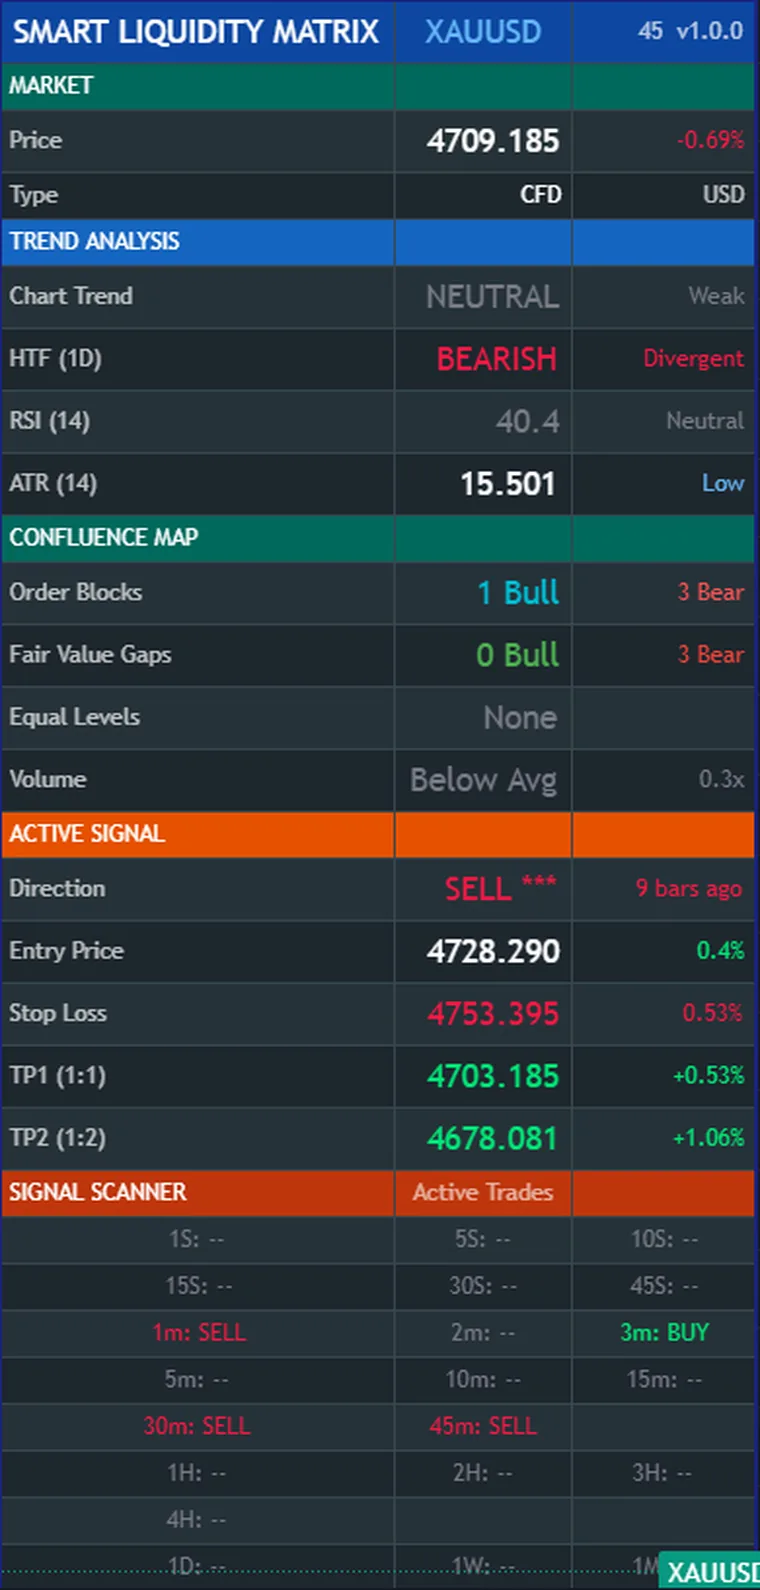
The panel reads the chart for you: the trend and how strong it is, whether the higher timeframe agrees, how many order blocks and gaps are active on each side, and the open signal with its live distance to stop and targets.
The scanner underneath runs the same signal on every timeframe TradingView has. When several of them say the same thing, you can see it without opening a second chart.
The rules are about candles, pivots and ATR, so they apply to any symbol and any timeframe. The equal-level test scales with ATR, which is why it works on gold and on a currency pair without retuning.
The volume bonus needs real volume. On symbols without it that point simply does not score, and the rest of the engine carries on.


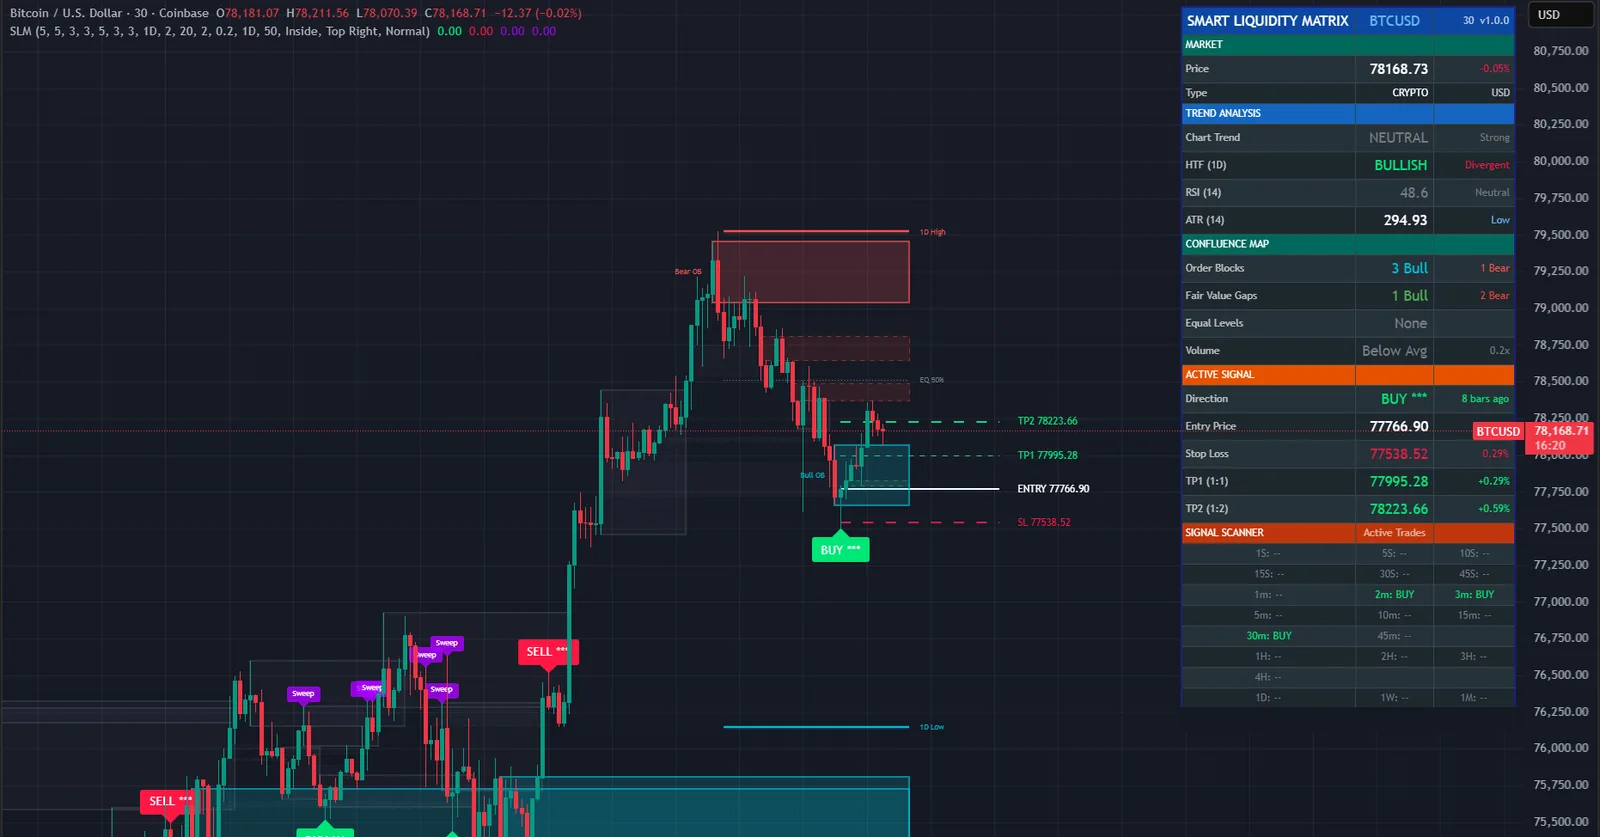


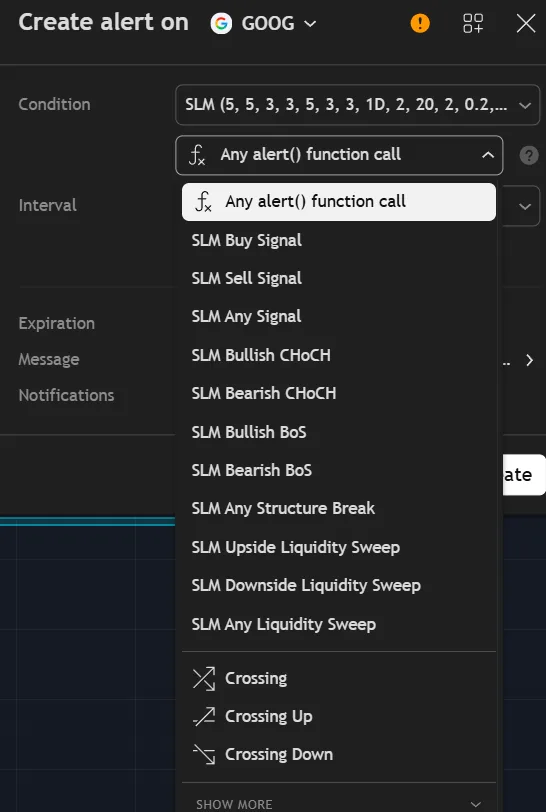
Eleven alert conditions cover the three things worth being interrupted for: a signal, a structure break and a liquidity sweep. Each fires once, when the bar closes.
The messages carry the ticker, timeframe, direction, score, price and the stop and target levels. Switch to webhook mode and the same fields arrive as JSON for a bot.
Two conditions must be true for a signal to exist at all. Three more can raise its score.
EMA 20 above EMA 50 for a buy, below for a sell. Required.
Price must come back to within 0.3 ATR of the last pivot and close in the signal direction. Required. Together with trend this is the base score of two.
RSI not already overbought for a buy or oversold for a sell adds a point. Volume above its 20-bar average adds another.
A higher-timeframe EMA, daily 50 by default, pointing the same way adds the fifth point.
| Typical SMC overlay | Smart Liquidity Matrix | |
|---|---|---|
| Zones | Drawn, then left on the chart | Greyed or removed once price closes through |
| Signals | None, you decide | Scored 2 to 5, minimum set by you |
| Trade plan | You measure it | Entry, stop, TP1 and TP2 drawn |
| Overtrading | Nothing stops it | One trade at a time, with a cooldown |
| Multi-timeframe | Open more charts | 21 timeframes in one grid |
| Alerts | Few or none | 11 conditions, webhook JSON |
No subscription and no renewal. Pay once and the indicator stays on your TradingView account, updates included.
Smart Liquidity MatrixTradingView indicator
$47one payment, lifetime access
Access is granted by hand from my TradingView account, normally within a few hours and always within 24 hours of your form arriving.
Because access to an invite-only script cannot be handed back, a sale is final once access has been granted. The script page on TradingView is public, so you can read the full description and see it on charts before you pay.
The full terms of sale and the privacy notice for buyers are one page each, in plain language.
Trading carries risk of loss. This is an analysis tool, not financial advice, and no indicator can promise a profit.
No. Structures and signals are evaluated on confirmed bars only, and the previous-period levels are read with a one-bar shift so they cannot look ahead. Once something is drawn it stays where it was drawn, until the rule that removes it is met.
A Break of Structure is a break in the direction of the existing trend, so it signals continuation. A Change of Character is a break against the existing trend, so it signals a possible reversal. The indicator labels each one and has separate alerts for them.
Any symbol and any timeframe TradingView offers. The scanner covers 21 timeframes from one second to one month. Second-based timeframes need a TradingView plan that provides them.
No. Invite-only indicators work on the free plan. The free plan limits how many indicators you can have on one chart and how many alerts you can run, so a paid plan helps if you use many, but it is not required for this one.
I grant access by hand from my TradingView account. It is normally done within a few hours and always within 24 hours of your form arriving, including weekends.
No. It is one payment of 47 USD for lifetime access on one TradingView username, with future updates included.
Once access has been granted the sale is final, because access to an invite-only script cannot be returned. That is why the script page on TradingView is public: read it and look at the charts first. If you paid and access has not been granted yet, email me and I will refund you in full.
Yes. Email me from the address you bought with and I will move the access to your new username.
Yes. A MetaTrader 4 and 5 edition is on the MQL5 Market. It is a separate product sold by that store; this page is the TradingView edition.
No indicator can promise that, and this one does not. It gives you a clear, rule-based reading of the chart and a plan to work from. What you do with that, and how you size positions, decides the outcome.
Each one is invite-only, 47 USD once, and has its own page with charts and a full description.
Pivot highs and lows joined by sloped trendlines, with buy and sell signals on a confirmed break at bar close.
$47 one payment, lifetime access
A non-repainting signal and trade-management indicator: supply and demand zones with break of structure, a higher-timeframe cross, a stop and three targets.
$47 one payment, lifetime access
A non-repainting EMA crossover indicator that filters the false crosses a bare crossover leaves behind.
$47 one payment, lifetime access
47 USD once. Lifetime access on your TradingView username, updates included, and access granted within 24 hours.


